SHORT Nvidia, Bearish Chart Setup, Resistance ConfirmedThe resistance from 21-May has been confirmed 28-May.
The same level has been working as resistance since 14-May.
After two weeks, this resistance level continues to hold and it is now confirmed.
In November 2024 NVDA produced a high.
Later in January 2025 NVDA produced an all-time high.
18-February 2025 NVDA went to produced a lower high; a rejection that led to a major drop.
The major drop resulted in a recovery and the recovery found resistance earlier this month. This resistance, the same from 14-May, 21 and 28-May, is also a lower high compared to the previous levels just mentioned.
The signal here is double: (1) Resistance confirmed and (2) a lower high.
There is one more. 28-May produced a volume breakout day. The day ended up closing red. So, Nvidia is confirmed bearish now.
Thank you for reading.
Namaste.
Nvidia

$NVDA – Earnings Super Bubble?🚨 Nvidia is reporting earnings tomorrow, and the market is waiting with bated breath.
While analysts pile on with hyper-bullish predictions extrapolating the AI super bubble, they seem to ignore one glaring fact:
👉 The last time Nvidia beat earnings, the stock crashed -45% shortly after.
Technical view:
We’re near resistance at the previous post-earnings high.
RSI sits at 63.80, hinting at possible exhaustion.
Volume spikes hint at indecision, not confirmation.
This could be a make or break moment for NASDAQ:NVDA and by extension, the entire Tech sector.

ALTCOIN ROADMAP: REVISITED!!! Ethereum vs NvidiaOne of the most insightful ratio charts that provides a remarkable glimpse into the vitality of Altcoins and the appetite for risk is when Ethereum outshines one of the fastest rising stars in the stock market, #NVDA!
The conventional Altcoin index indicates how many of the top 100 Altcoins are outperforming #BTC.
This is indeed a valuable metric that we can rely on for identifying peaks.
However, I believe that if we broaden our perspective and examine the ETH ratio against a Tech Titan, we can truly pinpoint the timing of the banana zone. When it starts and when it is confirmed violent uptrend.
My interest in this ratio was sparked when ETH was still a proof of work coin, validated through GPUs; it seemed like a natural starting point to assess whether the ETH price was overvalued or undervalued.
Even after the transition to POS, I still think it’s worth analysing, as shown by the recent double bottom on the ratio!
The next crucial question is when we can break the multi-year downtrend to genuinely confirm the Banana zone. Because without ETH, there’s no party.
If we enter a big strong banana zone, I believe the ratio could swiftly trend towards 100, so we will be keeping a close eye on it!

NVDA NVIDIA Corporation Options Ahead of EarningsIf you haven`t bought NVDA before the previous earnings:
Now analyzing the options chain and the chart patterns of NVDA NVIDIA Corporation prior to the earnings report this week,
I would consider purchasing the 131usd strike price Puts with
an expiration date of 2025-6-20,
for a premium of approximately $7.00.
If these options prove to be profitable prior to the earnings release, I would sell at least half of them.
I`m overall bullish long term on NVDA.
Disclosure: I am part of Trade Nation's Influencer program and receive a monthly fee for using their TradingView charts in my analysis.

This 3 Step System Will Show You The Trending StockThis is a powerful chart for you to watch.
Because its following the Rocket booster
strategy.
The Rocket booster Strategy has 3 Steps;
1-The price has to be above the 50 EMA
2-The price has to be above the 200 EMA
3-The price should gap up or trend up.
In order for us to know whether the price
will trend up we are using the ADX indicator.
We make sure that the Blue line
Is rising between the Green line
and the Red line .
This confirms the last step of the rocket booster
strategy.Also remember that the NASDAQ is up-trending.
Rocket boost this content to learn more.
Disclaimer;Trading is risky please use a simulation account
for trading before you trade with real money.
Also learn risk management and profit taking strategies.

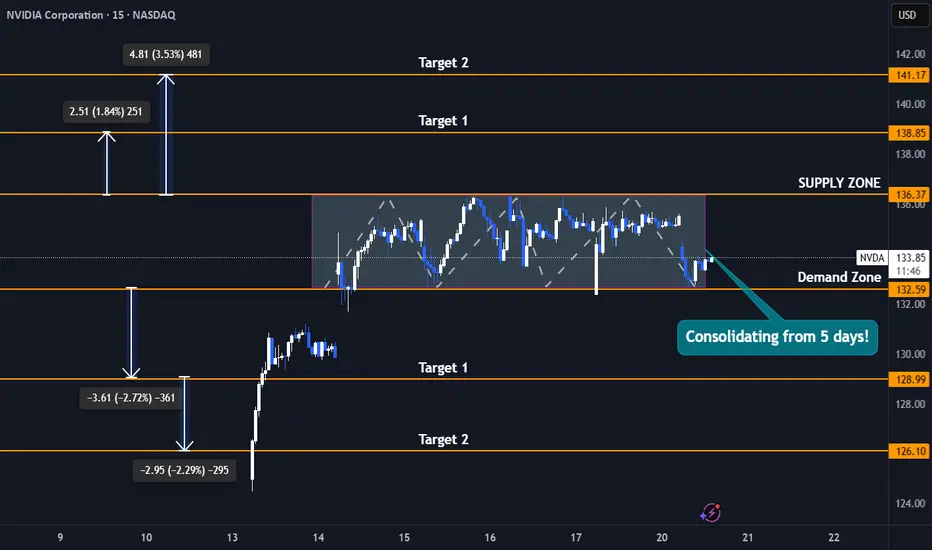
Nvidia Stock 5-Day Consolidation Breakout - Uptrend or Pullback?Trade Duration: Intraday
Trade Type: Breakout
- Nvidia is currently consolidating tightly between $132 and $136, forming a narrow range that reflects a balance between buyers and sellers unwilling to relinquish control. This range-bound action signals indecision, but it won’t last indefinitely.
- Typically, the longer the consolidation, the more significant the subsequent move. As new participants enter the market, a breakout—whether upward or downward—can trigger a powerful surge.
- This move is often amplified by breakout buyers joining in and stop-loss orders of trapped traders being triggered, creating an ideal setup for an intraday breakout trade.
- I plan to initiate either a buy or sell position depending on the breakout direction, capitalizing on the momentum generated by this tight consolidation phase.
Upside Targets : 138$ and 141$
Downside Targets : 128$ and 126$
$NVTS is up 125%, but they might not be done yet!NASDAQ:NVTS Could see more upside if...
We close the week above $4.66 Double Bottom Breakout. This would lead us to the following targets...
🎯$6📏$7.76
- Bullish cross on H5_L indicator
- Volume shelf launch with GAP
- NASDAQ:NVDA Partnership
- Small Cap
- High Short Float

NVIDIA The 1W MA100 rebound is targeting $225 at least.NVIDIA Corporation (NVDA) broke last week above its 1W MA50 (blue trend-line) for the first time in 2.5 months and all this is generated by April's bottom rebound on the 1W MA100 (green trend-line).
The 1W MA100 has been intact since January 23 2023, so this rebound technically initiates a new Bullish Leg. Since the December 2018 bottom (previous U.S. - China Trade War), the minimum rise on such a Bullish Leg has been +156.11%. As a result, NVIDIA can now target $225 at least before the end of 2025.
-------------------------------------------------------------------------------
** Please LIKE 👍, FOLLOW ✅, SHARE 🙌 and COMMENT ✍ if you enjoy this idea! Also share your ideas and charts in the comments section below! This is best way to keep it relevant, support us, keep the content here free and allow the idea to reach as many people as possible. **
-------------------------------------------------------------------------------
💸💸💸💸💸💸
👇 👇 👇 👇 👇 👇

Nvidia —Resistance Turns Support Support Confirmed—ATH 260-194This week closes as a full green candle. A rising window or gap was left along the way. This is a bullish development.
The full green candle comes after a rounded bottom and double-bottom long-term. Coming from a resistance level turned strong long-term support.
Keeping it simple, NVDA has been rising and the chart shows potential for additional growth. There can be retraces and corrections; Any retraces and corrections are an opportunity to buy-up, rebuy and reload.
In the case of a strong correction, always, we will end up with a higher low compared to the 7-April weekly session. This session marks the bottom of the correction.
A higher low means the bullish structure remains intact. A bullish structure means a bullish trend. A bullish trend means rising prices which will end up with a new All-Time High in late 2025.
Two new All-Time Highs possible and highly probable in 2025. 194 (mid-term) & 260 (long-term).
Thank you for reading.
Support boost and follow.
Namaste.

NVIDIA (NVDA) 4H Outlook – May 2025Price has recently shown multiple Breaks of Structure (BoS) to the upside, suggesting a potential shift in market sentiment. After a liquidity sweep of the prior low, price began forming higher highs and higher lows.
Currently trading around $116.62, NVDA may revisit the demand zone between $107.99–$110 (highlighted in green) before resuming bullish momentum. If that level holds, we could see a continuation towards the $129.41 target zone, aligning with prior market structure and supply.
This setup aligns with smart money concepts—monitor for confirmation at the demand zone before entering long.

$NVDA Hits Key Inflection Zone – Breakdown or Breakout?📍 We’ve arrived.
NASDAQ:NVDA has reached the key reversal zone where sellers previously took control. This is the third touch, and markets rarely leave these zones without a fight.
🔍 Technical Setup:
Price has retraced to prior breakdown level.
MACD is trying to cross bullish — momentum building.
Sellers should defend here… but the recent AI narrative and Gulf chip deals could fuel a breakout.
If sellers fail to show up, we may blow straight through this level toward new highs.

$NVDA In, $AAPL Out – AI Supercycle May Be Just Starting🚨 JUST IN: NASDAQ:NVDA surpasses NASDAQ:AAPL to become the second-largest company in the world, right behind $MSFT.
And if that wasn’t enough:
Trump calls Nvidia’s Huang "my friend"
Hints that Nvidia replaces Apple as his go-to tech ally
Meanwhile, Bloomberg reports Nvidia could ship 500,000 AI chips yearly to the UAE until 2027 under revised export rules.
Jensen Huang also confirmed Saudi Arabia is building massive GPU factories, describing them as “energy in, intelligence out” systems.
⚠️ The market may be waking up to the reality that AI is not as cyclical as many feared.
🔍 On the chart:
NASDAQ:NVDA broke to a higher high (HH)
NASDAQ:AMD testing lower high (LH) breakdown resistance
Could AMD follow Nvidia’s breakout? The setup is there.

NVDA New 2025 All-Time High Explained, 153 Next Followed by 194The NVDA stock just hit its highest price since March. Today it moved above resistance while producing a perfect ascending triangle pattern.
This is a major development because the resistance level that was broken today, 114, rejected growth a total of 4 times. NVDA moving above this level confirms the continuation of the bullish move coming from a technical analysis perspective.
Just to be unbiased, I have to mention that there is still one final level to conquer before the chart truly points to a new All-Time High.
The resistance is not a single price but a range, the resistance zone. This range sits between 114 and 123. Once NVDA closes decisively above 123, say a full daily or weekly candle with really high volume, we have a test of the All-Time High as resistance confirmed.
Depending on how the market reacts once the ATH is challenged we can determine what will happen next.
For example, if the ATH produces a very strong rejection with really high bearish volume, we know that a major correction will follow and even a lower low becomes possible. But, on the other hand, if challenging the ATH results in a mild market reaction, a normal drop/retrace then immediately we know that additional growth will happen after a higher low.
The truth is, Nvidia will move up, fight a little bit at the ATH and then continue growing. Just as we predicted the bottom we can predict what will happen next based on the chart. The chart is saying up long-term and this means a new All-Time High in 2025. Rest easy.
Thank you for reading.
Your support is appreciated.
Namaste.

"God of AI" How does Nvidia make money?"God of AI" How does Nvidia make money?
NVIDIA is really at the center of the AI and data center boom right now. With these industries growing so quickly, it looks like NVIDIA’s sales and profits will keep going up for quite some time. Some experts even predict that by 2029, the company could be making over $300 billion just from its data center business.
What’s also impressive is how NVIDIA keeps rolling out new and better AI chips, staying ahead of the competition when it comes to technology. And they’re not just sticking to AI-they’re also moving into exciting areas like self-driving cars, the cloud, robotics, and even the metaverse. This kind of diversification gives them even mo NASDAQ:NVDA re ways to grow.
As for the stock price, most analysts seem to agree that there’s still a lot of potential for it to climb higher, even though there are some risks to watch out for-like increased competition, supply chain hiccups, or short-term market swings.
NASDAQ:NVDA
Intel Corporation | INTCIntel reported second quarter earnings on Thursday, showing a return to profitability after two straight quarters of losses and issuing a stronger-than-expected forecast. the stock rose 7% in extended trading.
Here’s how Intel did versus Refinitiv consensus expectations for the quarter ended July 1:
Earnings per share: 13 cents, adjusted, versus a loss of 3 cents expected by Refinitiv.
Revenue: $12.9 billion, versus $12.13 billion expected by Refinitiv.
For the third quarter, Intel expects earnings of 20 cents per share, adjusted, on revenue of $13.4 billion at the midpoint, versus analyst expectations of 16 cents per share on $13.23 billion in sales.
Intel posted net income of $1.5 billion, or 35 cents per share, versus a net loss of $454 million, or a loss of 11 cents per share, in the same quarter last year.
Revenue fell 15% to $12.9 billion from $15.3 billion a year ago, marking the sixth consecutive quarter of declining sales.
Intel CEO Pat Gelsinger said on a call with analysts the company still sees “persistent weakness” in all segments of its business through year-end, and that server chip sales won’t recover until the fourth quarter. He also said that cloud companies were focusing more on securing graphics processors for artificial intelligence instead of Intel’s central processors.
David Zinsner, Intel’s finance chief, said in a statement that part of the reason the report was stronger than expected was because of the progress the company has made toward slashing $3 billion in costs this year. Earlier this year, Intel slashed its dividend and announced plans to save $10 billion per year by 2025, including through layoffs.
“We have now exited nine lines of business since Gelsinger rejoined the company, with a combined annual savings of more than $1.7 billion,” said Zinsner.
Revenue in Intel’s Client Computing group, which includes the company’s laptop and desktop processor shipments, fell 12% to $6.8 billion. The overall PC market has been slumping for over a year. Intel’s server chip division, which is reported as Data Center and AI, saw sales decline 15% to $4 billion plus Intel’s Network and Edge division, which sells networking products for telecommunications, recorded a 38% decline in revenue to $1.4 billion.moreover Mobileye, a publicly traded Intel subsidiary focusing on self-driving cars, saw sales slip 1% on an annual basis to $454 million and Intel Foundry Services, the business that makes chips for other companies, reported $232 million in revenue.
Intel’s gross margin was nearly 40% on an adjusted basis, topping the company’s previous forecast of 37.5%. Investors want to see gross margins expand even as the company invests heavily in manufacturing capability.
In the first quarter, the company posted its largest loss ever as the PC and server markets slumped and demand declined for its central processors. Intel’s results on Thursday beat the forecast that management gave for the second quarter at the time.
Intel management has said the turnaround will take time and that the company is aiming to match TSMC’s chip-manufacturing prowess by 2026, which would enable it to bid to make the most advanced mobile processors for other companies, a strategy the company calls “five nodes in four years.” Intel said on Thursday that it remained on track to hit those goals.
Nvidia has had an amazing run, but any emerging technology, such as AI, which is bottlenecked by a single company will have issues in growth. Consulting firm McKinsey has pegged the AI market to be worth $1 trillion by 2030, but also that it was in an experimental and in early phases of commercial deployment.
While Nvidia will likely retain its leadership in GPU hardware as applied to AI for the foreseeable future, it is likely that other hardware solutions for AI systems will also be successful as AI matures. While technologist may quibble on specifics, all major AI hardware today are based on GPU architectures, and as such I will use the terms and concepts of AI hardware and GPU architecture somewhat interchangeably.
One likely candidate for AI related growth may be AMD (AMD), which has had GPU products since acquiring ATI in 2006.However, unlike Nvidia, which had a clear vision for of general-purpose GPU products (GPGPU), historically, AMD had largely kept its focus on the traditional gaming applications. AMD has developed an AI architecture called XDNA, and an AI accelerator called Alveo and announced its MI300, an integrated chip with GPU acceleration for high-performance computing and machine learning. How AMD can and may evolve in the AI may be subject of a different article.
Another contender for success in the AI applications using GPU is Intel, who is the focus of this article. Intel has maintained a consistent, if low key focus on GPU hardware focused on AI applications over the last decade. Intel’s integrated HD Graphics is built into most modern processor ICs; however, these are insufficient compared to dedicated GPUs for high-end inferencing or machine learning tasks.
It has 2 primary GPU architectures in production release:
In 2019 Intel Corporation acquired Habana Labs, an Israel-based developer of programmable deep learning accelerators for the data center for approximately $2 billion. Habana Labs’ Gaudi AI product line from its inception focused on AI deep learning processor technologies, rather than as GPU that has been extended to AI applications. As a result, Gaudi microarchitecture was designed from the start for the acceleration of training and inferencing. In 2022 Intel announced Gaudi2 and Greco processors for AI deep learning applications, implemented in 7-nanometer (TSMC) technology and manufactured on Habana’s high-efficiency architecture. Habana Labs benchmarked Gaudi2’s training throughput performance for the ResNet-50 computer vision model and the BERT natural language processing model delivering twice the training throughput over the Nvidia high end A100-80GB GPU. So, Gaudi appears to give Intel a competitive chip for AI applications.
Concurrent with the Habana Labs’ Gaudi development, Intel has internally developed the Xe GPU family, as dedicated graphics card to address high-end inferencing or machine learning tasks as well as more traditional high-end gaming. Iris® Xe GPU family consists of a series of microarchitectures, ranging from integrated/low power (Xe-LP) to enthusiast/high performance gaming (Xe-HPG), data center/AI (Xe-HP) and high-performance computing (Xe-HPC). The architecture has been commercialized in Intel® Data Center GPU Flex Series (formerly codenamed Arctic Sound) and Intel® Arc GPU cards. There is some question on Xe GPU future and evolution. Intel has shown less commitment to the traditional GPU space compared to Gaudi. Nonetheless, it does demonstrate Intel ability to design and field complex GPU products as its business requires.
Intel has many other AI projects underway. The Sapphire Rapids chips implements AI specific acceleration blocks including technology called AMX (Advanced Matrix Extensions), which provides acceleration inside the CPU for efficient matrix multiplications used in on-chip inferencing and machine learning processing by speeding up data movement and compression. Intel has supporting technologies such as Optane, which while cancelled as a production line, is available for their needs of a high-performance non-volatile memory, one of the intrinsic components in any AI product.
Based on the above, Intel appears to have competitive hardware solutions, however if we look at Nvidia success in AI, it is a result of a much a software and systems focus as it is the GPGPU hardware itself. Can Intel compete on that front. Ignoring for the moment that Intel has a huge software engineer (approx. 15,000) resource, it also has- access to one of the leading success stories in perhaps the most competitive AI application – self driving cars.
Mobileye, who was acquired by Intel in 2017, has been an early adopter and leader, with over 20 years of experience in automotive automated driving and vision systems. As such, Mobileye has a deep resource of AI domain information that should be relevant to many applications. Mobileye has announced that it is working closely with Habana, as related divisions within Intel. While Intel is in the process of re-spinning out Mobileye as public company, Mobileye Global Inc. (MBLY), at present Intel still owns over 95% of shares, keeping it effectively an Intel division.
In looking at Intel, we have a company with the history, resources, and technology to compete with Nvidia and infrastructure. They have made significant investment and commitment to the emerging AI market, in times when they have exited other profitable businesses. It should also be understood that AI related product are a small percentage of overall Intel revenues (INTC revenue are more than twice NVDA, even if NVDA has 6x its market cap), and continues to keep its primary business focus on its processor and foundry business.
Hopefully for shareholders, Intel continues to push their AI technology and business efforts. Their current position is that this is strategic, but Intel is in a very fluid time and priorities may change based on business, finances, and of course the general interest and enthusiasm for AI. It is always worth noting that AI as a technical concept is mature, and appears to be cyclical, with interest in the technical community rising and falling in hype and interest once every decade or so. I remember working on AI applications, at the time labeled as expert systems in the 1980s. If we are currently at a high hype point, this may be temporary, based on near term success and disappointment in what AI does achieve. Of course, as always, “this time is different” and the building blocks of effective AI systems currently exist, where for previous iterations, it was more speculative.

NVDA Weekly Options Trade Plan 2025-05-07NVDA Weekly Analysis Summary (2025-05-07)
Model Summaries
Grok/xAI Report
Technicals: Price $117.06 above all key EMAs; bullish MACD on 5-min and daily; RSI overbought short-term (75) but neutral daily (59); trading near upper Bollinger Bands. Sentiment: VIX elevated at 24.76; mixed news (AI rally vs. supply delays); max pain at $111 suggests some bearish undertone. Direction: Moderately bullish with caution for pullback. Trade: Buy naked $113 put (premium $0.59) anticipating pullback, stop if $119 breach, target 25–50% gain, 65% confidence.
Claude/Anthropic Report
Technicals: Strong intraday uptrend; bullish MACD and RSI neutral daily; immediate resistance at $117.68. Sentiment: Sector tailwinds, positive news, but VIX elevated and max pain at $111. Direction: Moderately bullish. Trade: Buy $121 call at $0.75, profit target 100% ($1.50), stop-loss 40% ($0.45), 65% confidence.
Llama/Meta Report
Technicals: Bullish MACD, overbought short-term RSI, mixed reversal risk. Sentiment: Mixed news; VIX rising; max pain theory. Direction: Moderately bullish but immediate entry risky—overbought, mixed signals. Trade: No trade recommended at open (confidence <60%).
DeepSeek Report
Technicals: Bullish breakout, expanding bands, RSI overbought M5 but room on daily. Sentiment: Positive AI policy news; VIX manageable; max pain unlikely to derail strong technicals. Direction: Strongly bullish (70% confidence). Trade: Buy $122 call at $0.56, target $1.12, stop if $115.86 break, size 3–5% of capital.
Gemini/Google Report
Technicals: Strong uptrend but very overbought short-term. Sentiment: Mixed news with supply concerns; VIX rising; max pain $111 adds caution. Direction: Neutral/unclear for immediate trade (confidence <60%). Trade: No trade recommended at market open. Areas of Agreement and Disagreement
Agreements
All models see a strong intraday and daily uptrend with price above key EMAs and bullish MACD. Short-term RSI is overbought, suggesting potential for pullback or consolidation. VIX is elevated (~24.8), signaling caution. Max pain at $111 introduces a bearish tether toward expiration.
Disagreements
Trade selection: Grok favors a bearish put; Claude, DeepSeek favor bullish calls; Llama and Gemini hold off. Confidence: DeepSeek is most bullish (70%), Grok and Claude are moderately bullish (65%), Llama and Gemini see too many conflicting signals for immediate action. Strike selection varies widely: $113 put, $121 call, $122 call, or no trade. Conclusion
Overall Market Direction Consensus: Moderately bullish for the week, with elevated short-term risk of pullback.
Recommended Trade
Strategy: Single-leg naked call Instrument: NVDA weekly options (expiry 2025-05-09) Strike: $122.00 Call Premium: ~ $0.56 Entry Timing: At market open Profit Target: $1.12 (100% gain) Stop-Loss: $0.34 (40% loss) Confidence: 70%
Key Risks and Considerations
M5 RSI overbought (75) risks a short-term pullback. Elevated/rising VIX may induce whipsaws. Max pain suggests potential downward drift into expiration. Monitor any fresh supply-chain or sector news at open.
TRADE_DETAILS (JSON Format)
{ "instrument": "NVDA", "direction": "call", "strike": 122.0, "expiry": "2025-05-09", "confidence": 0.70, "profit_target": 1.12, "stop_loss": 0.34, "size": 1, "entry_price": 0.56, "entry_timing": "open", "signal_publish_time": "2025-05-07 20:16:47 UTC-04:00" }
Disclaimer: This newsletter is not trading or investment advice but for general informational purposes only. This newsletter represents my personal opinions based on proprietary research which I am sharing publicly as my personal blog. Futures, stocks, and options trading of any kind involves a lot of risk. No guarantee of any profit whatsoever is made. In fact, you may lose everything you have. So be very careful. I guarantee no profit whatsoever, You assume the entire cost and risk of any trading or investing activities you choose to undertake. You are solely responsible for making your own investment decisions. Owners/authors of this newsletter, its representatives, its principals, its moderators, and its members, are NOT registered as securities broker-dealers or investment advisors either with the U.S. Securities and Exchange Commission, CFTC, or with any other securities/regulatory authority. Consult with a registered investment advisor, broker-dealer, and/or financial advisor. By reading and using this newsletter or any of my publications, you are agreeing to these terms. Any screenshots used here are courtesy of TradingView. I am just an end user with no affiliations with them. Information and quotes shared in this blog can be 100% wrong. Markets are risky and can go to 0 at any time. Furthermore, you will not share or copy any content in this blog as it is the authors' IP. By reading this blog, you accept these terms of conditions and acknowledge I am sharing this blog as my personal trading journal, nothing more.

NVIDIA Corporation: Bullish ConsolidationThe NVDA stock is facing resistance at the 0.5 Fib. extension level. This resistance was met after a higher low and above 0.618 Fib. While this is a confirmed resistance zone, market conditions are bullish.
The RSI is now above 50. It is at its highest on a rise since late January earlier this year.
Local resistance on the RSI has been broken and this oscillator is trading straight up. This is a positive and strong signal. Here is the chart:
The yellow horizontal line is the local resistance which has been broken. On a drop, this same line would now work as support. A "magic" line I should say. :D
It is magical because it helps us predict the future with a high level of accuracy and certainty; so far so good.
These dynamics: The higher low, the small stop at resistance, the bullish RSI and overall bullish market conditions are all part of a bullish consolidation period.
Let me break it down for you; the market will continue to consolidate for a while, for as long as it needs, before moving higher to hit a new high. The conditions revealed by this chart setup is that the low that was hit 7-April remains the bottom. The market can shake, NVDA can go down, it can go up but this low will never be challenged, you can set your stop-loss below it. Any short-term movements against you is just noise. Wait patiently and eventually it will grow.
If you have any questions leave a comment it will be my pleasure to answer.
Thank you for reading again.
See you tomorrow, or the next day, or yesterday-more again.
Make sure to follow. My main focus is Cryptocurrency but I also do the SPX, NVDA and TSLA. (And sometimes Gold which is bearish now.)
Namaste.

Nvidia Shows Signs of Recovery -but the Bearish Channel Remains Over the last five trading sessions, Nvidia’s stock has gained more than 9%, and short-term bullish momentum remains intact as the tech giant appears to benefit from expectations of a potential easing in trade war tariffs. Notably, the company’s CEO, Jensen Huang, recently stated that the Chinese market for artificial intelligence chips could reach $50 billion within the next two years — highlighting the importance of maintaining access to this market. This reinforces the view that a diplomatic resolution to the trade conflict is crucial for Nvidia to sustain a steady recovery.
It’s also important to note that Nvidia is scheduled to release its next earnings report on May 28, with market expectations pointing to earnings of approximately $0.88 per share. Should results meet or exceed projections, this could reignite a bullish sentiment that has been largely absent from the stock over the past several months.
Bearish channel still in play:
Since early January of this year, Nvidia’s stock has formed a steady downward channel, pushing the price even below the $100 mark at times. While a consistent upward correction is underway, it remains insufficient to confirm a definitive breakout, meaning this bearish channel is still the dominant technical structure in the short term.
ADX:
The ADX indicator has been fluctuating below the neutral 20 level, signaling a decline in volatility over the average of the last 14 sessions. As long as this continues, the current phase of price neutrality may persist.
RSI:
The RSI is showing a similar picture, hovering near the 50 level — indicating a balance between buying and selling momentum in recent sessions, and reinforcing the lack of a clear short-term trend.
Key levels to watch:
$113: Current resistance level, aligned with the upper bound of the bearish channel and the 50-period simple moving average. Continued price action in this area may extend the current phase of consolidation.
$125: A critical resistance point tied to the 200-period simple moving average. A breakout toward this level could signal the end of the bearish channel.
$100: A key psychological support level in the short term. A move below this threshold could reinforce the bearish bias and trigger a deeper downtrend within the current price structure.
Written by Julian Pineda, CFA – Market Analyst

NVIDIA Massive bullish break-out after 4 months of selling.NVIDIA Corporation (NVDA) made a critical bullish break-out yesterday (in the aftermath of Meta's and Microsoft AI capex numbers) as it didn't just break above the 1D MA50 (blue trend-line) that has been intact as a Resistance since February 27 but also above the top of the Channel Down that has been the dominant pattern throughout this correction since the January 07 All Time High (ATH).
The 1D RSI is on an Inverse Head and Shoulders (IH&S) pattern, which is always bullish and if NVDA closes a 1D candle above the 1D MA50 next, then our short-term Target will be 143.50, which is just below Resistance 1 and the 2.0 Fibonacci extension.
-------------------------------------------------------------------------------
** Please LIKE 👍, FOLLOW ✅, SHARE 🙌 and COMMENT ✍ if you enjoy this idea! Also share your ideas and charts in the comments section below! This is best way to keep it relevant, support us, keep the content here free and allow the idea to reach as many people as possible. **
-------------------------------------------------------------------------------
💸💸💸💸💸💸
👇 👇 👇 👇 👇 👇

Nasdaq-100 Goes Back to 'PRE-PAIN' 20 000 Level. Series IIApril has gone..
Wow.. Duh..!? ..really? ... or still not!?
Briefly a month ago or so, we have examined at our wonderful @PandorraResearch Team what is 'Revenge Trading', watch our recent 'Educational' idea right here (if you missed one), to learn what sort of lessons we should know about it.
Indeed, it was a really bad story, to purchase in late March 2025 most-hyped so-known Mag Seven stock that came flagships of the recent stock market collapse.
First of all, watch how it's been below (late March 2025) 👇👇
What's happened next just in a week or two since our publications has been made?
⚒ Russell 2000 Index TVC:RUT 95% stocks were: DOWN
⚒ S&P500 Index SP:SPX 96% stocks were: DOWN
⚒ Nasdaq-100 NASDAQ:NDX as well as Dow Jones Industrial Averages DJIA indices: 97% stocks were DOWN
⚒ Magnificent Seven: ALL STOCKS WERE DOWN
Since Nasdaq-100 went back to pre-pain 20'000 Level, lets repeat some lessons.
Revenge trading is DANGEROUS AND HARMFUL pracrice where traders, after suffering a loss, attempt to immediately recoup their losses by making impulsive, emotionally-driven trades. This behavior is widely recognized as one of the major reasons traders lose significant amounts of money and often blow up their accounts.
Why Revenge Trading Is Bad
1. Emotional Decision-Making Replaces Strategy
When traders engage in revenge trading, they abandon their carefully crafted trading strategies and risk management rules. Instead, trades are made based on anger, frustration, or the desire to "get back" at the market. This emotional state clouds judgment, leading to irrational decisions such as increasing position sizes recklessly, disregarding stop-loss orders, or chasing trades without proper analysis. As a result, the likelihood of making successful trades plummets.
2. Escalating Losses and Account Blowups
The urge to recover losses quickly often leads traders to double down or over-leverage their positions, exposing a large portion of their capital to additional risk. Statistically, 80% of revenge trading ends disastrously, with only a small fraction experiencing temporary success before ultimately facing larger losses. This cycle of chasing losses can rapidly erode trading capital, making recovery increasingly difficult.
3. Psychological Burnout and Stress
Revenge trading is mentally and emotionally exhausting. The constant cycle of loss and frantic attempts to recover can lead to stress, depression, and burnout. This further impairs decision-making, creating a vicious cycle of poor performance and deteriorating mental health.
4. Long-Term Damage to Trading Habits
Repeatedly succumbing to revenge trading ingrains bad habits, making it difficult for traders to maintain discipline and consistency in the long run. This lack of consistency undermines the potential for sustainable profitability and can end trading careers prematurely.
Recent Real-World Examples
Recent years have seen numerous cautionary tales illustrating the dangers of revenge trading (all links are from r/wallstreetbets subreddit for learing/ educational purposes only):
$40,000 Lost on NVDA Options (2024). A trader repeatedly doubled down on Nvidia (NVDA) put options during its price rally in mid-2024. Despite initial small wins, the trader, driven by the urge to recover losses, continued to increase his position size, ultimately losing over $40,000.
$26,000 Lost in 20 Minutes on SPX. A Reddit user reported losing $26,000 in about 20 minutes trading the S&P 500 index (SPX) after prices dropped sharply. The loss was the result of impulsive trades made in an attempt to quickly recover from earlier setbacks.
From $27,000 to $0 in Three Days. Another trader turned $500 into $27,000 in just a few days, only to lose it all within 48 hours after a market reversal. Instead of taking profits or stepping back, the trader kept chasing losses with increasingly risky trades, ending up with nothing.
$100,000 Loss on a Yen Carry Trade. A trader, influenced by news of geopolitical tensions, made a large leveraged bet on the yen. After an initial loss, he refused to cut his losses and doubled down, ultimately losing $100,000 instead of accepting a smaller $30,000 hit.
More juicy stories are to be collected...
These stories are not isolated incidents. They are echoed across trading forums and social media, serving as stark warnings of how quickly revenge trading can destroy even substantial gains.
Conclusion
Revenge trading is DANGEROUS AND HARMFUL because it replaces rational, strategic decision-making with emotional reactions, leading to escalating financial losses, psychological distress, and long-term damage to trading discipline. The real-world examples from the past year underscore that no trader-regardless of experience-is immune to its risks. The best defense is to recognize the urge, step away, and return only with a clear, objective mindset and a disciplined strategy.
--
Best wishes,
@PandorraResearch Team 😎

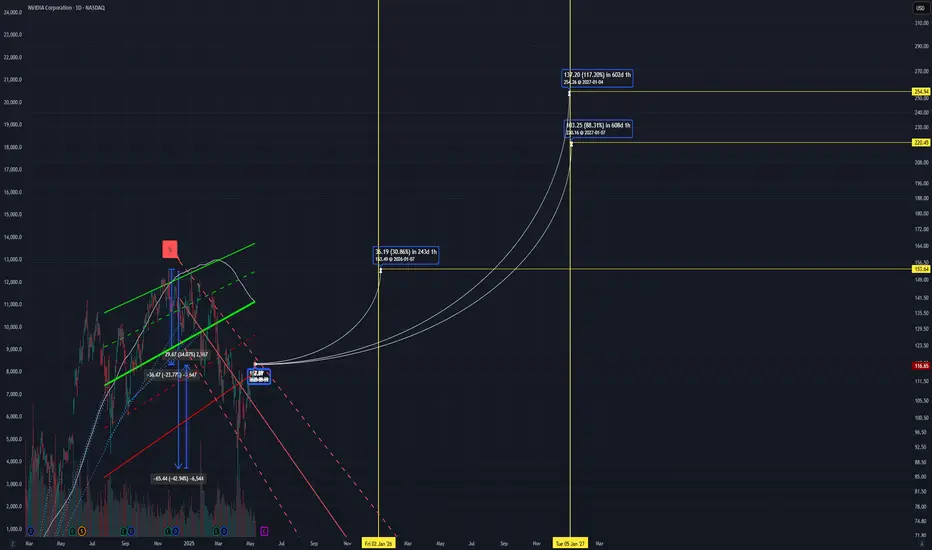
NVIDIA: Don't turn your back on the A.I. darling yet.NVIDIA has turned neutral on its 1D technical outlook (RSI = 48.902, MACD = -2.040, ADX = 28.815) as it has recovered a portion of the 2 month correction. April's low was exactly on the 1W MA100 just like the Low of the 2024 consolidation phase has been near the 1W MA50. The pattern is recurring and the rallies naturally get weaker each time as we approach the end of the Cycle this year. The 1st rally was +358%, the 2nd +257% so the 3rd one now is expected to be +157%. That gives a $225 target. The next Top will most likely start a new correction (Bear Cycle) for a 3rd Bottom on the 1W MA200.
## If you like our free content follow our profile to get more daily ideas. ##
## Comments and likes are greatly appreciated. ##

Bad News from NVDA and ASML Put Pressure on AI StocksTwo pieces of bad news hit the chip sector in a single day.
First, the U.S. announced new restrictions on Nvidia, blocking the sale of its H20 chip to China. H20 was the only AI chip Nvidia could legally sell to China under existing regulations. The company stated the new restrictions could cost up to $5.5 billion.
The second blow came from ASML’s earnings report. ASML is the sole producer of EUV machines, which are critical for manufacturing advanced chips, including those used in AI. ASML's revenue miss, combined with the Nvidia news, weighed heavily on technology stocks. However, there is a silver lining: the revenue miss was due to weaker DUV machine sales, which are used for more basic chips. EUV sales actually beat market expectations by 33.54%, indicating that investment in AI infrastructure remains strong.
Nvidia shares are down more than 6% in premarket trading. This downward pressure may continue after the market opens. If the price drops below 100, it could present a buying opportunity for medium- to long-term investors. AI investment continues globally, and countries outside the U.S. are likely to accelerate their efforts to catch up. Despite the recent negative sentiment, there is no major change in the long-term outlook for the sector.

$NVDA one more leg lower $58-76 targetNASDAQ:NVDA bounced off the lows at $86 but is now finding resistance, I think it's likely that we turn lower next week and start falling towards the targets below.
I think it's very likely that we make it down to the lower supports at $63-58 before we see a sustainable bounce form.
Let's see how it plays out over the coming weeks.
