Nvidia (NVDA) Share Price Surges Above $170Nvidia (NVDA) Share Price Surges Above $170
Yesterday, Nvidia’s (NVDA) share price rose by more than 4%, with the following developments:
→ It surpassed the psychological level of $170 per share;
→ Reached another all-time high;
→ Gained more than 9% since the beginning of the month.
The bullish sentiment is driven by Nvidia CEO Jensen Huang’s visit to China shortly after meeting with US President Trump. At the same time:
→ US Secretary of Commerce Howard Lutnick stated that the planned resumption of sales of Nvidia H20 AI chips in China is part of the US negotiations on rare earth metals.
→ The head of Nvidia stated that he was assured licences would be granted very quickly, and that a large number of orders for H20 chip deliveries had already been received from Chinese companies.
Market participants are viewing the situation with strong optimism, and analysts are raising their valuations for NVDA shares:
→ Morningstar analysts raised their fair value estimate for Nvidia shares from $140 to $170.
→ Oppenheimer analysts increased their target price from $170 to $200.
Technical Analysis of the NVDA Chart
The price trajectory of NVDA shares fully reflects the exceptionally strong demand:
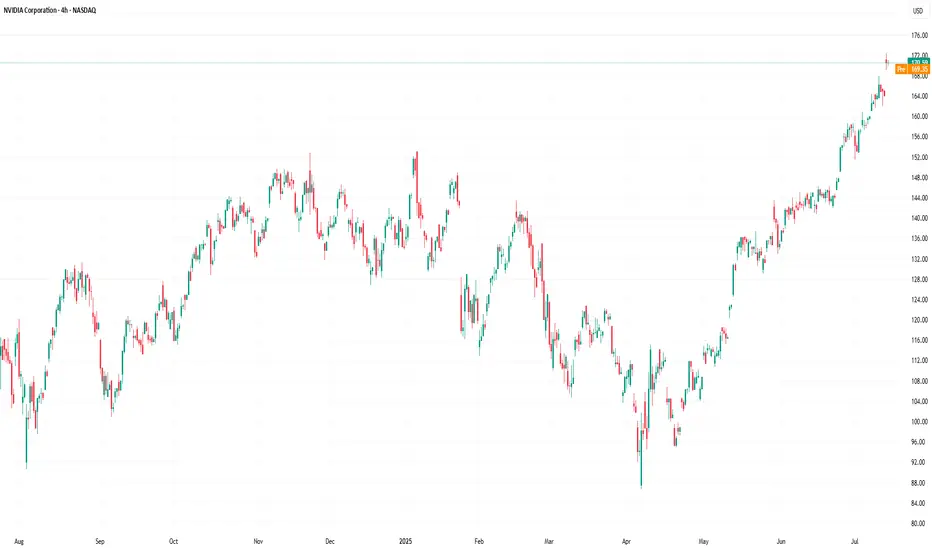
→ The price is moving within an ascending channel with a steep growth angle;
→ Since early May, the RSI indicator on the 4-hour chart has not fallen below the 50 level;
→ Yesterday’s trading session opened with a large bullish gap.
The chart also shows the formation of a stable bullish market structure (shown with a purple broken line), expressed through a sequence of higher highs and higher lows.
Given the above, it is difficult to imagine what might cause a sharp shift from positive to negative sentiment. If a correction begins (for example, with a test of the $160 level), traders should watch for signs of its completion — this could present an opportunity to join the emerging rally.
This article represents the opinion of the Companies operating under the FXOpen brand only. It is not to be construed as an offer, solicitation, or recommendation with respect to products and services provided by the Companies operating under the FXOpen brand, nor is it to be considered financial advice.
Nvidiatrend
Nvidia Stock Price Rises Over 4% Following Earnings ReportNvidia (NVDA) Stock Price Rises Over 4% Following Earnings Report
Yesterday, after the main trading session, Nvidia released its quarterly earnings report, which exceeded analysts' expectations:
→ Earnings per share: actual = $0.81, forecast = $0.73
→ Revenue: actual = $44 billion, forecast = $43.3 billion
Additionally, according to media reports, Nvidia issued a strong forecast for the next period, although CEO Jensen Huang noted difficulties in accessing the Chinese market, which he estimates to be worth $50 billion.
Nevertheless, market participants reacted positively. According to Google, in after-hours trading the NVDA stock price rose by more than 4%, surpassing the $140 level.
It is reasonable to assume that this initial positive reaction could continue during today’s main trading session.
Technical Analysis of NVDA Chart
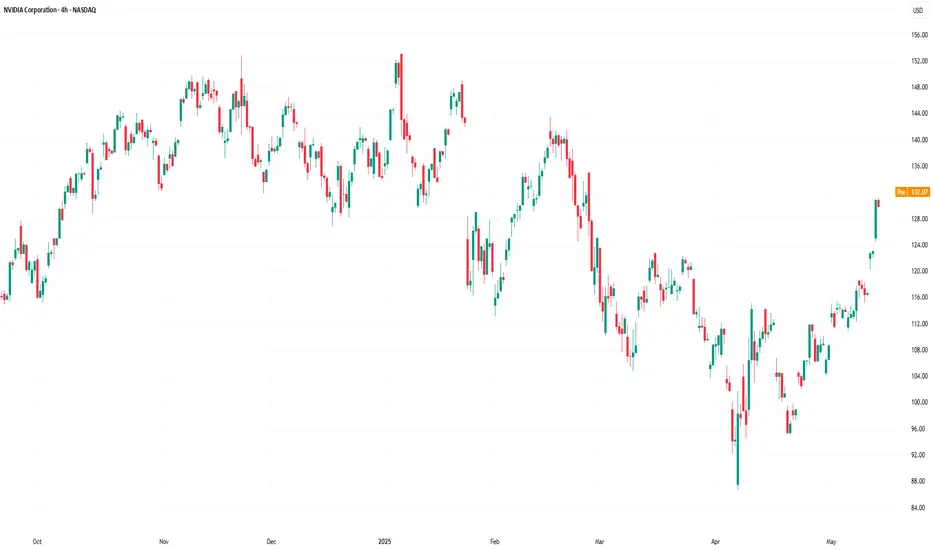
As we mentioned earlier this week, NVDA stock in 2025 has formed a broad descending channel (shown in red), and just before the earnings release, the price was consolidating near the upper boundary of this channel.
We also suggested a scenario in which the bulls might attempt to break through the upper boundary of the channel. Given the positive earnings report and the stock market rally following the Federal Court’s decision declaring Trump tariffs invalid, the likelihood of this scenario increases.
This, in turn, means that:
→ the upper boundary of the channel, once broken, may act as support;
→ we may once again see the key psychological resistance level of $150 come into play — a level we have highlighted multiple times before.
This article represents the opinion of the Companies operating under the FXOpen brand only. It is not to be construed as an offer, solicitation, or recommendation with respect to products and services provided by the Companies operating under the FXOpen brand, nor is it to be considered financial advice.

Nvidia (NVDA) Share Price Jumps Over 5%Nvidia (NVDA) Share Price Jumps Over 5%
Nvidia (NVDA) shares surged to the $130 mark yesterday – a level not seen since late February 2025. This strong rise, marked by a wide bullish candlestick, helped Nvidia reclaim its status as a company valued at over $3 trillion.
Why Nvidia (NVDA) Shares Are Rising
The bullish sentiment has been driven by several factors, including:
→ Price increases on products: Nvidia has raised prices on its graphics cards and data centre chips. The GeForce RTX 5090 has risen by more than 10%, while the RTX 50 series is up by 5–10%.
→ News of a major contract: The company will supply chips to an AI start-up backed by Saudi Arabia. In addition, media reports suggest that the US government is considering a deal allowing the UAE to purchase up to 500,000 Nvidia chips annually until 2027.
All of this could positively impact Nvidia’s revenue, encouraging investors to buy NVDA shares.
Technical Analysis of Nvidia (NVDA) Stock Chart
Yesterday’s sharp rally suggests a breakout from the descending channel (marked in red), which had remained in place since late last year.
The breakout occurred near the $123 level, which had previously acted as resistance. It is therefore possible that if there is a pullback in the NVDA stock price, this level could act as support (“breakout retest” pattern), confirming the breakdown of the descending channel and strengthening the outlook for further growth.
This article represents the opinion of the Companies operating under the FXOpen brand only. It is not to be construed as an offer, solicitation, or recommendation with respect to products and services provided by the Companies operating under the FXOpen brand, nor is it to be considered financial advice.
NVDA LESSON Now We Hunt For A DISCOUNT Nvidia⚪️ NVDA Another example of traders getting
trapped at the high.
⚪️ Also a prime example of traders
entering pre 150 break.
We don't need level 2 data to know
how HUMANS WILL ACT.
HUMAN BEHAVIOUR IS PREDICTABLE.
✅️That is an edge we can use too................
🟢 Every trend starts with a breakout and yes if you take everyone you will never miss the NEXT BIG MOVE BUT.....
🟢 By doing so you will inevitabley give up a high win rate, and the fact is that most humans would rather be RIGHT than make MONEY.
⭐️THAT IS JUST SIMPLE HUMAN BEHAVIOUR.⭐️ IT'S STRANGE BUT TRUE⭐️
🌎Most traders would rather sacrifice more profit for a HIGHER WIN RATE🌍
Some of the most PROFITABLE TRADERS & INVESTORS in the WORLD have a WIN RATE BELOW 50%.❕️
❗️LET THAT SINK IT...❗️
⚠️ 🟢SeekingPips🟢 SAYS SAVE THIS GOLD LESSON NOW YOU CAN THANK ME LATER⚠️

NVIDIA Possible Outlook Next week 1-13-25This stock has still upside potential. As for right now this was a much needed retest to continue to the upside. If we see a closure below the last weekly zone. We could expect a further drop down to show us support but not currently looking for that just yet. Just keeping it mind.

$NVDA to Continue Slow RiseNASDAQ:NVDA - Post split NASDAQ:NVDA is continuing to adhere to the rising pressure.
More than anything with their continued market share success and the hotness of A.I., NASDAQ:NVDA

NVIDIA $NVDA | NVIDIA WEDGE BREAKOUT SOON - Sep. 20th, 2024NVIDIA NASDAQ:NVDA | NVIDIA BREAKOUT SOON - Sep. 20th, 2024
BUY/LONG ZONE (GREEN): $118.25 - $130.00
DO NOT TRADE/DNT ZONE (WHITE): $114.75 - $118.25
SELL/SHORT ZONE (RED): $103.75 - $114.75 (can be extended to $92.00)
Weekly: Bullish
Daily: Bullish
4H: Bullish
NASDAQ:NVDA looks choppy and very ranging, but is consolidating towards a zone that has been tested roughly seven times. Bulls should be looking for price to pinch and breakout above $118.25 towards the $130.00 price area, or bears can look for price to pinch and breakdown below the $114.75 level towards the $103.75 area. Bears can also look for price to drop to the $92.00 area that had started the previous bull rally. Despite my three main timeframes indicating a bullish trend, I would be happy with a fast move in either direction.
This is what I would personally look at before entering trades, everything is subject to change on a daily basis and as I analyze different timeframes and ideas.
ENTERTAINMENT PURPOSES ONLY, NOT FINANCIAL ADVICE!
trendanalysis, trendtrading, priceaction, priceactiontrading, technicalindicators, supportandresistance, rangebreakout, rangebreakdown, rangetrading, chartpatterntrading, chartpatterns, spy, sp500, s&p, fed, federalreserve, fedrate, fedratecut, interestrate, jeromepowell, fedchair, 50bps, volatile, volatility, NASDAQ:NVDA , AMEX:SPY , nvidia, nvidiapricetarget, nvdatrend, nvidiatrend, nvdasetup, nvidialongs, nvidiashorts, NYSE:SNOW , nvdawedge, wedgepattern,

NVIDIA: Weekly To 30 Minute: Correcting where are we going up? Good morning Traders
Here is my video analysis on NVIDIA at the moment. Have a review and let me know what you think.
The main areas of concern are: 108 and 110 if we break those levels I dont see why the market cant go to 114 range.
Any questions, comments, ideas, want me to share more ideas on any topic let me know.
The trend is your friend and lastly we dont predict the market we follow it.
MB Trader

NVIDIA $NVDA - Feb. 22nd, 2024NVIDIA NASDAQ:NVDA - Feb. 22nd, 2024
BUY/LONG ZONE (GREEN): $661 - $810
DO NOT TRADE/DNT ZONE (WHITE): $609 - 661
SELL/SHORT ZONE (RED): Not Shown
Weekly: Bullish
Daily: Bullish
4H: Bullish
Not much to say, earnings and momentum speak for themselves, just thought I'd quickly throw up what I have drawn as support areas for bulls and a profit target. The target shown is roughly a +20% gain from the start of the bullish zone where my entry is it. No short zone is drawn as I do not believe something so strongly bullish should be considered for a short at this time.
This is what I would personally look at before entering trades, everything is subject to change on a daily basis and as I analyze different timeframes and ideas.
ENTERTAINMENT PURPOSES ONLY, NOT FINANCIAL ADVICE!
