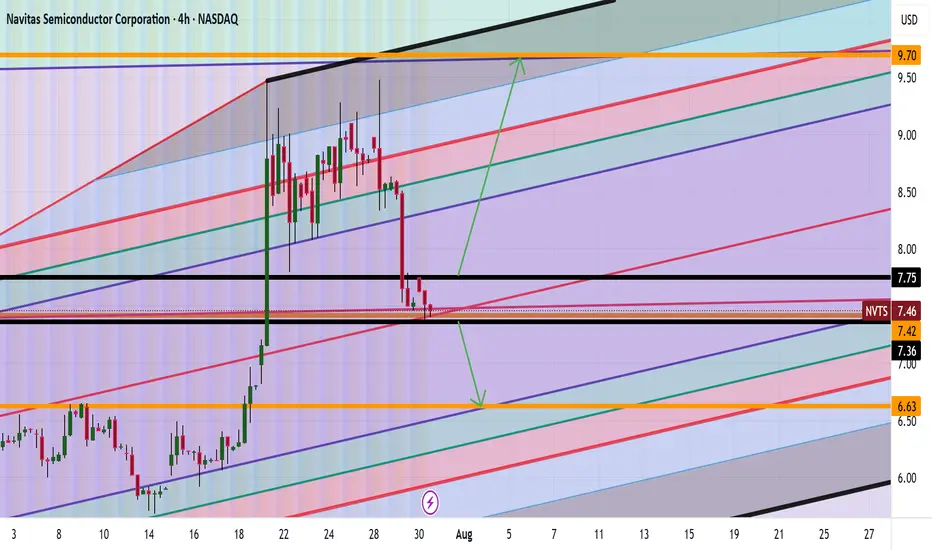
NVTS Analysis Are we Heading to $9+ Good afternoon Trading Family
Based on what we currently see with NVTS are two scenarios happening:
1) Above 7.80 highs we will thus be heading to the 9-9.7 range
2) Below 7.30 lows then we will be heading to the 6 dollar range
Happy Trading
Trade Smarter/ Live Better
Kris
Nvtsignal
NVTS Weekly Options Outlook — June 3, 2025📉 NVTS Weekly Options Outlook — June 3, 2025
🚨 AI Consensus: Moderately Bearish into June 20 Expiry
🧠 Model Breakdown
🔹 Grok (xAI)
Bias: Moderately Bearish
Setup: 5-min price under 10 EMA, MACD weak; overbought daily band
Trade: Buy $6.00P @ $0.70 → PT $1.05, SL if NVTS > $6.10
Confidence: 65%
🔹 Claude (Anthropic)
Bias: Moderately Bearish
Setup: Consolidation phase, overbought daily RSI, falling volume
Trade: Buy $5.50P @ $0.45 → PT $0.70–$0.95, SL $0.25
Confidence: 65%
🔹 Llama (Meta)
Bias: Moderately Bearish
Setup: RSI ~41, bearish MACD; still long-term bullish
Trade: Buy $5.50P @ $0.45 → PT +50%, SL if NVTS > $6.20
Confidence: 65%
🔹 Gemini (Google)
Bias: Moderately Bearish
Setup: Rally fading, MACD histogram decaying
Trade: Buy $6.00P @ $0.70 → PT $1.05, SL $0.49
Confidence: 65%
🔹 DeepSeek
Bias: Moderately Bullish (Contrarian)
Setup: Daily trend strong; news catalysts could lift price
Trade: Buy $6.00C @ $0.70 → PT $1.00, SL $0.45
Confidence: 70%
✅ Consensus Summary
✅ Recent rally is cooling across all models (overbought RSI, fading MACD)
🧲 Max pain @ $5.50 = gravitational pull risk
📉 4 of 5 models recommend buying puts
📊 Two preferred strikes: $5.50P (Llama/Claude), $6.00P (Grok/Gemini)
📈 DeepSeek remains bullish due to news catalysts
🎯 Recommended Trade Setup
💡 Strategy: Bearish Naked Weekly Put
🔘 Ticker: NVTS
📉 Direction: PUT
🎯 Strike: $5.50
💵 Entry: $0.45
🎯 Profit Target: $0.68 (+50%)
🛑 Stop Loss: $0.25 (−45%)
📏 Size: 1 contract
📅 Expiry: 2025-06-20
⏰ Entry Timing: Market Open
📈 Confidence: 65%
⚠️ Key Risks to Monitor
🔼 News catalyst (Nvidia/Hydrogen) could reverse downside
⚠️ Low put liquidity may result in wide bid/ask spreads
📈 Break above $6.20 invalidates bearish setup
⌛ Theta decay quickens late next week — exit early if no move

$NVTS is up 125%, but they might not be done yet!NASDAQ:NVTS Could see more upside if...
We close the week above $4.66 Double Bottom Breakout. This would lead us to the following targets...
🎯$6📏$7.76
- Bullish cross on H5_L indicator
- Volume shelf launch with GAP
- NASDAQ:NVDA Partnership
- Small Cap
- High Short Float

NVTS - 50% already, 300% more to go! Massive 2025 StockNASDAQ:NVTS 💾
A top 5 trade for me right now!
We are up a massive 50%+ since we called this name out for a breakout retest then move higher. We got exactly that friends. It's a massive move but what if I told you that this move pales in comparison to the overall 300%+ move I see coming over 2025! Buckle up this is going to be a wild ride friends.
Weekly Analysis:
-H5 Indicator is GREEN
-Broke out of downtrend & falling wedge in which we hit our first profit target and now we successfully retested the breakout and bounce higher! I bought more shares/ options this past week.
-Sitting on a volume shelf with a lot of room to run!
-Williams CB has created support and formed!
🔜🎯$4.65🎯$6🎯$7.62🎯$11.17🎯$12.29
⏲️Before May2026
Not financial advice.

Bitcoin (BTC) looking healthy! Hi guys,
So in this video, I'm showing you two of my favourite bitcoin indicators that show that bitcoin is looking to start the next phase of the bull run and not enter into a capitulation event down 40% that people are calling for.
These indicators are free to use on TradingView and are:
- NVT signal line
- Mayer Multiple Bands
Nothing in this video is financial advice and just one take on the market
Please do your own research. Other than that, stay healthy and keep stacking sats!
Let me know what you think.
Tchau

Dynamic NVT Signal - don't overlook itThere are several NVT indicators/charts you can find online, but I find this one as one of the best out there to spot market sentiment, buy/sell zones.
Simply put, green zones cover heavy capitulation 'oversold' conditions and hence offer a great risk : reward ratio. You'd be surprised how profitable a simple strategy like this can be. The only thing you need is patience and consistency, which is not as easy as it sounds when there's a high volume of news and events (noise) in the crypto industry. That said - please, always back test and don't trust strangers w/o doing your due diligence.
Now back to the current chart - the move is getting very overextended and the least I expect soon is a relief bounce. Capitulation event is not out of the question, but I am skeptical we will break below the 28,500$ bottom of June 2021. Why do I think the 28,500$ holds? A multitude of on-chain and TA indicators that point towards a heavy flat accumulation (30,000-60,000$) more than a trend reversal.

Bitcoin at a turning point [EN-US]Daily Graph
NVT (Network Value to Transaction) indicator
This indicator describes the relationship between volume of transfers and market capitalization.
It is also described as the price/earnings ratio of cryptocurrencies.
The calculation is done by dividing the network value by the daily volume.
At the moment, we can verify an indefinite moment.
A good bullish indicator would be to break resistance (blue dotted line), and stay above 75.
Accumulated Volume Percent
This volume indicator works similarly to OBV, except that it puts weight on volumes according to intraday volatility.
You can see a resistance on the dotted line at 5.
Breaking up would be a bullish signal.
Breaking below zero would be a bearish signal.
Simple Moving Average of 365 periods
Moving averages are great tools for plotting possible supports and resistances.
As we can see, the 365-day average is holding the price.
If it is broken, it is a warning sign for a bearish move.
Schiff's Fork
Schiff's fork demonstrates the projection of Bitcoin price in the last periods, since May/2021.
If the price breaks the upper limit, it could be a bullish signal.
Watch out for false breakouts.
Corona Day Support
The red dotted line is a support traced from March/2020.
If this line is broken, watch out for a Bear Market.
Bearish channel
The bearish channel, highlighted in orange, is another important indication.
Watch out if the price breaks the resistance or support of this channel.
* Follow your own risk management
* Past profitability is no guarantee of future profitability

Battle Planning: What if Bitcoin Double Tops?The trend has obviously been up and bullish but the chance of a double top remains real until it has passed. There have been many times over my trading career where I did both a bullish and bearish scenario "just in case" and was biased in the wrong direction for my initial position. Sometimes I did a good job switching my trades and some times not. But really, having a plan either way is good and knowing what will trigger deliberate action is very good.
Personally I have closed my margin long positions on link end eth while I watch this develop and I have taken a small ethusd short that should keep my account balance roughly flat no matter which way the market goes. Additionally you see the X I like to use on a lot of price action to see trend lines flipping support and resistance.
Null Hypothesis
The long term trend continues and price action keeps going up. My ETHUSD short keeps my account stable in USD terms and I close the trade and look for margin long entries.
Scenario 1
Price action dips to the black trend line some 20% and support is found with volume. This sets up BTC to go to new all time high and when I close my ETHUSD short and shovel the usd into my prefered alts.
Scenario 2
Price breaks the black trend line. I add to my ETHUSD short and plan to close in the target area around the previous ATH. The target is set by two critera: the hight of the valley between the peaks of the double top as shown by the black line, and the area of activity prior to the break out. That purble zone contains the top of the value area on the VPVR and in intense bull markets the price action retests this area constantly.
Scenario 3
Price goes sideways. Least likely off all scenarios.
Long term Concerns
The chart below is BTCUSD with my long term top indicators. The Bitcoin Log Growth Curves are divided into sub-channels and I find the activity around the midline (76.39 and 38.20%) play a special role as support and resistance as levels and as a zone. A break of this double top would take us very probably to the 23.61% level at about $22.3k
Second concern is the Pi cycle. This is suppose to call the tops on the daily chart and some tinkering shows it does this on several assets besides bitcoin and there are some decent signals for local tops. Below we can see on the 3 day chart it predicted an area of consolidation for BTC and on XPRUSD it nearly predicted the first ATH in 2017 and did call the high in the beginning of 2018. With the signal flashing on the above chart on the weekly this might be tagging a local high. Of course this is not the intended use of the indicator but it is still something scratching at the back of my head.
My final long term concern is the Net Value Transactions with these ribbons to provide easy to read detail. The only time we have enough chart history before to look at on the weekly chart that had the NVT pop out the top of the red ribbon was before the great dump of 2017 with our Christmas and New Years massacre. Being out of the ribbon is concerning enough, but there is a real probability that the NVT turns back to yellow and we dump in a big way.
It sounds cataclysmic but that has to be part of the battle plan because it is a big signal used by the heavy hitters. And the fact remains that on the daily, 3d and weekly every time the NVT has crossed the barrier from red to yellow we have traded lower. Lots of people don't like calls like "it might go up, and it might go down" but trying to forecast how it might go up or down is what we are trying to do.

Are you brave?It appears we have once again peaked on the NVT Signal indicator. As you can see by the 100% strike rate, we are nearing a top. Bitcoin's price, as of publishing, is within 10% of a new ATH.
NVT Ratio was created as an alternative to the traditional P/E Ratio that stocks have. NVT Signal is a derivation of NVT Ratio, and performs better than its predecessor.
What NVT Signal processes is bitcoin's market capitalization divided by a 3 month moving average of daily transaction revenue. What you end up with is a strangely accurate top/bottom indicator that does not utilize price directly.
Conceptually, under/overvaluation can be attributed to why it mirrors 'tops' and 'bottoms'. This means NVT Signal is less related to price momentum and more related to cultivating and culling profit, a cyclical process similar to harvesting seasons. Now it's time to cull.
So, how brave are you?
Information on NVT:
charts.woobull.com
Information on fees and Replace-by-fee:
en.bitcoin.it
en.bitcoin.it
The indicator:

[Overview] Bitcoin Hash Rate, Dominance, Energy, NVTS & Volume
Hash rate: Bitcoin Hash Rate Indicator.
Dominance: Bitcoin Dominance Oscillator (BTC.D RSI)
CME Volume: CME Bitcoin Futures Volume
NVT Signal: Network Value to Transactions (NVT) Signal with RMA
Energy: Bitcoin Energy Value Oscillator

Dynamic Range NVT Signal for Long-term Bitcoin ValuationABOUT DYNAMIC RANGE NVT SIGNAL
NVT Signal (Credit: woobull.com) is akin to a "PE" ratio for Bitcoin, and can be used to identify when Bitcoin is overbought or oversold based on the relative value of transactions sent across the network.
This indicator includes a 2 year moving average and standard deviation to identify outlier values, instead of declaring a static high-low range for relative valuation.
THEORY
A dynamic "high-low" range was chosen for the following reasons:
- Bitcoin is only 10 years old, it is likely that relatively "high" and relatively "low" NVT values will change with time, as have PE ratios over the last century.
- Some transactions are now made off-chain (eg. Liquid Network's private side-chain which is used by many major exchanges). If this trend continues, we can expect "normal" NVT ranges to increase with time (as the relative portion of public on-chain transaction values decreases).
CALCULATION
- NVT = Circulating Market Cap / 90 average On-chain Transaction Value*
- Overbought (default): NVT > 2-year mean + 2*standard deviations. I.e. NVT Signal is in the top 2.5% of values for the prior 2 years.
- Oversold (default) NVT < 2-year mean.**
*Data source: Blockchain.info, estimated transaction value does not include returned to sender as change.
**Oversold under 2-year mean was chosen due to the skewness of NVT Signal, it is not quite normally distributed. For example: NVT Signal has never been less than the 2-year mean - 2* standard deviations. This may change in the future.
NOTES ON USAGE
- Use with care. Bitcoin can remain "overbought" or "oversold" for extended periods (eg. 2015-2016).
- As Bitcoin ages, the validity of NVT Signal will need to be monitored. Particularly with respect to potentially increasing use of side-chains, private transactions and potentially the lightning network.
- It is likely that a 2-year “look back period” for calculating mean and standard deviation will not be sufficient in the decades to come. As Bitcoin matures and stabilizes (some time in the future), a longer "look back period" should probably be used. To allow for this, the defaults for this indicator can be easily adjusted.

Bitcoin $BTC NVT Ratio Signals Top is In, But Didn't for BottomBitcoin NVT Ratio, an indicator commonly used to time the tops and bottoms of Bitcoin "bubbles" has signaled a top is in, and during my analysis, I realized it never signaled a bottom was in during the December 2018 bottom. However, I am not sure what this means, as the creator of the indicator is bullish while the indicator suggests more bearish price action ahead.
Short or long BTC tops and bottoms using PrimeXBT (ref): primexbt.com

So you think the bottom is in? 50% correction incoming.Hello fellow traders today i have a chart analysis that some of you have already thought of or seen. We have yet to see our bottom and while this bull rally has been pleasant for all who have been longing it, the bulls may be running out of steam. What's driving our rally is beyond me, possibly the trade war between the U.S. and China or manipulation due to the tether audit, no one knows, but i do know that we have one of our highest NVT sell signals that we have seen in a while, and it is indicating that we are currently in a bubble. The NVT signal has had 100% accuracy up until this date predicting drops and corrections of at least 50% and up to 68%. My target puts us back to 4k where i believe we will either bounce from or plunge into the abyss. The prolonged sell signal on NVT makes me cautious as whoever or whatever is causing this bull rally may have an agenda in mind that is not showing up in the charts.
As you can see I have drawn in a head and shoulders pattern and i believe it is possible that it will play out similar although i feel the right shoulder may be smaller in length before dropping, but also on the RSI it appears we have double topped, so unless the bulls are able to push the price up and go above $10k in the near term i do not believe that bulls are in for a painful correction of at least 50% relative to our recent top at $9100.
On the contrary, I could see that Bitcoin goes to $20k end of year or higher, but that would assume that this 86% decline has all along been a bear trap and we were never in a bear market, but that is unlikely imo.
If i left anything out please leave a comment and ill respond as fast as i can.
I hope you gained some insight from this and happy trading. This is not investment advice, these are just my opinions.

Can the NVT signal bounce once more on it's trendline ?This is a snapshot of the NVT signal, following @TradingShot proposition of one more 25% upward movement for this rally.

What BTC retracement before the Moon ?So we've been following the NVT Signal with a bad call at $8000 when we expected the overbought NVT Signal trend line to be crossed.
This BTC pump is on wall street steroids, meaning also that it is subject to traders taking benefits based on indicators. But let us remember that all rationality and information available is priced in within 15 minutes nowadays, you barely have the time to re-tweet the news, a robo trader has acted already.
It’s been an amazing 16 weeks rally. Is the market ready for a correction ?
Again the NVT Signal is heading down to cross it’s second formed trend line, will it bounce a third time or will it fall below 150 ?
And then, when it falls, to what fib level :
0.5 around $6150
Or down to 0.382 at $5500
What is your accumulation level for this retracement ?
Your comments and shared ideas are most welcome.

EPIC BTC BULL TRAP : Do you SHORT on such NVT Signal ?Following the parabolic rise of BTC to 8300, we are in for a correction. The NVT Signal is showing Epic overbought proportions and the last rise was stopped by the NVT trendline. Next move is down to correct the overbought signal.
What is your level for this correction ?
0.618 drop from top to 5260USD
0.69 drop from top to 4900USD
...?

Improving on my NVT Signal readingEuphoria is in the air. Still the NVT Signal announces imminent correction. Was rejected trying to raise again after crossing the trend line and still holds in mid air before correcting to 0.618 Fib or lower.
Thanks for your crowdsourced experience.
What is your reference Chart of the moment for NVT Signal sens making ?

Epic Overbought BTC NVT Signal - trend line crossing We have been made attentive to an epic overbought NVT Signal indicator.
Depending on how you position the trend line, the NVT Signal is crossing the trend line, announcing the correction.
Do you have a rational analysis that supports a rebound on the NVT trend line and another bull leg for BTC ?

Epic BTC Overbought NVT Signal - more aggressive correction thanEpic BTC Overbought NVT Signal - more aggressive correction than 7th December 2017 to come ?
Thanks @Magic for pointing that signal to us.
How do you think the major Alts will behave if this correction starts now ?

Bitcoin Maxed, NVT screaming waterfall aheadG'day friends! What a great time to be alive and knowing how to trade and capitalise on these volatile crypto currency movements. We are some of the chosen few! Chosen because we chose to master it. Getting right into it, Bitcoin is at stage 7 of 7 of the Cryptonite price cycle. Waterfalls in the next 48 hours or so. The NVT indicator has broken its upwards trendline and has been in the red zone for a very long time and ready to break to the downside. Additionally we are very close to a final retest of the 50 week moving average which is very key. A great entry for a short position here with an exit signal if we close above $5600. Target down around the breakout base point of the pump candle around $4000 and possibly even further.
Clarity is power
-JA-
***This info is not a recommendation to buy or sell. It is to be used for educational purposes only. Make logical sound decisions for yourself by risking only what you’re willing to lose. It’s on you. ***
