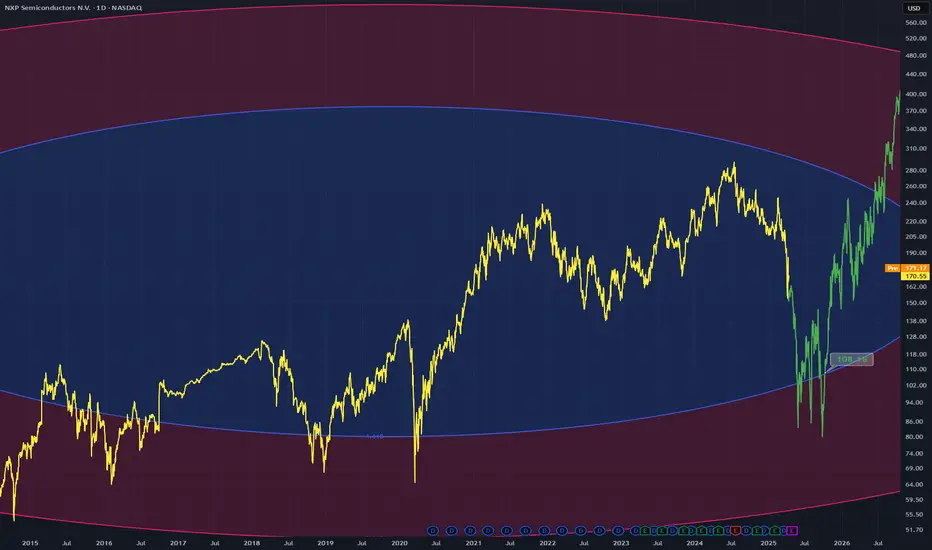
NXPI - Fib Circle RetestA retest of the circle 1.618 fib circle in blue
This has been seen as an area of support for awhile now
I say price will fall to it and find support again before price takes off back upwards on this daily chart
A double top is also present that supports the idea that a downward movement is coming on this daily
NXPI
Nxpi in the next few daysNxpi will be bullish in the next few days
we will see very strong movement in the next few days for this stock

NASDAQ-NXPI: Is the Market on the Verge of a Reversal?A Critical Juncture: What’s Next for NASDAQ-NXPI?
The semiconductor sector has been riding a wave of volatility, and NASDAQ-NXPI is no exception. The stock currently trades at $208.55, reflecting a 29.56% decline from its all-time high of $296.08 recorded in mid-2024. With a downward deviation of nearly 30%, the market is now questioning whether this is a buying opportunity or the precursor to another leg down.
Technicals reveal a battle between bulls and bears. The 50-day moving average sits at $212.72, hovering just above the current price, indicating a near-term resistance zone. Meanwhile, RSI (Relative Strength Index) at 39.35 suggests the stock is creeping into oversold territory, yet not signaling a definitive reversal. Furthermore, sell volumes have surged, forming multiple bearish candle patterns, reinforcing the short-term downside risk.
Adding to the complexity, macroeconomic pressures, including a strong U.S. dollar and shifting interest rate expectations, have kept buyers cautious. But with powerful support levels at $206.34 and $198.82, is this a crucial inflection point?
The Big Question: Reversal or Continuation?
With a resistance ceiling at $211.02, the next move could define NXPI’s short-term fate. A break above this level could trigger a bullish surge, but failure to hold above $206.34 may invite another wave of selling.
Will buyers step in at this critical moment, or are we in for another leg downward? The answer may shape the next major move in NXPI. Stay alert.
NASDAQ-NXPI Roadmap: Tracking the Market’s Footsteps
January 14 – Buy Volumes Max (Confirmed Bullish Signal)
The first major signal of a buy-side push emerged on January 14, with an increased buy volume pattern at $208.88. The price closed higher at $210.53, setting the stage for a continuation. The key takeaway? Buyers were stepping in, and the momentum was shifting.
January 15 – Sell Volumes Max (Bearish Reversal Signal Fails)
Just a day later, sell-side pressure increased, marking a potential reversal with a closing price of $213.49. However, instead of following through, the market did not sustain the downward movement, negating this sell signal. The previous buy volume pattern held firm, proving bulls were still in control.
January 17 – VSA Buy Pattern 3 (Confirmed Bullish Trend)
The market locked in another bullish confirmation as the VSA manipulation buy pattern formed at $214.45, closing higher at $214.61. With strong buying activity in place, the stock continued its ascent, respecting the trendline and validating the prior bullish signals.
January 21 – Sell Volumes Max (Bearish Confirmation)
The first true bearish confirmation materialized as the price turned south, closing at $214.78 after opening at $215.26. This drop signaled a shift in sentiment and tested the conviction of the bulls. With further confirmation needed, all eyes turned to the next move.
January 22 – Sell Volumes (Bearish Momentum Builds)
With a lower close at $215.98, sellers began solidifying control. The sequence of declining closes and increased sell volumes confirmed the downtrend was gaining steam.
January 23 – Buy Volumes Take Over (Reversal in Motion)
Just as the bears looked ready to dominate, buyers stepped back in, driving the close to $219.89. This strong shift nullified the previous bearish sequence and set the stage for a fresh upward move.
January 24 – Buy Volumes Max (Confirmed Bullish)
Momentum followed through with a close at $213.44, reinforcing that buying interest was sustained. The roadmap now pointed to another attempt to test higher resistance levels.
January 27 – Increased Buy Volumes (Final Bullish Confirmation)
The price surged to $215.2, cementing the overall bullish bias established throughout the roadmap. The earlier bearish dips proved to be shakeouts, and those who stayed in line with the buy-side confirmations saw the real move unfold in their favor.
This roadmap clearly showcases how bullish and bearish patterns played out, giving traders and investors a structured way to read the market’s evolution. Will the next setup follow the same rhythm, or is a fresh shakeout coming? Stay alert.
Technical & Price Action Analysis
Support Levels:
206.34 – local buyer zone; if broken, expect further downside
198.82 – critical level for bulls; a break here could trigger a move to 192
192.375 – last potential hold for buyers; below this, free fall territory
Resistance Levels:
211.02 – immediate resistance; needs a solid breakout for upside continuation
222.00 – key level to watch; if bulls take control, momentum could accelerate
234.955 – major resistance; breakout here would shift the structure bullish
Powerful Support Levels:
224.26 – a strong demand zone; if lost, could flip into heavy resistance
Powerful Resistance Levels:
200.00 – psychological barrier; flipping above this would be a strong bullish sign
175.00 – long-term level; failure to reclaim may keep sellers in control
149.90 – structural pivot; reclaiming this zone would confirm trend reversal
If any of these levels fail to hold, they will act as new resistance zones, and the price will likely revisit them before making the next move. Watch for fakeouts and liquidity grabs before committing to a trade. 🚨
Trading Strategies Based on Rays
Concept of Rays
My proprietary analysis method is built on Fibonacci-based rays, dynamically adjusting to market movement. These rays create predictive zones where price interactions suggest either continuation or reversal. Importantly, entry positions are taken only after price interacts with a ray and initiates movement. Each move extends from one ray to the next, setting up structured trade targets.
Dynamic Factors in Play
Moving Averages: MA50 at $212.72, MA100 at $214.16, and MA200 at $212.76 serve as dynamic resistance/support levels. Their intersection with key rays amplifies probability zones.
VSA Rays: These pre-defined market structures align with volume-driven price shifts, making them highly reactive points for execution.
Optimistic Scenario (Bullish Continuation)
Entry: Break and close above $211.02 after ray interaction.
First Target: $222.00 – Key resistance; first profit zone.
Second Target: $234.955 – Breakout continuation level.
Third Target: $247.67 – Long-term bullish extension.
Pessimistic Scenario (Bearish Breakdown)
Entry: Rejection from $211.02 or breakdown below $206.34.
First Target: $198.82 – Major support test.
Second Target: $192.375 – Strong demand zone.
Third Target: $175.00 – Structural breakdown zone.
Trade Opportunities Based on Rays
Momentum Breakout Trade: Long on a break above $211.02, targeting $222.00.
Reversal Trade: Short after a rejection from $211.02, aiming for $206.34.
Pullback Entry: Buy from $206.34 if it holds as support, riding to $211.02.
Breakdown Trade: Short if $206.34 fails, targeting $198.82 first.
Range Scalping: Buying dips at $206.34, selling resistance at $211.02 until a breakout.
These setups provide both aggressive and conservative trading approaches. Every trade moves from ray to ray, setting up the next logical price step.
What’s Next? Let’s Discuss!
Trading is all about understanding key levels and making decisions at the right moment—that’s exactly what my ray-based strategy helps with. If this breakdown made sense to you, drop a comment with your thoughts or questions—I always reply!
Don’t forget to hit Boost and save this idea so you can check back later and see how price moves along my levels. Tracking the market in real-time is the best way to sharpen your trading edge!
By the way, all the rays and levels are automatically mapped by my private indicator. If you’re interested in using it, send me a direct message—I’ll explain how it works.
Looking for custom analysis on another asset? I can do that too! Some ideas I share publicly, others—privately on request. If there’s a ticker you want mapped out, Boost this post and let me know in the comments!
And if you find my insights valuable, make sure to follow me here on TradingView—this is where all my best work gets posted first. Let’s trade smart! 🚀

NXPI NXP Semiconductors Options Ahead of EarningsAnalyzing the options chain and the chart patterns of NXPI NXP Semiconductors prior to the earnings report this week,
I would consider purchasing the 300usd strike price Calls with
an expiration date of 2024-10-18,
for a premium of approximately $9.10.
If these options prove to be profitable prior to the earnings release, I would sell at least half of them.
NXPI NXP Semiconductors

NXPI: Potential BuyCurrently retesting the previous range, I'm seeing upside potential backed by positive analyst expectations.

NXPI: Potential BuyI'm expecting the bullish momentum to continue towards new all time highs. Areas plotted to look out for.

NXPI - Found New SupportA new support has been found upon a line that was recently seen as resistance (green dotted)
This is also above a larger up channel formation
This support touch should result in a bull bounce

NXPI exposure to ChinaThe U.S. warning China it could face devastating sanctions if it defies the ban on doing business with Russia!
This is a move that could have huge impact on American companies.
38% of NXP Semiconductors revenue comes from China.
My price target from NXPI is $134.
Looking forward to read your opinion about this.

Long | NXPI | Earning dayNASDAQ:NXPI
Possible Scenario: LONG
Evidence: Price Action
Call options, Strike 200$, 05/21/21
This is my idea and could be wrong 100%,

The interesting case of NXPI.It is now 4 hours into the day and I have analyzed a grand total of 10 stocks. I am clearing a lot of clutter out of my head though. If they ever pass a law that keeps U.S. markets open over weekends... I would worry for a lot of people's sanity. Chiefly my own.
Can someone explain to me what a Gann is? And what you do with it? Or give me some leads at least?

Ichimoku entry NXPII"m not sure what if any affect dividend payouts have on this strategy, probably worth some analysis


NXPI: ABCD completion looking for +25% I forgot how many times NXPI has changed owners, everybody loves NXPI silicon. After getting jilted on the alter by QCOM, NXPI is $2bn richer and running a $5bn buyback program. Stock is basing after an ABCD completion and exhibits signs of a positive divergence between the price action and MACD. Will look to take a small flyer at current prices with the recent trough providing reference for a stop and see if we get confirmation of a trend change to scale up. Expectation is for the stock to retest the 200-DMA which happens to be the 78.6% retracement level from the last peak.

QCOM Weekly: Pennant formation with downside target $32This is a long-term weekly chart on QCOM which completed an extended ABCD at the $81 level on Jul'2014. Currently trading near the top of a pennant formation with a clearly defined stop-loss level (ie. upper bound of pennant) with a huge potential if QCOM does break down and start a continuation CD leg to $32. This is a company fighting with its major customer (AAPL), turning down a premium bid from AVGO and shelling out top dollar for NXP. If AVGO walks away. management would have lots to answer for.

Launching from Earth back to SkyWedging down Triangle. Bullish Divergence in MFI, RSI & MACD. Bullish Crossover on MACD


NXPI 91.45 – Probes key resistance clusters on the daily chartNXPI 91.45 –bullish – Probes key resistance clusters on the daily chart
NXPI is probing key resistance clusters on the daily chart including the 200 day moving average currently at 92.09, the 3.5-month falling trendline (from June 1, 2015 peak) and the 50% retracement of the 114.00/72.05 fall at 93.12. A decisive upside breach of the area would extend the 4-week rally towards 94.90 (September 9, 2015 high) next. 89.13 (September 16, 2015 low) near the rising channel support should hold dips.
Outlook:
Daily: bullish
Weekly: bullish

NXPI 91.45 –bullish –Long-term trendline underpins strength NXPI 91.45 –bullish –Long-term trendline underpins strength
NXPI found support at 72.05 (August 24, 2015 weekly low) just above the 2.5-year rising trendline (from April 22, 2013 low). Since then, it has rallied strongly to retrace over 50% of the 114.00/72.05 fall. Technical indicators are improving, suggesting further upside. Above 94.90 (September 9, 2015 weekly high) would strengthen towards 110.26 (July 27, 2015 weekly lower high). However, a deeper pullback below a 3-week rising channel support would caution bulls for prolonged consolidation and expose the 85.13/81.32 zone (September 7/August 31, 2015 weekly lows) which may hold dips.
Outlook:
Daily: bullish
Weekly: bullish

AVGO- Winding up? 4-22 Chart wise its all about an upside crossover
of the green line that? ACTUALLY sticks. In the
meantime? The blue lines are support zones in
the event of failure to engage.
Feel free to follow on TWTR at
@AmazingPatterns
For informational and educational
purposes only, these are not
recommendations, trade at your own risk.

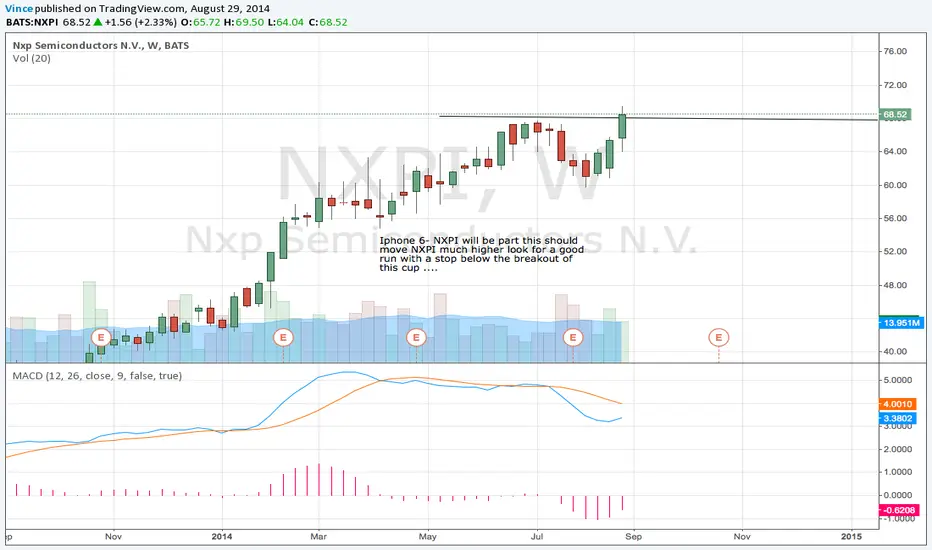
NXPI running on iPhone 6Watch for gap up on Monday this stock has great potential to run hard...I talked about it in London in 2012 and has come a long way since, the time is now