Crude Oil Trade Idea: Intraday mechanicsNYMEX:CL1! NYMEX:MCL1!
Bigger Picture:
Traders should note that news headlines do not always drive the price action. More often, news outlets look for narrative to align with the price action.
Previously, it was about the supply glut and worsening demand due to an uncertain outlook. Now the latest news flow is about Aramco OSP rising, OPEC+ adding another 548K bpd in August — higher than anticipated 411K — of the wounding of involuntary cuts. News outlets now view this as signs of demand growth and low inventories.
What has the market done?
Market has consolidated, building acceptance around microComposite Volume Point of Control at 65.50 (mcVPOC). Market then broke out of this balance.
What is it trying to do?
Market is building value higher; 2-day mcVPOC is at 68.29.
How good of a job is it doing?
Market is holding support and has tested resistance multiple times. It has also held support.
What is more likely to happen from here?
Further movement higher as long as it holds above support and yearly open confluence in the short term.
Key Levels:
• Resistance zone: 68.95 - 68.85
• pHi: 68.87
• 2-day VPOC: 68.29
• pSettlement: 68.38
• yOpen: 67.65
• Support zone: 67.70 - 67.50
• pLow: 67.89
Primary Scenario:
Crude oil pit session begins with open auction in yesterday’s range. Prices move lower to test prior day's low, 2-day balance support in confluence with yearly open. Prices push back higher towards yesterday's settlement and 2-day Volume Point of Control (VPOC) at 68.33.
Secondary Scenario:
Crude oil pit session begins with open auction in yesterday’s range. Market consolidates and chops around pSettlement and 2-day VPOC. Market takes out overnight high, fails to go further higher, and reverts lower. Settles below overnight low, however staying above prior low to continue one-time framing higher for the regular trading hours (RTH).
Nymexcrude

Crude Oil Weekly OutlookNYMEX:CL1! NYMEX:MCL1!
With Nasdaq futures hitting all-time highs, our attention now turns to Crude Oil, which has seen a sharp pullback over the past week.
All-time highs in equity indices present a unique challenge:
There are no historical reference points—no prior price or volume data to lean against. Traders typically turn to tools like Fibonacci extensions, measured moves, or rely on market-generated information and emerging intraday levels before making decisions.
What Has the Market Done?
Crude Oil Futures (CL) posted a record drop last week, falling sharply from a Sunday open high of $78.40 to a Monday close low of $64.38—a $14.02 decline.
This sharp sell-off followed developments suggesting a potential Iran–Israel ceasefire and the end of a two-week conflict, prompting markets to rapidly unwind the geopolitical risk premium.
What is it trying to do?
CL Futures have since consolidated around the 2025 mid-range. The market appears to be in a balancing phase, digesting the removal of war-related premiums and recalibrating based on fundamentals.
How Good of a Job Is It Doing?
Having effectively priced out war risk, the market is now refocusing on fundamentals.
The global demand outlook is improving, driven in part by progress in trade deals.
OPEC’s June Monthly Oil Market Report (MOMR) forecasts global oil demand growth of 1.3 mb/d for 2025.
This transition from headline risk to fundamental drivers indicates market maturity and resilience, albeit within a still-volatile regime.
What Is More Likely to Happen From Here?
Today marks the final trading day of the month, and seasonal demand will become increasingly relevant.
Summer weather and travel activity are expected to drive demand for jet fuel and gasoline.
These seasonal tailwinds, if sustained, could help stabilize price action around key technical zones.
Key Levels:
yOpen: 67.65
pHi: 66.09
pIB Hi: 66
2025 mid-range: 65.39
pLow: 64.80
Overnight Low: 64.55
Naked VPOC: 64.50
Scenario 1: Continued Consolidation (Balance Holds)
Crude oil maintains range-bound behavior.
Strategy: “Outside-in” trading—fade moves at range extremes until new directional information emerges.
Scenario 2: Break from Balance
If directional conviction builds, price could break the current consolidation.
Upside target: Yearly open near $67.65.
Downside risk: March 2025 low if $64.40 fails.
All intraday levels noted above should be monitored for structure and participation.

Planning for the Next Trade in Crude OilNYMEX:CL1!
Key Levels – Higher Timeframe:
• 2025 High: 78.56
• Yearly Open (2025): 69.64
• 2025 mCVPOC: 71.83
• Yearly VWAP: 68.41
• AVWAP from Yearly Highs: 67.71
• 2025 mCVAL: 65.28
• March 2025 Low: 64.37
• 2024 Low: 59.91
April 2025 Key Levels:
• April mCVAL: 58.79
• April mCVPOC: 60.94
• April AVWAP from Lows: 61.29
• April AVWAP from Highs: 61.76
• April mCVAH: 63.73
Our previous trade idea played out as expected. With updated levels now in place, we aim to reassess the market context without falling into recency or confirmation bias. These biases often lead to an overly bearish outlook at market lows, especially amid ongoing headlines around trade war tensions and supply concerns. While such fundamentals are important, maintaining objectivity is key.
This leads us to the central question: Is all this bearish sentiment already priced in? If so, why are sellers still dominant?
From a broader perspective, the overall context for crude remains bearish. However, this does not imply an immediate continuation to lower prices.
Currently, price is trading below both the midpoint of 2025 and that of 2024. Additionally, the recent price swing failed at the March 2025 low—an important technical rejection. The 2024 low at 59.91 now serves as key structural support. We anticipate further consolidation within the April 2025 value range, specifically between mCVAH (63.73) and mCVAL (58.79).
We define the area between April’s mCVPOC (60.94) and AVWAPs (61.29 / 61.76) as a "noise zone"—a region where price action is likely to be choppy and directionless. This zone is not favorable for directional trades.
Potential Trade Setup – Range-Bound Play
Example Trade 1: Long Crude Oil
• Entry: 59.91
• Stop: 59.20
• Target: 61.76
• Risk: 71 ticks
• Reward: 185 ticks
• Risk/Reward Ratio: 2.6R
Example Trade 2: Long Crude Oil
• Entry: 58.80
• Stop: 58.20
• Target: 61.76
• Risk: 60 ticks
• Reward: 296 ticks
• Risk/Reward Ratio: 4.93 R
Important Notes:
• These are example trade ideas and not financial advice or recommendations.
• Traders should conduct independent analysis and ensure proper risk management.
• Stop-loss orders are not guaranteed; slippage may occur, resulting in losses beyond predefined levels.
• AVWAP levels are accurate at the time of posting, they may vary as indicator further calculates prices with new volume and price information.
Glossary Index for all technical terms used:
ATH: All time high
VPOC: Volume Point of Control
VAL: Value Area Low
VAH: Value Area High
VP: Volume Profile
AVP: Anchored Volume Profile
C: Composite (prefix before VAL, VAH, VPOC, VP, AVP)
mC: micro-Composite (prefix before VAL, VAH, VPOC, VP, AVP)
AVWAP: Anchored Volume Weighted Average Price
Green Zones: Bull/ Buyers support zones
Red Zones: Bear/Seller resistance zones
Planning the Trade: Crude Oil Scenarios in a Shifting Macro LandNYMEX:CL1!
In volatile times, both opportunities and risks increase. Traders gain the ability to be more selective, adapting to new market regimes by adjusting risk and trade management strategies. Key tools in this process include indicators such as the Average True Range and Close-to-Close volatility sigma bands. April 20, 2020: A historic day, WTI Crude Oil prices traded negative for the first time, and we have yet another volatile April.
"If you fail to plan, you are planning to fail." Preparation is essential before taking on the market head-on.
Many participants choose to stay on the sidelines when volatility exceeds 1 standard deviation. Others, however, see this as an opportunity—adapting their risk per trade, adjusting targets, and refining trade management. Reducing position size can be an effective way to manage periods of heightened volatility.
This Week's Trade Idea: Crude Oil
We'll be reviewing Crude Oil price action with updated levels, fresh insights, and framing a trade plan with an example idea for reference.
Key Levels:
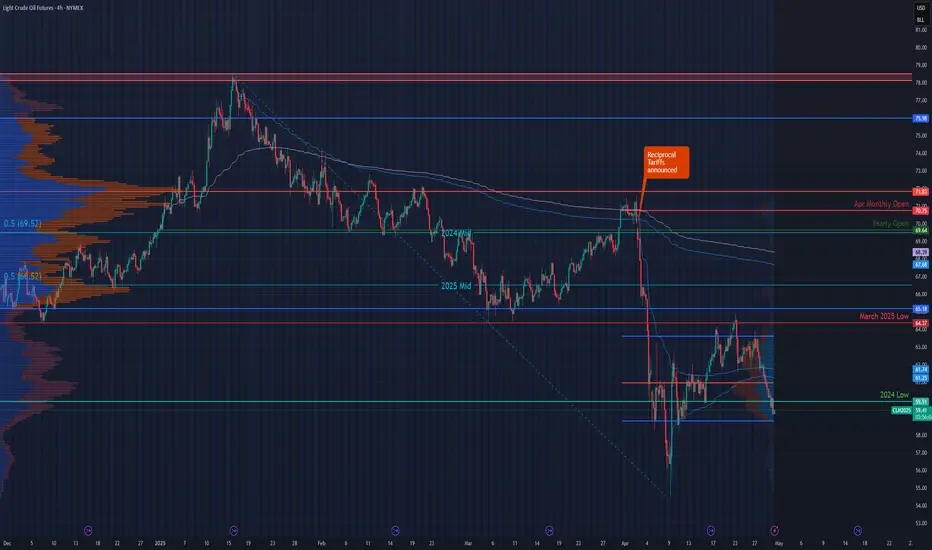
• April Monthly Open: 70.75
• 2025 mCVPOC: 71.13
• Yearly Open: 69.64
• 2024 Mid: 69.52
• 2025 Developing Mid: 66.52
• 2025 mCVAL: 65.08
• March 2025 Low: 64.37
• 2022 CVAL: 61.60
• 2024 Low: 59.91
The recent announcement of reciprocal tariffs, coupled with OPEC+ production plans (though scheduled earlier), and the rising uncertainty around a possible recession, have collectively weighed on demand expectations—resulting in a significant decline in oil prices. Although the 2024 low was reclaimed and prices have remained above this level, the sustainability of this recovery remains uncertain.
Scenario 1: Push Higher Towards 2025 Mid
In this scenario, we anticipate prices closing above March lows. Price then pushes higher toward the 2025 developing mid-range, re-entering the 2025 micro composite value area (mCVA).
Example Trade Idea:
• Timeframe: Hourly
• Setup: Wait for a candle close above March lows. Look for a pullback reaction off the 2025 Value Area Low (VAL).
• Entry: 64.50
• Stop: 64.00
• Target: 66.50
• Risk: 50 ticks
• Reward: 200 ticks
• Risk/Reward Ratio: 4R
________________________________________
Scenario 2: Range-Bound Price Action
In this scenario, the March low acts as strong resistance, aligning with the 2025 mCVAL. Price reverts lower towards the 2022 CVAL.
Example Trade Idea:
• Setup: Watch for signs of buyer exhaustion near March lows. If sellers regain control, look for a move back down toward 2022 CVAL.
• Timeframe: Hourly
• Entry: 64.00
• Stop: 64.40
• Target: 62.00
• Risk: 40 ticks
• Reward: 200 ticks
• Risk/Reward Ratio: 5R
________________________________________
Important Notes:
These are example trade ideas provided for educational purposes and are not intended as trade recommendations. Traders should perform their own analysis and thorough preparation before entering any positions.
Please be aware that stop losses are not guaranteed to trigger at the specified levels, and actual losses may exceed predetermined stop levels.
________________________________________
Glossary:
• VA: Value Area
• VPOC: Volume Point of Control
• VAL: Value Area Low
• C: Composite (used as a prefix: VA, VAL, VAH, VPOC, etc.)
• mC: micro Composite (used as a prefix: mCVA, mCVAL, etc.)

WTI Crude Oil Trade Plan: DOE Release NYMEX:CL1!
In this tradingview blog, we go over our technical setup and trade idea for Crude oil.
It is important to note we also have DOE inventory numbers coming at 10:30 ET.
Once the release has settled in, the trade idea can be framed using either of our two scenarios.
Scenario 1: Liquidity Trap
Rejection above March Monthly Open or Yearly Open and prices mean revert towards March mcVAH and CVPOC confluence. The idea considers the trend from last Wednesday. Late breakout buyers get trapped. Higher time frame participants push prices lower.
An example swing trade idea would be taking a long position once the release has settled and waiting for a pull back around 69.50.
• Entry: 69.50
• Stop: 70.30
• Target: 68.15
• Risk: 80 ticks
• Reward: 135 ticks
• Risk/Reward ratio: 1.69
This is an example swing trade idea that may play out by the end of the week.
Scenario 2: Shift back into 70 - 75 range distribution.
Immediate resistance is at March monthly open and yearly open. Above it the path clears towards Q1 mid-range and 2025 mCVPOC.
An example of a trade idea for this scenario is to wait for a breakout and close of candle on the 30 minutes time frame above yearly open. Wait for a pullback towards 70.28
• Entry: 70.35
• Stop: 69.50
• Target 71.45
• Risk: 85 ticks
• Reward: 110 ticks
• Risk/Reward ratio: 1.29
Please note that these are example trade ideas. Trades are advised to do their own preparation. Stops are not guaranteed to trigger, and losses may be greater than predetermined stops.

WTI Crude Oil CL Futures Weekly Plan AnalysisNYMEX:CL1!
In this tradingview blog, we will refer to our February 18, 2025 weekly trade plan for NYMEX WTI CL futures . Last week, we outlined two potential scenarios, with our primary scenario playing out—though not exactly as expected. Prices reversed lower more sharply than anticipated, offering minimal pullbacks on the 4-hour timeframe. However, when analyzing the hourly chart, our plan aligned well, as prices ultimately reverted to key LIS/yearly open bull support, which also confluences with the 2025 VAL.
We highlighted the following key levels:
2025 mcVPOC: 72.82
Feb 2025 mcVAH: 72.48
2025 mcVAL: 70.56
Yearly Open/ LIS: 70.52
Key Bull Support/ Confluence Zone: 70.52 - 70.12
Scenario 1 stated “Range bound week ahead.” We noted the following:
“In this scenario we expect range bound price action contained within Feb 2025 micro composite Value Area.”
Consistency is key in everything we do. We are creatures of habit. Energy flows where attention goes.
We provide these weekly plans to traders and the wider public to showcase that, instead of strategy hopping, a trader can achieve consistency by sticking to one approach. If that approach is not working, perhaps it is time to go back to the drawing board. Whether that be backtesting, walk-forward optimization or incorporating key market statistics that you have gathered and observed.
The goal of these weekly plans is to provide you with a structured roadmap that you can adapt to your own trading style. In our experience, while there are many ways to approach the market—whether through different indicators or methods for drawing levels and plans—staying consistent in your approach often leads to identifying similar key levels. Volume, price and time leave behind footprints. Although they do not provide a certain future, they can help you stay grounded, accepting the random nature of the markets, thinking in terms of probabilities and perhaps learning more so you can also gain similar insights.
As Bruce Lee said, “I do not fear a man who practiced different kicks a thousand times. I would fear a man who practiced the same kick a thousand times.”

Is CL looking bearish? Short below LIS/Yearly Open?NYMEX:CL1!
Macro update:
Will we see another bullish leg like Jan 2025? Or does crude oil have room to move further lower and resume its downtrend after putting in the high of the year?
In our opinion, most headlines since the new US administration have already been priced in by market participants.
Crude oil fundamentals—encompassing supply, production, and demand outlook—are likely to influence prices more significantly than headline news. Our analysis indicates that the market has rebalanced, trading above the Composite Volume Point of Control (CVPOC) at $68.45 per barrel, as derived from our 2022 anchored Composite Volume profile. Furthermore, the 2025 Volume profile is exhibiting a “b”-shaped formation, signaling a move toward balance in its lower range.
From a market auction perspective, two key price ranges are established:
Q4 2024 Lower Distribution: Approximately $65–$70, indicating a balanced market.
Q1 2025 Value Area: Approximately $70–$75, also reflecting balance.
In our analysis, it’s essential to adopt a broader view by examining higher timeframe levels to stay aligned with these key market levels. While intraday or intrawork trends may display bearish or bullish momentum, the overall market auction framework suggests further consolidation within these ranges—unless new developments significantly alter the crude oil fundamentals or breaking headlines emerge that have yet to be priced in.
Key Levels to Watch
Key levels represent areas of interest and zones of active market participation. The more significant a key level, the closer we monitor it for potential reactions and trade setups in alignment with our trading plan.
Jan 2024 CVPOC and mCVPOC Q4 2024 confluence: 68.45 - 68.25
Key Bull Support/LIS: 69.90 - 70.50
Feb 2025 VAL: 70.80
2025 mCVPOC: 72.82
Feb 2025 VAH: 72.70
mCVAH/Jan 2025 mid: 74.96 - 74.80
Scenario 1:
Price gets above key support to further consolidate within Feb 2025 Value Area
Scenario 2:
Intraday bullish price action with higher lows that fails to gain momentum above the 2025 VPOC.
Scenario 3:
Price holds below Yearly Open and LIS key support. A bearish head and shoulders pattern develops to push prices lower to test CVPOC 2022.
Micro CME contracts allow for more precise risk management during volatile market conditions. Additionally, you can participate in the CME and TradingView paper trading competition, giving you the opportunity to test your skills in The Leap without risking real money.

Levels to consider for Crude oil Futures CL1!On this video i discuss what I think is the next long/short to consider and illustrate how not to get caught up in the noise of low probability setups .
Currently we are trading inside of a range between the POC and the VAH .
I look back on previous highs in the chart and how we reacted at those levels and what I potentially see looking forward . My bias overall is expecting more downside but I dont marry that one bias and simply look at the PA from both sides with a focus on having a plan in the event of a move up or Down .

CL Trade Idea: Key Levels & Strategies Amid VolatilityNYMEX:CL1!
With Trade War 2.0 unfolding, managing risk in futures trading is more crucial than ever. One way to mitigate risk is by utilizing micro CME contracts , allowing for more precise risk management during volatile market conditions. Additionally, you can participate in the CME and TradingView paper trading competition, giving you the opportunity to test your skills in The Leap without risking real money.
Crude Oil Futures:
It’s the start of a new month. We saw our last week’s idea “scenario 1” partially play out before prices pulled back higher towards our neutral LIS.
As mentioned above, it is our opinion that current situations and macro news may result in heightened volatility, so it is important to trade what you see and not what you think.
Do not get fixated on your view on the market. Be ready to shift and adapt as the markets evolve on the hard right edge.
Instead of recapping and presenting a macro update today, we will shift our focus on the charts. Looking purely at price, time, volume, and key levels to create a plan for the week.
Key Levels to Watch
Key levels represent areas of interest and zones of active market participation. The more significant a key level, the closer we monitor it for potential reactions and trade setups in alignment with our trading plan.
Micro Composite Value Area High (mCVAH) January 2025 : 76.00
January 2025 mid- range: 74.96
February Monthly Open: 74.14
Micro Composite Value Area Low (mCVAL) January 2025 : 71.82
Yearly Open: 70.52
2024 Mid- Range: 70.40
Scenario 1: Rejection confirmation at January 2025 Mid
Price has attempted to push above January 2025 mid and was rejected. This was a key level of interest to validate longs in our last week’s trade plan. Rejection of this level and price now below monthly open. There is room for prices to shift lower towards mcVAL Jan 2025 and test of key bull support at yearly open and 2024 mid range.
Scenario 2: mcVAL 2025 to act as intermediate support
If we see this level hold, in our opinion, Crude oil may be establishing a new range capped within mcVAH and mcVAL Jan 2025 until we see a break of either side. That said, intra day volatility may increase with headline news impacting prices.
As always it is paramount to manage your risk as losses are an inherent part of trading.
What are you focusing on amid all the headline news? We'd love to hear your thoughts!

Are CL Futures starting a new bull trend in 2025?Crude Oil WTI Nymex Futures
NYMEX:CL1!
Big Picture:
Crude Oil WTI NYMEX Futures Update – January 2025
Crude Oil WTI NYMEX futures are trading higher, with bullish price action evident at the start of 2025. Price has broken above the 2024 Composite Value Area High (CVAH) and is now approaching the Composite Value Area High from the 2022 high, as shown in the chart above.
Macroeconomic Outlook
From a global perspective, persistent inflation may be supported by elevated commodity prices. Higher crude oil prices, coupled with potential trade wars and tariffs, could drive up costs in major sectors, such as rare earth minerals.
In this scenario, we anticipate central banks, including the Federal Reserve, maintaining higher interest rates. We believe the previously expected two rate cuts of 25 basis points each for this year may be reduced to zero. However, this creates a challenging environment for central banks. A combination of sticky inflation, resilient job markets, and low unemployment could lead to a "goldilocks" scenario. Recessionary risks will be increased unless some means of fiscal policy measures provide further support to the US economy.
Key Levels to Watch
Key levels represent areas of interest and zones of active market participation. The more significant a key level, the closer we monitor it for potential reactions and trade setups in alignment with our trading plan.
CVAH: 79.50
Resistance R1: 79.50 – 79.85
Resistance R2: 81.30 – 81.60
Neutral Level: 78.77
CVAH 2024 / Support: 75.00
Support (Yearly Open): 71.85
Scenario 1: Exhausted Buyers, Mean Reversion
In this scenario, we anticipate range-bound price action, offering a potential short opportunity if buyers appear exhausted. Price action and volume analysis would need to confirm this. Look for absorption around the neutral zone or below R1/CVAH, with prices failing to push higher. A lower high and seller dominance would confirm a mean reversion short setup.
Scenario 2: Breakout Above CVAH
A confirmed breakout above CVAH could indicate further bullish price discovery and the potential for a new uptrend. Consolidation above CVAH followed by strong price action would provide a trigger for long positions. However, significant resistance at this level necessitates confirmation via price action and volume analysis before taking action.
Scenario 3: Swing Failure at CVAH
In this scenario, prices rise above the neutral zone and R1/CVAH, but sellers regain control, pushing prices lower. A swing failure candle with a long wick near the resistance zone would indicate the failure. A subsequent higher low could present a short opportunity for a mean reversion trade.
We encourage you to monitor these levels closely and incorporate them into your trade planning. Share your thoughts or insights on these key levels in the comments below.

Light Crude Oil Futures Short Setup and potential Long
Expecting some sideways before a move up into the 78.50 region and a pull back to the levels shown .
Aside from the confluences I have documented , this plan also correlates well with my USD outlook .
I will wait for the short and have alerts set but there is also a long from around 75.20ish if you wanted to take the move up beforehand.
Of course this analysis could easily change so manage your risk accordingly with your trading plan .
Support my work with a Like and Follow for future Analysis.

Special Report: Celebrating 40 Years of Crude Oil FuturesNYMEX: WTI Crude Oil ( NYMEX:CL1! )
On March 30, 1983, New York Mercantile Exchange (NYMEX) launched futures contract on WTI crude oil. This marked the beginning of an era of energy futures.
WTI is now the most liquid commodity futures contract in the world. It’s 1.7 million daily volume is equivalent to 1.7 billion barrels of crude oil and $125 billion in notional value. For comparison, global oil production was 89.9 million barrels per day in 2021.
Looking back at 1983, exactly 40 years ago:
• NYMEX was primarily a marketplace for agricultural commodities, with Maine Potato Futures being its biggest contract;
• NYMEX was a small Exchange with 816 members, mainly local traders and brokers;
• Known as Black Gold, crude oil was a strategic commodity regulated by governments and monopolized by the Big Oil, the so-called “Seven Sisters”;
• Pricing of crude oil was not a function of free market but controlled by the Organization of Petroleum Export Countries (OPEC), an oil cartel.
The birth of crude oil futures contract was a remarkable story of financial innovation and great vision. Facing a “Mission Impossible”, NYMEX successfully pulled it off. At the helm of the century-old Exchange was Michel Marks, its 33-year-old Chairman, and John E. Treat, the 37-year-old NYMEX President.
The “Accidental Chairman”
Michel Marks came from a long-time NYMEX member family. His father, Francis Q. Marks, was a trading pit icon and influential member. Since high school, the younger Marks worked as a runner on the trading pit for his family business. After receiving an Economics degree from Princeton University, Michel Marks returned to NYMEX as a full-time member, trading platinum and potatoes.
In 1977, the entire NYMEX board of directors resigned, taking responsibility for the Potato Futures default from the prior year. Michel Marks was elected Vice Chairman of the new Board. He was 27 years old.
One year later, the Chairman at the time suffered a stroke. Michel Marks replaced him as the new NYMEX Chairman. At 28, he’s the youngest leader of any Exchange in the 175-year history of modern futures industry.
White House Energy Advisor
John E. Treat served in the US Navy in the Middle East and later worked as an international affairs consultant in the region. He received an Economics degree in Princeton and a master’s degree in international relations from John Hopkins.
During the Carter Administration (1977-1981), Treat worked at the US Department of Energy. He served as Deputy Assistant Secretary for International Affairs and sat on the National Security Council and the Federal Energy Administration. In his capacity, Treat was at the center of the formation of US energy policy.
After President Carter lost his reelection bid, Treat left Washington in 1981. At the time, NYMEX was exploring new contracts outside of agricultural commodities. One possible direction was the energy sector, where NYMEX previously listed a Heating Oil contract with little traction in the market. With his strong background, Treat was recruited by NYMEX as a senior vice president.
A year later, after then President Richard Leone resigned, Treat was nominated by Chairman Marks to become NYMEX President. He was 36 years old.
The Birth of WTI Crude Oil Futures
In 1979, the Islamic Revolution in Iran overthrew the Pahlavi dynasty and established the Islamic Republic of Iran, led by Shiite spiritual leader Ayatollah Khomeini.
Shortly after, the Iran-Iraq War broke out. Daily production of crude oil fell sharply, and the price of crude oil rose from $14 to $35 per barrel. This event was known as the second oil crisis. It triggered a global economic recession, with U.S. GDP falling by 3 percent.
After President Reagan took office in 1981, he introduced a series of new policies, known as Reaganomics, to boost the U.S. economy. The four pillars that represent Reaganomics were reducing the growth of government spending, reducing federal income taxes and capital gains taxes, reducing government regulation, and tightening the money supply to reduce inflation.
In terms of energy policy, the Reagan administration relaxed government regulations on domestic oil and gas exploration and relaxed the price of natural gas.
NYMEX President John Treat sensed that the time was ripe for energy futures. He formed an Advisory Committee to conduct a feasibility study on the listing of crude oil futures. His strategic initiative received the backing of Chairman Michel Marks, who in turn gathered the support of the full NYMEX membership.
Arnold Safir, an economist on the advisory board, led the contract design of WTI crude oil futures. The underlying commodity is West Texas Intermediate produced in Cushing, Oklahoma. The delivery location was chosen for the convenience of domestic oil refineries. WTI oil contains fewer impurities, which results in lower processing costs. US refineries prefer to use WTI over the heavier Gulf oil.
WTI trading code is CL, the abbreviation of Crude Light. Contract size is 1,000 barrels of crude oil. At $73/barrel, each contract is worth $73,000. Due to the profound impact of crude oil on world economy, NYMEX lists contracts covering a nine-year period.
On March 29, 1983, the CFTC approved NYMEX's application. The next day, WTI crude oil futures traded on the NYMEX floor for the first time.
Competing for the Pricing Power
Now that crude oil futures were listed. Initially, only NYMEX members and speculators were trading the contracts. All the oil industry giants sat on the sidelines.
John Treat knew that without their participation, the futures market could not have meaningful impact on the oil market, not to mention a pricing power over crude oil.
In early 1980s, the global oil market was monopolized by seven Western oil companies, known as the "Seven Sisters". Together, they control nearly one-third of global oil and gas production and more than one-third of oil and gas reserves.
1) Standard Oil of New Jersey, later became Exxon;
2) Standard Oil of New York, later became Mobil Oil Company; It merged with Exxon in 1998 to form ExxonMobil;
3) Standard Oil of California, later became Chevron; It took over Texaco in 2001, and the combined company is still named Chevron;
4) Texaco, collapsed in 2001 and was taken over by Chevron;
5) Gulf Oil, which was acquired by Chevron in 1984;
6) British Persian Oil Company, operating in Iran, withdrew after the Iranian Revolution and then fully operated the North Sea oil fields, later British Petroleum ("BP");
7) Shell, an Anglo-Dutch joint venture.
Treat's background as President Carter's energy adviser played a key role. After nearly a year of hard work, the first Big Oil entered the NYMEX crude oil trading floor. However, it was not until five years later that all Seven Sisters became NYMEX members.
OPEC producers tried to boycott the crude oil futures market. However, as trading volume grew, they eventually gave in, first by Venezuela and then the oil producers in the Middle East.
Interestingly, the Middle Eastern oil producers started out by trading COMEX gold futures, probably as a hedge against oil prices. Gold has been a significant part in the Middle Eastern culture for long. As the main buyers of gold, the Arabs buy more gold when their pockets are filled with rising oil prices, and conversely, they sell gold when oil revenues fall and their ability to buy gold decreases.
With the participation of Big Oil and OPEC, coupled with an active crude oil options market, crude oil pricing power has shifted from the Middle East to NYMEX's trading floor by the end of the 1980s. WTI has also become a globally recognized benchmark for crude oil prices.
Happy Trading.
Disclaimers
*Trade ideas cited above are for illustration only, as an integral part of a case study to demonstrate the fundamental concepts in risk management under the market scenarios being discussed. They shall not be construed as investment recommendations or advice. Nor are they used to promote any specific products, or services.
CME Real-time Market Data help identify trading set-ups and express my market views. If you have futures in your trading portfolio, you can check out on CME Group data plans available that suit your trading needs www.tradingview.com

NYMEX CRUDETechnical bear flag on $CL. MACD looking to cross and I suspect a retrace and consolidation within the 80.76 to 80.33 support zone until it rejoins the short term trend.
Omicron affect being not a severe and economies starting to return to normal will drive the increase in oil consumption.
I suspect it will go higher. Open interest in WTI100 calls have increased significantly and paired with other macro factors I think this trade is high probability to return to the up trend after retrace.
I wait for the confirmed break down to make a decision.
Not investment advice, I am currently neutral and waiting for the trade

NYMEX LIGHT CRUDE FUTURE MAY FALL IN APRILThe chart give you all details of ELLIOT wave count for NYMEX light sweet crude futures.
I noticed that his commodity recovered in 'V' shape from ABYSS(3rd of3of wave5) and erased all its losses to $60
But this recovery has one more test for final wave C5v, I assume that this will finish nextmonth (april)for 0.618 times of c5i at $46
comments are welcome

Nymex Futures Long CL1!Wait for the pullback down to the orange box for a long entry
The support shown has confluence with the 100EMA, .618 Fib pull
from the last swing high and the bottom of a respected channel .
Expecting a bounce in the area shown but please be aware of
the numbers due today and tommorow .
The American petroleum Institute on crude oil stock levels
as well as official numbers from the Department of energy on the 17March.
Set a Alert for this trade and watch how the market reacts to the data with a solid plan .
Show your support with a Like and a Follow .

crude oil directioncurrently in 15m noted strong bullish but the look like the trend about to settled
can try to enter at 40.95 cut loss at 41.10 with a target price at 40.65 for short term


Nymex Crude Weekly ChartWTI Nymex Crude Weekly Chart
WTI is forming a classical Pitch-fork pattern on Weekly chart.
At present the commodity is trading near to Pitch-fork support zone.
Risk reward is favorable on long side.
For educational purpose.

#USOIL China is reacting and the Trade War isn't good Risk appetite reverses on trade escalation, again TRADE WAR ESCALATION , not because of the FED and its interest rates. However, we "the old traders" are keen on Jackson Hole speech. Now, just keep in mind the consumer sector is the hero of the U.S economy but with trade war in front of us, prices will rise and finally impact the consumer sector. What does it mean for the USOIL? Tough time to push it lower, even to go around $50 per barrel but not for so long. So, what about a rally? I'd be a tough buyer around <$49/48.
Learn how to beat the market as Professional Trader with a Prop Trader!
Last 5 seats. Be part of an Elite Trading Group.
Have a Nice Trading Week!
Cream Live Trading, Best Regards!

Crude oil price rally looks stalling on chartsCrude oil price rally looks exhausting on 4 hourly charts but selling not suggested need to buy on dips.
As multiple on higher time frame commodity still have space to move till $50.

NYMEX CrudeABC Pattern with C exactly at 100% of A now. Also 5 of C is near 61.8% (since 3 is extended, 5 cannot be extended hence closer to top).

NYMEX CRUDE OIL, Target HitsIf you have been following me, I posted a chart for crude oil few weeks back for a shot position and it has been doing exactly
the same after i posted that chart. It has been turning out even better than i anticipated and quicker for that matter.
We can see further down fall till 61/60 targets at least, where I would suggest to exit your positions.
I will soon re evaluate my strategy after it hits those targets as it has been volatile for all commodities and other asset classes
in general. But for now the chart/commodity is doing what was expected after a huge surge in the commodity since the last few months.

CRUDE OIL (NYMEX)B&B Pattern. Trade setup with Stop Buy position (EP) at 63.50, Stop Loss (SL) at 62.50 and Take Profit (TP) at 64.30
Money Management
I have 17,000 USD in my portfolio. I can lose 10% of the port which is 1700 USD.
Position Sizing
1 Tick = $1000
1 Contract size need IM = $2,310 (I can open not more than $17,000 / $2,310 = 7.35 Cons)
It is 1 Tick from EP to SL, with 1 Con, I will lose 1 * $1000 = $1,000
To lose 1,700 USD I need to open 1,700 / 1,000 = 1.7 Con
Then I will put 1 Contract
