Insiders are selling Roblox ! Heres the levels you need to knowIn this video I lay out a solid plan for a move to the downside for Roblox after a 100% move to the upside since April of this year .
I demonstrate why I believe we will take a 30% retracement and provide confluent evidence to support this theory.
There are some fundamental reasons that I also did include alongside the technical analysis which is not my regular style but important given the context.
Tools used in the video 0.382 Fib , Standard Fib pull, Trend based fib and pivots .
Nyse

Daily Orderflow on ES and NQ. 01.08.2025, NFP FridayCME_MINI:NQ1! CME_MINI:ES1!
Orderflow explanation. Sessional delivery and New York Price action

Reddit breaks out for bullish run I have been watching Reddit for a couple of weeks and identified that we had put in the .786 low from the correction since February and then formed a range that was well respected for the past 4 months .
In this video I highlight zones where i expect price to gravitate too and where a nice entry will be if you are looking to long reddit.
Tools used Fib suite , trend based fib , tr pocket , 0.786 + 0.382 and fixed range .

New targets for Reddit RDDT In this video I recap the previous reddit analysis where we looked for the long which is playing out really well .
I also look at the current price action and simulate what I think could be a target for the stock moving forward using Fib expansion tools as well as levels below for price to draw back too.
Welcome any questions below the chart . Thanks for viewing

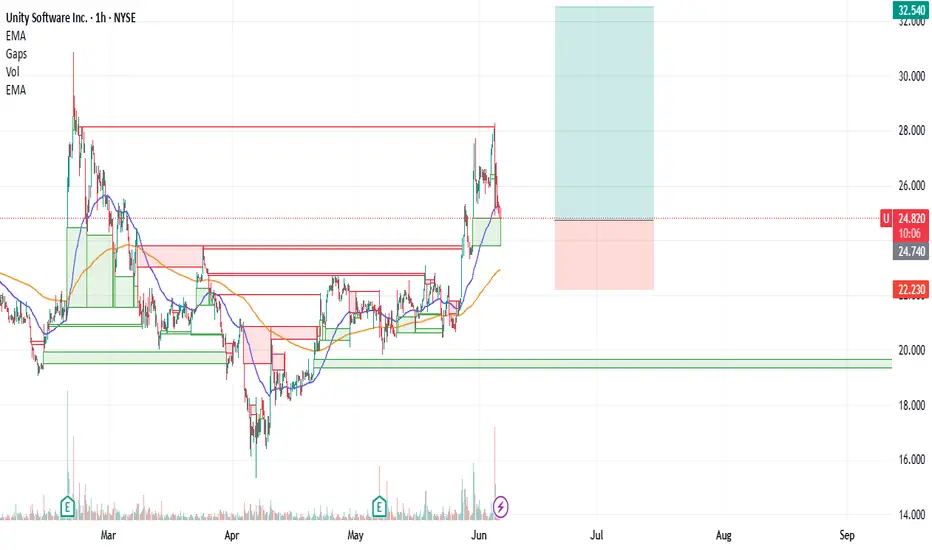
U : Long There were both good and bad developments for Unity.
While the joint project opportunity with BMW Group is very positive news,
Departure of the current CEO was negative news.
Technically, it is above the 50 and 200 period moving averages, and the 50 period ema is also above the 200 period ema.
A risk/reward ratio of 3.00 can be evaluated, with the Stop-Loss being close to the 200-period ema and the target price being targeted at the large gap closing value.(Small position size)
Entry : 24.76 - 24.81
Risk/Reward Ratio : 3.00
Stop-Loss : 22.23
Take Profit Level: 32.54
UNH : Are Bad Days Over ? (Cautious)UNH shares have moved above the 50-period moving average but are trading below the 200-period moving average.
For now, since the 200-period moving average is very high, a small trade can be tried by keeping the stop-loss level a little tight.
A few weak movements may pull the average down and the price may break the average.
Therefore, small position sizes are ideal.
NOTE : If we can maintain persistence on 376(Which will take a few days),
then we will look at the other gaps.
Risk/Reward Ratio : 2.39
Stop-Loss : 274.99
Take- Profit Level : 376.38
Regards.

Visa: Waiting in the Wings Visa has entered a phase of sideways consolidation — but this does not affect our primary scenario. We continue to see the stock moving within magenta wave , which is expected to complete the larger turquoise wave 4 inside our turquoise Target Zone between $308.09 and $292.19. After that, we anticipate a renewed upward impulse. Turquoise wave 5 should then push the stock beyond the resistance levels at $375.51 and $394.49. Meanwhile, we are keeping two alternatives on our radar. The first has a 35% probability and assumes the correction is already over, meaning turquoise wave alt.4 is complete. The second is a more bearish scenario (32% probability) visible on the daily chart. It suggests that the high of green wave alt. may already be in, which would imply that the ongoing alt. wave is headed toward a lower low below the $234.30 support level.
📈 Over 190 precise analyses, clear entry points, and defined Target Zones - that's what we do (for more: look to the right).

TESLA 400 BY END OF YEAR !! 5 REASONS !!!
1. **Strong Earnings and Revenue Growth**
Tesla has a track record of exceeding earnings expectations. If the company reports robust financial results in Q3 and Q4—driven by higher vehicle deliveries and growth in its energy storage business—investors are likely to gain confidence. This could push the stock price upward as Tesla demonstrates its ability to scale profitably.
2. **Advancements in Autonomous Driving**
Tesla’s Full Self-Driving (FSD) technology is a game-changer in the making. If Tesla achieves significant progress toward Level 4 or 5 autonomy—where vehicles can operate with little to no human intervention—it could position the company as a leader in transportation innovation. Such a breakthrough would likely excite investors and drive the stock price higher.
3. **Battery Technology Innovation**
Tesla is working on developing cheaper, longer-lasting batteries, which could lower production costs and improve profit margins. If the company announces advancements in battery tech—such as improvements from its Battery Day initiatives or new manufacturing processes—it could signal a competitive edge, boosting the stock to $400.
4. **Global Expansion and Production Increases**
Tesla’s new Gigafactories in Texas and Berlin are ramping up production, while potential market entries like India loom on the horizon. Increased output and access to new customers signal strong growth potential. If Tesla successfully scales its operations, investors may see this as a reason to push the stock price toward $400.
5. **Favorable Market Trends and Government Policies**
The global shift toward sustainable energy and electric vehicles (EVs) is accelerating, supported by government incentives and regulations favoring clean energy. If EV adoption continues to rise and policies provide a tailwind—such as subsidies or stricter emissions standards—Tesla, as an EV leader, could see increased demand and a higher stock valuation.
While reaching $400 by year-end is ambitious, Tesla’s strong brand, innovative edge, and leadership under Elon Musk could make it achievable. That said, risks like market volatility and growing competition from other EV makers could pose challenges. If these five factors align, however, Tesla’s stock has a solid shot at hitting that target.

Daily Market Outlook. 16.07.2025, CPI dayGold Short and NQ order flow explained. Along with the Dollar Index

NSE IONQ - Are we ready for a breakout?The corrective phase is complete and an impulse move appears likely. A strong buy above the A-B-C channel could target levels around 30 - 37 - 45 or higher. Good entry is possible above 26. However, if conditions worsen, further corrections may ensue.
I will update further information soon.

My buy view for Hims & Hers stock. My buy view for Hims & Hers stock.
Overall, I believe this asset is still in a bullish direction. I remember hoping into accummulating this stock when it dropped from $64 to $41 at the open of market on 23/6/2025 which I sold off when it hit $50.
However, I still hold a strong buy bias with my entry and exit showing on my chart (analysis).
Please trade with care as I still look forward to $64 per share for this stock long-term.
Please, kindly like, share your thoughts via comment and follow me for more.

Analysis on circle using tpo and regular chart longs and shortMust watch video giving 2 really nice Risk reward entries on the Newley listed stock Circle
In this video I highlight a region using limited data of where to get filled if you missed the IPO and want to buy some circle .
We are currently in a no trade zone for buyers as I anticipate that price will gravitate down to the .786/.886 level over time .
In this video I also use the TPO chart "Time price opportunity" and demonstrate what i am looking for from using this type of chart to add to my confluences for a high probability trade .
Also identified in the chart is a short trade off of the weekly pivots and the value area high of the range .
Thankyou for watching and i welcome any questions


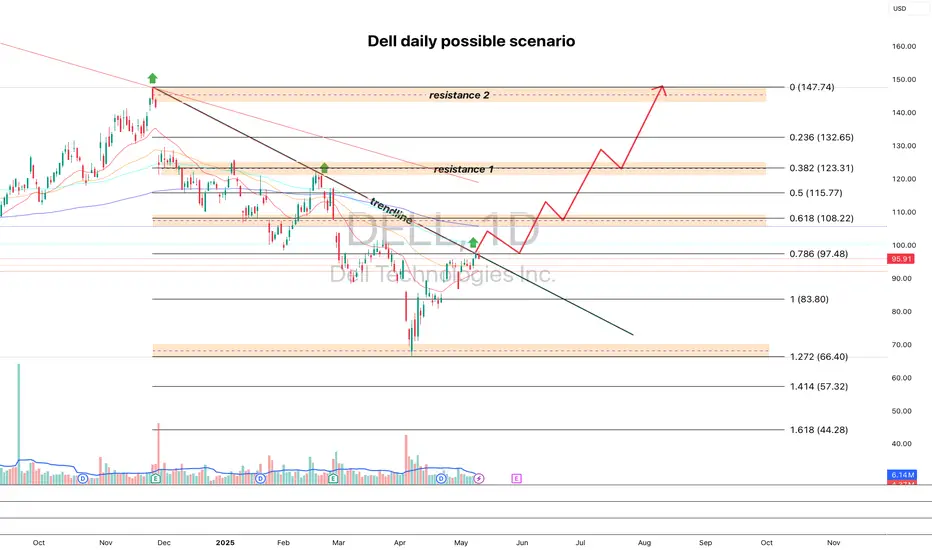
DELL looks good for pump dailyI'm watching DELL for a breakout of the trendline and a cross above the 100 MA — targeting a move toward 108.22, followed by a retest of the breakout and further upside targets at 123.31 and 147.74.
Fundamentally, the company looks strong, and the next earnings report is expected on May 29.
If you like the analysis, hit that rocket 🚀
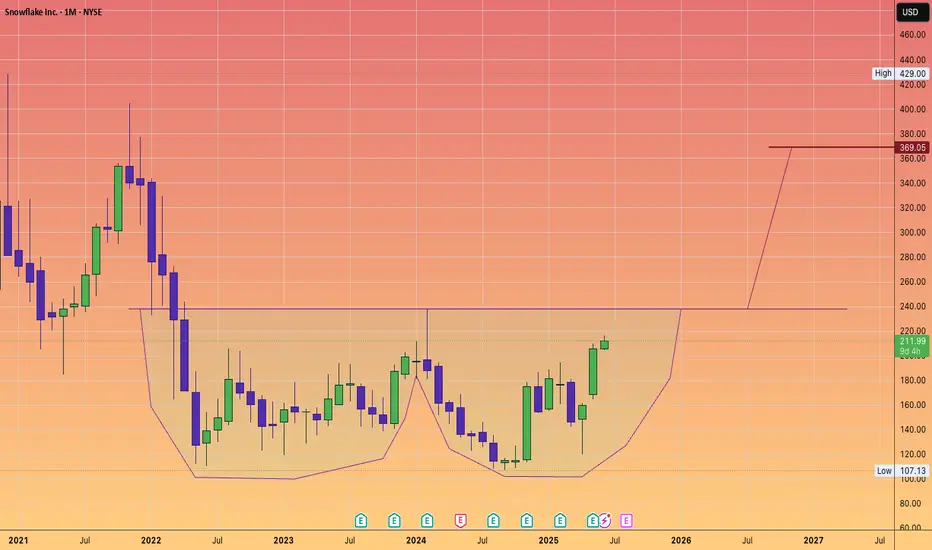
SNOWFLAKE to $369Snowflake Inc. is an American cloud-based data storage company.
Headquartered in Bozeman, Montana, it operates a platform that allows for data analysis and simultaneous access of data sets with minimal latency. It operates on Amazon Web Services, Microsoft Azure, and Google Cloud Platform.
As of November 2024, the company had 10,618 customers, including more than 800 members of the Forbes Global 2000, and processed 4.2 billion daily queries across its platform
#DoubleBottom
#Wformation
My buy view for BlackBerryMy buy view for BlackBerry.
This stock has pushed up about 60% following the draw down from the US tariff.
I am still bullish on this stock.
My buy thoughts are on the chart

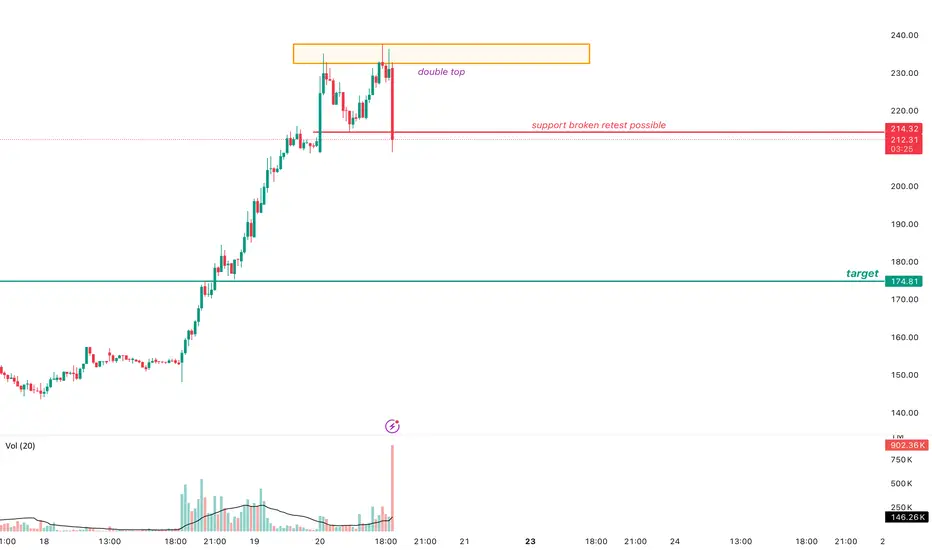
CRCL LOOKS OVERBOUGHTAs you can see after a good ride from 102 to 234 now the stock looks overbought. and on shorter time frames the price action shows a classic pattern of double top and breaking the previous support. simply if the stock closes 15 m candle below the support you might see a short retest to the support from downside that is a good point to short.

Supply and Demand Flips. No bias needed. Gold Covering the supply and demand flips on Gold. how to trade without a bias. If the sole goal is to make money then you can trade this. I will make another part 2.

Nikkei 225. Tokyo Open Delivery cause of Geopolitical DriversSharing my Tokyo Open model for the daily expansion on Nikkei. Along with Intraday market profiles. And Quarterly Theory

GE Vernova Inc. (GEV) – Powering the Global Energy TransitionCompany Overview:
GE Vernova NYSE:GEV is becoming a cornerstone of the global clean energy shift, providing advanced power generation, transmission, and renewable energy technologies that are now mission-critical for national energy strategies.
Key Catalysts:
Explosive Electrification Growth ⚡
Grid Solutions backlog tripled YoY, driven by demand for modern, resilient, and clean grids.
HVDC & FACTS technologies place GEV at the forefront of a global multi-decade grid overhaul.
Recurring Revenue from Wind Repowering 🌬️
1 GW of upgraded capacity in 2024 under the Repower program.
GEV operates the most widely installed wind platform in the U.S., giving it dominance in the high-margin retrofit market.
Strategic Manufacturing Expansion 🏭
$600M+ in investments across Florida and India expand capacity and de-risk the supply chain.
Supports global demand from infrastructure stimulus and decarbonization mandates.
Investment Outlook:
Bullish Case: We are bullish on GEV above $410.00–$415.00, as clean energy investment accelerates.
Upside Potential: Price target of $600.00–$610.00, backed by order momentum, retrofit leadership, and global energy reform.
🔋 GE Vernova – Electrifying the Future. #GEV #CleanEnergy #GridModernization #WindPower

ORACLE break All Time HighORACLE break All Time High
This stock has had a big move up after the sharp drop of the month of April this year.
This stock broke above ATH yesterday.
Is this a sustainable push-up?
Share your thought

California Resources Corporation (CRC) – Stock Analysis and ForeCalifornia Resources Corporation, a key player in crude oil production and carbon management, has recently experienced a notable uptick in investor interest.
This momentum appears to be supported by macroeconomic tailwinds, including renewed trade tensions between the United States and other major economies.
Historically, geopolitical uncertainty often leads to increased energy demand and price volatility, both of which tend to benefit domestic oil producers like CRC.
From a fundamental standpoint, investor sentiment toward CRC has grown increasingly positive. The company’s strategic positioning in California's energy transition—particularly its focus on carbon capture and storage (CCS)—is beginning to resonate more with institutional investors looking to align portfolios with sustainable yet profitable energy operations.
If these supportive fundamentals continue, there is potential for the stock to reach $56 in the coming months, assuming no major changes to current market dynamics or geopolitical influences.
Technical Outlook:
Entry Point: $44.68
Stop Loss: $42.73
Take Profit 1: $50.84
Take Profit 2: $55.88
As always, trade with care, apply proper risk management, and ensure your positions align with your overall investment strategy.
If you find this helpful, kindly follow me, subscribe, like, comment and share.
