Was this the best buying opportunity since 2011?Sure, here's a rewritten version of your text in an engaging tone:
"Have you ever heard of the Zweig Breadth Thrust? Well, let me tell you, it’s an incredible metric that can really shed some light on the current market situation!
So, what would it take for me to believe that this bounce isn't just another bear market rally? My first step would be to dive into the breadth indicators and look for signs of that elusive breadth thrust.
Think of a breadth thrust like a rocket taking off. You need a strong initial boost to break free of gravity's grip. If the thrust is weak, the rocket can’t escape, and the same applies to stock market reversals. When we see a robust breadth thrust, that's a signal that a significant reversal is underway. Without it, we could be facing another false bounce.
Now, let’s talk numbers! As of Friday, April 25th, the SPX has surged an impressive 14.2% from its recent lows, and while that’s quite a leap, it’s essential to keep it in perspective. Just think back—this index was down 21.35% from its all-time high earlier in February during the panic sell-off. Now, with the recent strength, it’s only 10.75% off its peak.
The Zweig Breadth Thrust is calculated based on the 10-day EMA of NYSE Advances divided by the sum of Advances and Declines. A bullish signal pops up when the ZBT shifts from below 0.40 to above 0.615 within just ten days or less. Keep an eye on that—it might just help us navigate these choppy waters!"
On the monthly chart, it’s clear that what we’ve been seeing in the broader economy (you know, Main Street) is actually showing us some bearish divergence—a concept I've mentioned in my previous ideas.
Since 2009, we've had four notable instances on the Monthly chart where the ZBT dipped below 0.40, only to bounce back up past the 0.6 mark. Remember back in November 2011? That was when we got a significant signal with a low reading of 0.31, which climbed back to 0.62 by February 2013. That surge sparked a bull run that peaked in February 2020!
So, the takeaway here is that this breadth thrust is generating the positive momentum we need to reach new stock market highs this year. Exciting times ahead!
Nyse

GOLD weekly outlook Part 1
COMEX:GC1!
Weekly Power of Three. Explained the overall price action how it moved why it moved. Different timings involved for the displacement

WYThe current price is near a type of support base being created possibly. Earnings just happened recently and seems like there were mixed results. Won't get too much into that. However, if you look at the "throw up" emojis, price dropped sharply and price started trading sideways before bulls came back into the market. Let's see if we can get some momentum into this potential move eventually. Bearish volume has dropped since that sharp drop and with price trading sideways while also creating a base of support of some sort, I would like to see price reach the target zone located on the chart. Since September of 2022, price has infiltrated this zone about 4-5 times. Could we get a repeat of recent history?

ServiceNow Surges 15%+ on Strong Earnings and Analyst UpgradesServiceNow (NYSE: NOW) soared 15.2% to $934.16 by late morning Thursday after releasing strong Q1 2025 results. At the same time, the S&P 500 gained 1.2% and the Nasdaq Composite rose 1.7%. The company posted adjusted earnings per share of $4.04, outperforming analysts’ forecast of $3.83. Revenue came in at $3.09 billion, meeting consensus expectations and surpassing ServiceNow’s internal guidance.
The software firm recorded a 19% year-over-year increase in revenue, mainly driven by growth in subscription sales. This segment contributed $3 billion, reflecting continued customer demand for cloud-based workflow automation services. ServiceNow also raised its full-year performance targets, signaling confidence in sustained growth throughout 2025.
The stock has rebounded sharply after recent market weakness. Its current price of $934.16 reflects renewed investor confidence as the company continues to deliver steady top- and bottom-line expansion. Volume during the session reached 7.31 million shares, well above average.
Technical Analysis
Technically, NYSE:NOW bounced from the support zone around $700, aligned with the 200-day moving average of $707.13. ServiceNow respected this level and reclaimed its 100-day ($865.17) moving average. A steep ascending trendline confirms long-term bullish momentum and support since late 2022.
The surge suggests a possible retest of the previous all-time high at $1,198.09. Price action may consolidate around the $1,000 psychological mark before advancing. Volume spikes during the rally indicate strong buying interest.
The technical setup signals a continuation of the uptrend, with bulls targeting a return to historical highs. As long as the price stays above trendline support, the horizontal support, and key moving averages, the uptrend remains intact.

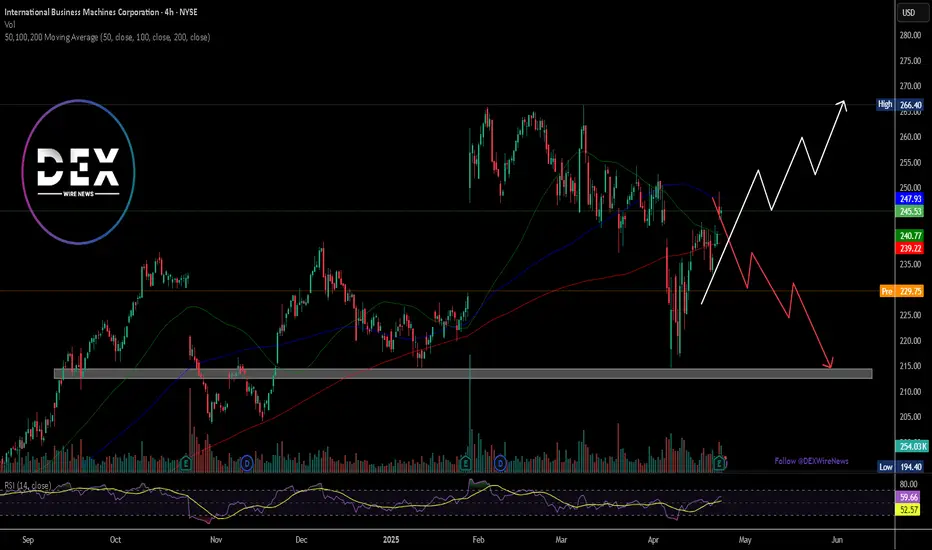
Breaking: International Business Machine (NYSE: $IBM) Tanks 6% International Business Machine Corporation, (NYSE: NYSE:IBM ) together with its subsidiaries, provides integrated solutions and services in the United States, Europe, the Middle East, Africa, Asia Pacific, and internationally Plummets 6% in early premarket trading on Thursday albeit reporting better-than-expected earnings and revenue for the first quarter on Wednesday.
Earnings Overview
a. Earnings per share: $1.60 adjusted vs. $1.40 expected
b. Revenue: $14.54 billion vs. $14.4 billion expected
Revenue increased 0.6% in the quarter from $14.5 billion a year earlier, according to a statement. Net income slid to $1.06 billion, or $1.12 per share, from $1.61 billion, or $1.72 per share, in the same quarter a year ago.
For 2025, IBM reiterated its expectation for $13.5 billion in free cash flow and at least 5% revenue growth at constant currency. At current exchange rates, currency will provide 150 basis points of benefit for 2025 growth, down from the company’s forecast of 200 basis points in January.
IBM has been an outperformer this year as the broader market has sold off due largely to concerns around President Donald Trump’s tariffs and their potential impact on the economy. As of Wednesday’s close, IBM shares were up 11%, while the Nasdaq was down almost 14%.
The stock slipped 6% in extended trading on Wednesday, extending the loss to Thursday's premarket session. NYSE:IBM shares need to break pass the $266 resistant to negate any bearish barriers. Failure to break pass this level could resort to consolidatory move to the $216 support point.
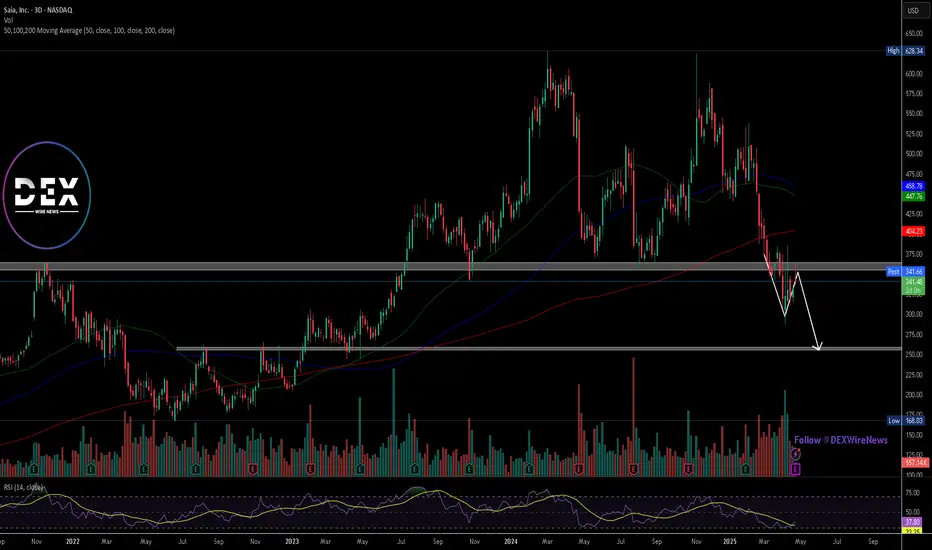
Upcoming Saia Earnings Announcement Draws Investor Attention Saia Inc. (NASDAQ:SAIA) is expected to release its first-quarter earnings soon, drawing investor attention amid recent downward revisions in analyst estimates. Wall Street forecasts earnings of $2.77 per share, marking an 18.1% decline from the same quarter last year. Revenue is projected to increase by 7.3% year-over-year to $810.08 million.
Over the past month, consensus EPS estimates have been revised down by 7.6%, reflecting a shift in analyst sentiment. These estimate changes are often used as signals to predict short-term stock movement.
Beyond the top and bottom lines, analysts have modeled key metrics to provide deeper insight into the company's performance. The operating ratio, a critical efficiency indicator in the transportation sector, is projected to rise to 87.6% from 84.4% a year earlier. A higher ratio suggests an increase in operating costs relative to revenue.
Analysts also expect Saia’s Less-Than-Truckload (LTL) revenue per hundredweight to drop to $24.75 from last year’s $26.51, signaling potential pricing pressure. Saia stock has declined 14.4% over the past month, underperforming the S&P 500’s 8.9% drop. The stock currently holds a Zacks Rank #3 (Hold), suggesting performance in line with the broader market.
Technical Analysis
Saia’s share price has broken below a key support level at $360, continuing a bearish trend. The next support lies near $258. All major moving averages are above the current price and sloping downward—50-day at $447, 100-day at $458, and 200-day at $404—confirming the downward momentum.
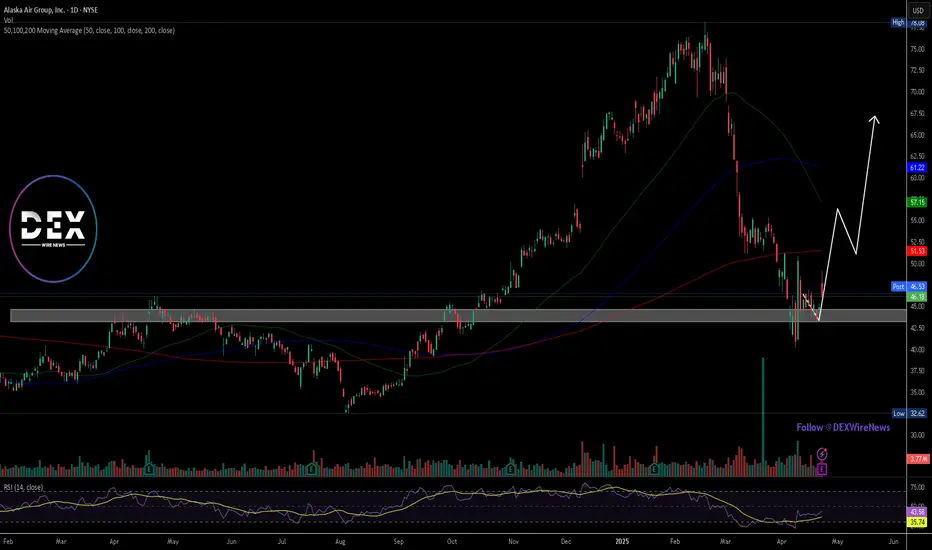
Analysts Revise Alaska Air Group Forecasts Ahead of EarningsAlaska Air Group Inc. (NYSE:ALK) is scheduled to report its first-quarter earnings results after markets close on Wednesday, April 23. Analysts expect the airline to post a loss of $0.77 per share. This compares to a loss of $0.92 per share during the same period last year. Revenue is projected to come in at $3.16 billion, up from $2.23 billion a year earlier, according to Benzinga Pro.
The company last reported earnings on January 22, posting better-than-expected results for both revenue and earnings per share. As anticipation builds for the upcoming earnings call, several top analysts have adjusted their outlooks.
Barclays analyst Brandon Oglenski maintained an "Overweight" rating on April 8 but lowered the price target from $80 to $62. Susquehanna’s Christopher Stathoulopoulos, with a 74% accuracy rate, kept a "Positive" rating but cut the price target from $95 to $55 on April 7. UBS's Thomas Wadewitz downgraded the stock to "Neutral" from "Buy" and dropped the target from $75 to $54.
On March 18, Citigroup analyst Stephen Trent reaffirmed a "Buy" rating and slightly trimmed the price target from $83 to $81. JP Morgan’s Jamie Baker raised the target from $85 to $89 while maintaining an "Overweight" rating on March 3. On Tuesday, Alaska Air shares rose 2.93% to close at $44.94.
Technical Analysis
The stock found support near the $44 level, forming a potential base. If this support holds, ALK may target the $50 range or higher. However, a break below support could push the price down toward $40. All major moving averages are trending lower. The 50-day, 100-day, and 200-day moving averages stand at $57, $61, and $51, respectively, signaling ongoing bearish momentum.
Global Payments Inc. Hits 52-Week Low Amid Analysts DowngradeGlobal Payments Inc. (NYSE:GPN) dropped to a new 52-week low of $66.90 on Monday after Wells Fargo slashed its price target from $105.00 to $77.00. The firm issued an "equal weight" rating. Shares last traded at $67.22, down from the prior close of $69.46, with over 1.25 million shares changing hands.
Several other analysts also revised their targets. Barclays reduced its price from $125.00 to $110.00 and maintained an "overweight" rating. Citigroup cut its target slightly from $138.00 to $135.00 while retaining a “buy” recommendation. Morgan Stanley followed suit with a target cut from $166.00 to $163.00 and kept an “overweight” stance.
Evercore ISI began coverage with an “in-line” rating and set its target at $85.00. Meanwhile, Robert W. Baird lowered its price objective significantly from $145.00 to $100.00 while keeping an “outperform” rating.
MarketBeat data shows that 15 analysts currently rate the stock as a hold. Eleven analysts recommend buying, and one has issued a sell rating. The average consensus price target now stands at $117.36.
Technical Analysis
The daily chart highlights a sharp sell-off with high volume in April, pushing GPN below critical support. The price failed to hold the $92 level, breaking down with a gap and falling into oversold territory. Moving averages point to downward momentum. The 50-day, 100-day, and 200-day moving averages all hover above the current price.
RSI currently sits at 32.27, close to the oversold threshold. A minor bounce has occurred from the low, but resistance near $92 could cap gains. If selling pressure resumes, the price may revisit $66 or break lower towards $60.

What Is the McClellan Oscillator (NYMO), and How to Use ItWhat Is the McClellan Oscillator (NYMO), and How to Use It in Trading?
The McClellan Oscillator is a widely used market breadth indicator that helps traders analyse momentum and market strength. It focuses on the relationship between advancing and declining stocks, offering unique insights beyond price movements. This article explains how the McClellan Oscillator works, its interpretation, and how it compares to other tools.
What Is the McClellan Oscillator?
The McClellan Oscillator is a market breadth indicator that traders use to measure momentum in stock market indices. It’s calculated based on the Advance/Decline Line, which tracks the net number of advancing stocks (those rising in price) minus declining stocks (those falling in price) over a given period.
The NYSE McClellan Oscillator is the most common variant, often called the NYMO indicator. However, it can also be applied to any other stock index, like the Dow Jones, Nasdaq, or FTSE 100.
Here’s how it works: the indicator uses two exponential moving averages (EMAs) of the advance/decline data—a 19-day EMA for short-term trends and a 39-day EMA for long-term trends. The difference between these two EMAs gives you the oscillator’s value. Positive readings mean more stocks are advancing than declining, pointing to bullish momentum. Negative readings suggest the opposite, with bearish sentiment dominating.
What makes the McClellan indicator particularly useful is its ability to highlight shifts in market momentum that might not be obvious from price movements alone. For example, even if a stock index is rising, a declining indicator could signal that fewer stocks are participating in the rally—a potential warning of weakening breadth.
This indicator is versatile and works well across various timeframes, but it’s particularly popular for analysing daily or weekly market trends. While it’s not designed to provide direct buy or sell signals, it helps traders identify when markets are gaining or losing momentum,
Understanding the Advance/Decline Line
The Advance/Decline (A/D) Line is a market breadth indicator that tracks the difference between the number of advancing stocks and declining stocks. It’s calculated cumulatively, adding each day’s net result to the previous total. This gives a running tally that reflects the broader participation of stocks in a market’s movement, rather than just focusing on a handful of large-cap stocks.
When the A/D Line shows consistent strength or weakness, the McClellan Oscillator amplifies this data, making it potentially easier to spot underlying trends in market breadth. In essence, the A/D Line provides the raw data, while the McClellan refines it into actionable insights.
How to Calculate the McClellan Oscillator
The McClellan Oscillator formula effectively smooths out the daily fluctuations in the A/D data, allowing traders to focus on broader shifts in momentum.
Here’s how it’s calculated:
- Calculate the 19-day EMA of the A/D line (short-term trend).
- Calculate the 39-day EMA of the A/D line (long-term trend).
- Subtract the 39-day EMA from the 19-day EMA. The result is the McClellan Oscillator’s value.
Giving the formula:
- McClellan Oscillator = 19-day EMA of A/D - 39-day EMA of A/D
The result is a line that fluctuates around a midpoint. In practice, a trader might apply the McClellan Oscillator to the S&P 500 on a daily or weekly timeframe, providing insights for trading.
Interpretation of the Oscillator’s Values
- Positive values occur when the 19-day EMA is above the 39-day EMA, indicating that advancing stocks dominate and the market has bullish momentum.
- Negative values occur when the 19-day EMA is below the 39-day EMA, reflecting a bearish trend with declining stocks in control.
- A value near zero suggests balance, where advancing and declining stocks are roughly equal.
Signals Generated
The indicator is popular for identifying shifts in momentum and potential trend changes.
Overbought and Oversold Conditions
- Readings at or above +100 typically indicate an overbought market, where the upward momentum may be overextended.
- Readings at or below -100 suggest an oversold market, with the potential for a recovery.
Crossing Zero
When the indicator crosses above or below zero, it can indicate shifts in market sentiment, with traders often monitoring these transitions closely.
Divergences
- A positive divergence occurs when the indicator rises while the index declines, signalling potential bullish momentum building.
- A negative divergence happens when the indicator falls while the index rises, hinting at weakening momentum.
Using the McClellan Oscillator With Other Indicators
The McClellan Oscillator is a valuable tool for analysing market breadth, but its insights become even more powerful when combined with other indicators. Pairing it with complementary tools can help traders confirm signals, refine their analysis, and better understand overall market conditions.
Relative Strength Index (RSI)
The Relative Strength Index (RSI) measures the strength and speed of price movements, identifying overbought or oversold conditions. While the McClellan Oscillator focuses on market breadth, using RSI along with it can provide confirmation. For example, if both indicators show overbought conditions, it strengthens the case for a potential market pullback.
Moving Averages
Simple or exponential moving averages of price data can help confirm trends identified by the McClellan Oscillator. For instance, if it signals bullish momentum and the index moves above its moving average, this alignment may suggest stronger market conditions.
Volume Indicators (e.g., On-Balance Volume)
Volume is a key component of market analysis. Combining the Oscillator with volume-based indicators can clarify whether breadth signals are supported by strong participation, improving the reliability of momentum shifts.
Bollinger Bands
Bollinger Bands measure volatility and provide insight into price ranges. When combined with the McClellan Oscillator, they can help traders assess whether market breadth signals align with overextended price movements, providing additional context.
VIX (Volatility Index)
The VIX measures market sentiment and fear. Cross-referencing it with the McClellan Oscillator can reveal whether market breadth momentum aligns with changes in risk appetite, offering a deeper understanding of sentiment shifts.
Comparing the McClellan Oscillator With Related Indicators
The McClellan Oscillator, McClellan Summation Index, and Advance/Decline Ratio all provide insights into market breadth, but they differ in focus and application.
McClellan Oscillator vs McClellan Summation Index
While the Oscillator measures short-term momentum using the difference between 19-day and 39-day EMAs of the Advance/Decline (A/D) Line, the McClellan Summation Index takes a longer-term perspective. It is a cumulative total of the Oscillator's daily values, creating a broader view of market trends.
Think of the Summation Index as the "big picture" complement to the Oscillator's granular analysis. Traders often use the Summation Index to track longer-term trends and identify major turning points, while the Oscillator is more popular when monitoring immediate momentum shifts and overbought/oversold conditions.
McClellan Oscillator vs Advance/Decline Ratio
The Advance/Decline Ratio is a simpler calculation, dividing the number of advancing stocks by the number of declining stocks. While it provides a snapshot of market breadth, it lacks the depth of analysis offered by the McClellan Oscillator.
The Oscillator refines raw A/D data with exponential moving averages, smoothing out noise and making it potentially easier to identify meaningful trends and divergences. The A/D Ratio, on the other hand, is more reactive and generally better suited for short-term intraday signals.
Advantages and Limitations of the McClellan Oscillator
The McClellan Oscillator is a powerful tool for analysing market breadth, but like any indicator, it has strengths and weaknesses. Understanding both can help traders decide how best to integrate it into their analysis.
Advantages
- Focus on Market Breadth: By analysing the Advance/Decline data, the indicator provides a clearer picture of how many stocks are participating in a trend, not just the performance of index heavyweights.
- Momentum Insights: Its ability to highlight shifts in short-term momentum allows traders to spot potential turning points before they become evident in price action.
- Identification of Divergences: It excels at identifying divergences between market breadth and price, offering early signals of weakening trends or upcoming reversals.
- Overbought/Oversold Signals: Its range helps traders analyse extreme conditions (+100/-100), which can signal potential market corrections or recoveries.
Limitations
- Not a Standalone Tool: The indicator is combined with other indicators or broader analysis, as it doesn’t provide specific entry or exit signals.
- False Signals in Volatile Markets: During periods of high volatility or low trading volume, the oscillator may generate misleading signals, making context crucial.
- Short-Term Focus: While excellent for momentum analysis, it doesn’t provide the long-term perspective offered by tools like the McClellan Summation Index.
The Bottom Line
The McClellan Oscillator is a powerful tool for analysing market breadth, helping traders gain insights into momentum and potential market shifts. While not a standalone solution, it is often combined with other indicators for a well-rounded approach.
FAQ
What Is a NYMO Oscillator?
The NYMO oscillator, short for the New York McClellan Oscillator, is a market breadth indicator based on the Advance/Decline stock data of the New York Stock Exchange (NYSE). The NYMO index calculates the difference between a 19-day and 39-day exponential moving average (EMA) of the Advance/Decline line, providing insights into stock market momentum and sentiment.
What Does the McClellan Oscillator Show?
The McClellan Oscillator shows the balance of advancing and declining stocks in a market. Positive values indicate bullish momentum, while negative values reflect bearish sentiment. It’s often used to identify potential shifts in momentum or divergences between market breadth and price.
What Is the McClellan Oscillator in MACD?
The McClellan Oscillator and MACD are distinct indicators, but both use moving averages. While MACD measures price momentum, the Oscillator focuses on market breadth by analysing the Advance/Decline Line.
What Is the McClellan Summation Indicator?
The McClellan Summation Index is a cumulative version of the McClellan Oscillator. It provides a broader view of market trends, tracking long-term momentum and overall market strength.
What Is the Nasdaq McClellan Oscillator?
The Nasdaq McClellan Oscillator, sometimes called the NAMO, applies the same calculation as the NYMO but uses Advance/Decline data from the Nasdaq exchange. It helps traders analyse momentum and breadth in technology-heavy markets.
This article represents the opinion of the Companies operating under the FXOpen brand only. It is not to be construed as an offer, solicitation, or recommendation with respect to products and services provided by the Companies operating under the FXOpen brand, nor is it to be considered financial advice.

Netflix is abouve breakout level of 959.24Netflix is above breakout level of 959.24 and is is near to break trendline too. May be it will cross 1000 and 1200 levels.
Note: This is not a buy sell call. Trade at your own will, Use stop loss too.

Arista Networks Raises 2025 Revenue Forecast to $8.2BArista Networks, Inc. (NYSE: NYSE:ANET ) has increased its 2025 revenue outlook to $8.2 billion, marking a 17% year-over-year growth rate. This revision is driven by robust demand from Tier 1 hyperscalers and Tier 2 cloud providers adopting Ethernet-based solutions. For Q1 2025, the company expects revenue between $1.93 billion and $1.97 billion, with a gross margin around 63% and operating margin of 44%.
Arista specializes in data-driven networking solutions for cloud, data center, campus, and routing infrastructures. Although it lagged in AI revenue growth initially, the company now benefits from broader AI and cloud integration. UBS has given the stock a Buy rating, targeting a price of $115. At market close on April 17, 2025, ANET traded at $71.20, reflecting a 0.93% decline for the day. Volume reached 8.57 million shares.
Meanwhile, market sentiment remains cautious due to new trade tariffs imposed by the Trump administration. These policies, particularly against Chinese imports, have disrupted global supply chains and triggered inflationary pressure. As a result, hedge funds reduced risk exposure ahead of the announcement. Market research from IDC warns that prolonged tariffs could impact the IT sector’s recovery and limit hardware availability.
Technical Analysis
On the 3-day chart, ANET has dropped below the key support-turned-resistance level around $77. The price currently sits around the 200-day moving average, acting as a crucial short-term support zone. The current 50-day moving average stands at $98.45, while the 100-day and 200-day moving averages are $87.99 and $65.96, respectively.
The chart outlines two possible scenarios: a breakout above $77 could send the price toward the $88 level; otherwise, a rejection here may pull the price back to the $60 support range. Volume spikes indicate active participation near current levels.

GC1! Gold Futures Weekly Outlook. Expecting Mid week reversalCOMEX:GC1!
Expecting a massive meltdown on Gold after $3400. On the Daily Internal Range Liquidity.
Trading All Time Highs is different compare to trading when you have a data on the left. Very volatile conditions on GOLD. I will buy from a 4H orderflow upto $3400. Then would short from $3400 CME_MINI:NQ1!

E-mini Nasdaq 100 Weekly Overview & Outlook for next weekIntroduction of Gap Quadrants. Weekly Orderflow Review. Expecting classic Weekly "Power of Three" next week. Along with a SMT Divergence on the lows with ES1!

McDonald's Corporation (MCD) – Lovin’ the GrowthCompany Snapshot:
McDonald’s NYSE:MCD is the undisputed global leader in quick-service restaurants, with over 40,000 locations worldwide and a brand that resonates across generations. The company blends cultural relevance with operational excellence, continuously innovating to stay ahead of changing consumer trends.
Key Catalysts:
Pop Culture Marketing Wins 🎯
The Minecraft-themed Happy Meal creates emotional connection with younger audiences
Drives family traffic, social media buzz, and larger basket sizes
Reinforces McDonald’s strategy of tapping into nostalgia + digital engagement
Smart Value Play 💸
The $5 combo hits at the perfect time amid inflationary pressure
Maintains volume without sacrificing margin, appealing to price-sensitive consumers
Combines affordability with iconic menu consistency
Financial Strength & Dividend Power 💼
Over $214B market cap and reliable free cash flow engine
A favorite for dividend growth investors, with a track record of consistent payouts
Strong global real estate holdings provide stability and leverage for expansion
Tech-Driven Operations 📲
Continued investment in mobile app, AI drive-thru, and kitchen automation
Enhances customer experience and boosts operating efficiency
Investment Outlook:
✅ Bullish Above: $278.00–$280.00
🚀 Upside Target: $370.00–$380.00
📈 Growth Drivers: Digital engagement, brand partnerships, resilient demand across economic cycles
📢 MCD: A timeless brand evolving with the times—one meal, one moment at a time.
#MCD #Dividends #BrandPower #FastFoodInnovation #PopCultureMarketing

PFEAt the current price, I'm looking for a retest toward the daily target zone located on the chart. On 3/21 PFE announced news about dropping the decision to move forward with the weight loss drug. Since then, price dropped down in spike like fashion. After the big volume spike, on that date, volume cam down and slowly started to build up again for the bears but there may be some weakness here. I wonder if this is a good price range where short sellers are starting to get concerned? I don't care for news and and am mainly a volume trader. So this trade will be interesting and maybe we get some attention at some point.
If price goes lower, we will revisit if another opportunity presents itself.

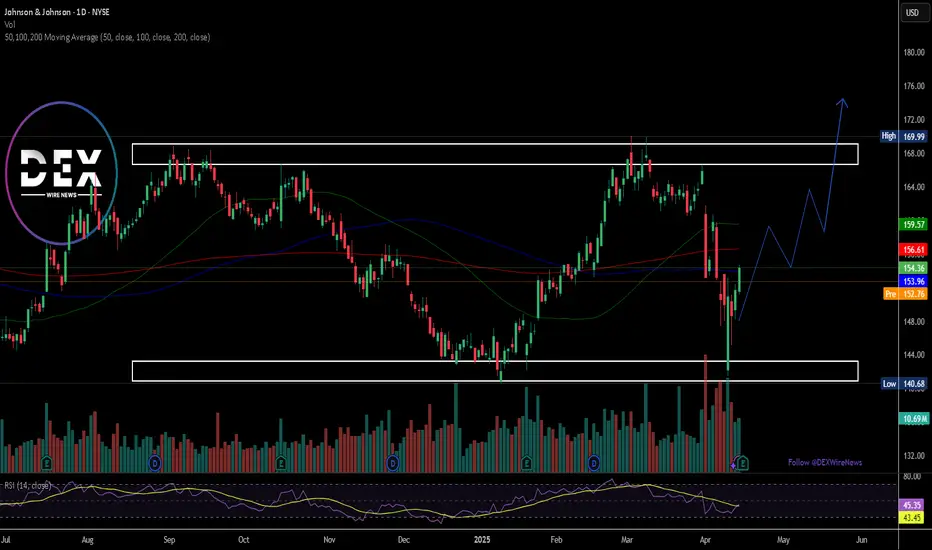
Johnson & Johnson Beats Q1 Estimates, Premarket Not Doing WellJohnson & Johnson (NYSE: NYSE:JNJ ) on Tuesday reported better-than-expected Q1 results and lifted its sales forecast for the full year.
Johnson & Johnson (NYSE: NYSE:JNJ ), together with its subsidiaries, engages in the research and development, manufacture, and sale of various products in the healthcare field worldwide, operating in two segments, Innovative Medicine and MedTech. Posted adjusted earnings per share (EPS) of $2.77 on revenue of $21.89 billion.
However, analysts had expected $2.56 and $21.56 billion, respectively, according to estimates compiled by Visible Alpha.
Price Action
Shares of Johnson & Johnson (NYSE: NYSE:JNJ ) were up about 1% immediately following the report, but the uptick was shortlived as the stock is down -0.54% in premarket trading. They entered the day up about 7% since the start of the year.
The company lifted its projected sales range to $91.0 billion to $91.8 billion, up from $89.2 billion to $90.0 billion previously. It also held its adjusted EPS forecast steady at $10.50 to $10.70, "including tariff costs, dilution from the Intra-Cellular Therapies acquisition, and updated foreign exchange."
Since reporting a disappointing 2025 sales outlook in January, the company closed its nearly $15 billion acquisition of Intra-Cellular Therapies and announced plans to lift its U.S. investment to more than $55 billion over the next four years.23
Technical Outlook
Shares of NYSE:JNJ closed Monday's session up 1.73% and despite the Q1 Earnings beat, the premarket session tells a different story as the asset is down 0.54% in Tuesday's session.
The asset is trading within an enclosed rectangular formation with a perfectly formed support and resistant zones as indicated in the chart. A break above the the key moving averages could cement a bullish breakout that may resort to a break above the $169 resistant point.
With the RSI at 45.35, NYSE:JNJ is well positioned for a bullish campaign once traders digest the earnings news.
Gold Assignment review and Intraday Reversal Market ProfileGold London consolidation and New York meltdown. Explaining the reasons. And OTE fibonacci levels

Gold outlook for next week. Expecting massive bullishnessCrosshairs on $3800. Extremely bullish on gold after this weekly closure

Coca cola is above breakout level Coca cola is above from breakout level of 69. It is expected to cross 80 and 90 levels.
Note: This is not a buy sell trade call. Trade at your own will. Use stop loss.

#Mstr is above green sky (strong bullish zone)#Mstr is now above green sky (Strong bullish zone). It is expected to cross 350 and 400 level.
Note: This is not a buy or sell call, trade at your own will. Use stop loss as per your strategy.

BlackRock Beats EPS Estimates Despite Revenue Miss in Q1 2025 BlackRock Inc. (NYSE: NYSE:BLK ) reported adjusted earnings per share (EPS) of $11.30 for Q1 2025. This beat the Zacks Consensus Estimate of $10.25, marking a 10.24% surprise. In the same quarter last year, EPS was $9.81.
Revenue came in at $5.28 billion, missing the estimate of $5.33 billion by 1%. However, it rose from $4.73 billion a year earlier. The company has surpassed EPS estimates in all four of the last quarters and has topped consensus estimates twice in that span. In the previous quarter, BlackRock posted EPS of $11.93, beating the $11.27 estimate. That represented a surprise of 5.86%.
BlackRock operates in the Financial - Investment Management industry. The market now awaits management’s outlook for future earnings. This will shape short-term price direction. So far in 2025, BlackRock shares have dropped 16.2%. In comparison, the S&P 500 has declined 10.4%.
Technical Analysis
BlackRock rebounded from a strong support zone near $780. This level aligns with the long-term horizontal support level that has held for over 3 years now. The RSI sits at 41, indicating it is nearly oversold. However, a bullish reversal momentum is forming around the support zone.
If the price continues to rise, resistance and target lie at the $1,084.22 recent high. A break above $950 may trigger a run toward the $1,000–$1,084 range. If the price is rejected, it could revisit the $780 support or possibly the ascending trendline sitting below the horizontal support.

Morgan Stanley (NYSE: MS) Reports Strong Q125 ResultsMorgan Stanley (NYSE: NYSE:MS ) Beats Q1 estimates with record Equity Trading Revenue. The bank posted earnings per share (EPS) of $2.60, beating analyst expectations of $2.18. Revenue reached a record $17.74 billion, topping forecasts of $16.44 billion.
The bank's equity trading revenue soared 45% year-over-year. It reached a new high of $4.13 billion as growth came across business lines and regions. Asia showed particularly strong performance. Prime brokerage and derivatives led gains, fueled by high client activity in volatile markets.
Morgan Stanley shares dropped 1% after the earnings release. However, the stock remains up over 20% in the past year. Volatility in global markets helped trading desks outperform.
Technical Analysis
Morgan Stanley bounced sharply from the $95 support zone. Buyers stepped in near the previous breakout level. Volume increased and confirmed renewed interest. This was seen as Trump paused tariffs for the next 90 days as well. Current price action suggests a recovery trend. The RSI stands at 39, hinting at oversold conditions. A potential path points to $142.03, which acts as the immediate resistance level.
If the price breaks $113 cleanly, momentum could carry it to $130 and beyond. If it fails, it is most likely to retest $95 support level. A strong break above recent highs would confirm bullish continuation. For now, Watch out the $113 and $142 levels closely.

XPeng Inc. (XPEV) – Driving the Smart EV Revolution Company Snapshot:
XPeng NYSE:XPEV is solidifying its status as a smart electric vehicle pioneer, blending cutting-edge AI, proprietary battery tech, and global expansion to challenge the status quo in EV innovation.
Key Catalysts:
Product Innovation 🚀
New 2025 G6 & G9 feature 5C fast-charging AI batteries
Turing-powered autonomous driving is among the most advanced in China
XNGP smart driving system reaches 86% active user penetration across cities
AI-Defined Vehicles 🤖
Launch of XPENG P7+, an AI-enhanced EV with futuristic user interfaces
Showcases XPeng’s edge in machine learning + mobility
Global Expansion 🌍
Entering UK, Indonesia, and Switzerland, boosting brand recognition & revenue diversification
Creates strategic foothold in key international EV markets
First-Mover Advantage 🔧
One of the few companies to integrate full-stack smart driving + proprietary battery tech
Strong R&D focus (40% of workforce) keeps XPeng at the forefront of next-gen mobility
Investment Outlook:
✅ Bullish Above: $17.50–$18.00
🚀 Upside Target: $25.00–$26.00
📈 Growth Drivers: Global footprint, AI-defined mobility, and rising EV adoption
⚡ XPeng – The AI brain behind tomorrow’s drive. #XPEV #EVInnovation #AIOnWheels
