PLTR: Palantir: Worth to have a small bag, for risk loversNYSE:PLTR On support. What to say? Risky asset but definitely worth to have a small bag of it, Palantir will probably leverage itself with the use of AI way more, and what if they make an as powerful AI as ChatGPT is?
I do not know.. let's grab a bag!
Nyse

ON HOLDING: RISKY BET BUT INTERESTINGNYSE:ONON If you want to enter this is probably one, just wait a bit, wait till the stock is reaching $16, back to the main support.

DJI SHORT POSITION Its look great to short here because we have some confirmation so enjoy it the rising channel have been breakdown and the RSI is making bearish divergence

$TSLA - Get ready! $TSLA - Get ready! 🚀
It's brewing nicely at a great support:
Support: 165
Resistance: 200
Break above 200 next areas of interest are between 210 - 230 Break below 160 areas this idea is no longer valid.
Longer term: 260-270 could be achieved.
Enjoy

NYSE Index Bear Case.Good evening,
This post is part of a series of requests i recently received.
The request was: "What is your bearish projection on the US stonk market".
---
Some may ask,
what is the NYSE Index?
👇
The NYSE Composite is a stock market index covering all common stock listed on the New York Stock Exchange,
including American depositary receipts, real estate investment trusts, tracking stocks, and foreign listings.
---
My estimated top for the New York Stock Exchange Index sits at $15,546 ~ $18,545
High probability target = $16,600
---
My estimated bottom on this one is roughly between $12,293 ~ $10,064
High probability target = $11,319
---
🔺

Starbucks heading to the sun to $113.42!Cup and Handle on Starbucks formed, broke up and out of it and is heading up.
The moving averages are super bullish 7>21>200
Target $113.42
CONCERNS:
The handle has formed gaps which is not good for TA as gaps close 70% of the time. This makes it a Medium probability trade where I only risk 1.5%

Walmart, Target unveil diverging economic outlooksWalmart and Target released diverging outlooks for the final quarter of 2022 as the companies' respective recent financial results show how rising inflation prompts consumers in the US to be extra mindful and plan their purchases instead of becoming abrupt buyers who will end up buying more than intended.
The change in consumer behavior benefited retail corporation Walmart, which generates much of its sales from groceries, and somehow took away sales from big box department store chain Target, which is a destination more for top-up shopping.
Consumers becoming extra careful of their spending can be attributed to inflation and concerns about the US economy heading into a recession.
The annual inflation rate in October slowed to 7.7%, compared with the 8.2% in September, according to figures released in November. The latest figure is lower than the consensus estimates of 8% and marked the lowest inflation figure since Jan. 22.
However, consumer confidence across the country fell during the month to a three-month low of 102.5 from a 107.8 reading in September despite the slowdown in inflation amid growing concerns regarding the economy.
Opposing outlooks
In the third quarter, Walmart upgrraded its financial outlook for the year after reporting an 8.2% growth in comparable sales and a sustained gain in market share of the grocery sector.
On the other hand, Target downgraded its forecast for the fourth quarter following a 2.7% hike in comparable sales, attributable to a 1.4% rise in traffic growth and a 1.3% increase in average ticket.
Since the release of their respective results, Walmart is up ~10% while Target has fallen ~8%.
Target's failure to hit its profit and revenue targets for the quarter paints a picture of how consumers are becoming more selective of what they spend on.
Saunders said the company's financial results show that people are now spending more on food and grocery staples and not as much on apparel and home goods, which provide better margins for the company.
This is how the behavioral shift becomes beneficial for Walmart. The company prides itself on offering products at "everyday low prices." As Americans become more careful with their spending, this mantra becomes even more appealing.
In addition, grocery items are always a necessity regardless of the soaring prices of products. With the bulk of its sales coming from groceries, this change could be very lucrative for Walmart.
Possible ray of light for the economy
Retail sales across the US in October saw a 1.3% uptick after being unchanged in September. Year over year, sales grew 8.3%.
The better-than-expected growth in retail sales across the US in October suggests consumer spending has picked up early in the fourth quarter of 2022. According to Reuters, this could be beneficial for the US economy, especially amid fears of an incoming recession.
Along with the slowdown in inflation, the solid retail sales for the month elicited cautious optimism that perhaps, the US economy could avoid the expected recession or at least only experience a mild downturn.
But Target's warning of "dramatic changes" in consumer behavior that dragged its third-quarter sales still hangs in the air, eliciting concerns that it may affect sales over the holidays.
Expectations for retail sales in November is a 0.9% rise. The National Retail Federation is forecasting holiday sales for 2022 will grow between 6% and 8% this year. If realized, the expected figure would be lower than the 13.5% hike recorded in the prior-year period even at top end of the range. Even so, it will still be higher than the 4.9% growth average over the past 10 years.

HDSN heading on up $14.00HDSN is showing a classic bull formation for upside.
We have a Double Bottom accompanies by 7>21>200 Moving Averages.
Right now we are seeing a retest to the 21MA which hopefully it gets its catalyst for further upside.
I don't like how the breakout was treated, but the system is the system and the long is activated.

BG could head to $127.57 with a warningBG has been showing strong upside signs with moving averages crossing up.
We also see a potential Cup and Handle which strong upside to $127.57.
However, it's formed with a GAP... And as I've mentioned with many analyses, Gaps tend to close 70% of the time which could bring the price lower.
This makes this analysis a medium probability trade where I'd only risk 1.5% of my portfolio...

ABBV Inverse Head and Shoulders Bullish - Santa rally Skew Inverse Head And Shoulders with a target of $174.65.
We do see bullish signals momentum wise where 7>21 >200.
Bullish
Let's just hope a bull market does kick in here as we enter the Christmas season with a Santa Rally.

NKE - Just do itNike Inc - Intraday - We look to Buy at 99.72 (stop at 91.56)
Broken out of the channel formation to the upside. We have a Gap open at 99.72 from 10/11/2022 to 11/11/2022. Further upside is expected although we prefer to buy into dips close to the 99.72 level. Expect trading to remain mixed and volatile.
Our profit targets will be 118.44 and 139.00
Resistance: 109.31 / 113.36 / 118.47
Support: 99.72 / 92.10 / 82.22
Please be advised that the information presented on TradingView is provided to Vantage (‘Vantage Global Limited’, ‘we’) by a third-party provider (‘Signal Centre’). Please be reminded that you are solely responsible for the trading decisions on your account. There is a very high degree of risk involved in trading. Any information and/or content is intended entirely for research, educational and informational purposes only and does not constitute investment or consultation advice or investment strategy. The information is not tailored to the investment needs of any specific person and therefore does not involve a consideration of any of the investment objectives, financial situation or needs of any viewer that may receive it. Kindly also note that past performance is not a reliable indicator of future results. Actual results may differ materially from those anticipated in forward-looking or past performance statements. We assume no liability as to the accuracy or completeness of any of the information and/or content provided herein and the Company cannot be held responsible for any omission, mistake nor for any loss or damage including without limitation to any loss of profit which may arise from reliance on any information supplied by Signal Centre.

GAP BACK TO 2022 OPEN ?- Price is back above 2022 Mid-level
- 2022 Open = 2022 High = 2023 Yearly R1 = Imbalance
- If Dollar-weakness continues in DEC a rally higher is likely
- Wyckoff accumulation-pattern completed
- Look to buy the retrace begin DEC

BA - Sell Setup - Target $150 - SMCSell opportunity at the marked blue area. Wait for additional conformation in the lower timeframe.

NVDA - Sell Setup - SMCLook for sell seup in the marked blue area. Need one more confirmation in lower timeframe.

3D Systems potential INv H and S upside Potential Inv H and S on 3D Systems.
It looks ok, but the price still remains under 200MA and we need a break above the neckline first.
I wouldn't risk more than 1.5% for this trade.
Target $15.13

Michael Burry buying GEO - Chart reviewToday you can review the technical analysis idea on a 1D linear scale chart for Geo Group Inc (GEO).
Michael Burry's investment in Geo Group Inc seems to be paying off. Price may be headed towards $11. Keeping a close eye on this one. Falling channel breakout and above the 200 SMA. Resistance around $11.
fortune.com
If you enjoy my ideas, feel free to like it and drop in a comment. I love reading your comments below.
Disclosure: This is just my opinion and not any type of financial advice. I enjoy charting and discussing technical analysis. Don't trade based on my advice. Do your own research! #millionaireeconomics

US30-- A humbling realization that the bull run may not be overAnd, just when you thought the world was about to end..
Jussst when you thought that Bitcoin had found the bottom..
Jussssst when you think that you might as well just enter
into a macro trend because its never going to end..
Jusssssssst when you find a perfect trend line and decide to
over leverage just this one time..
The universe wags its finger, and albeit the market expects the
Fed to ease up on interest rates for the holiday.
If somebody asked me "Bobby? Do you think youll ever possess
a Bitcoin for less than you bought it?" back when Bitcoin was
going parabolic in 2018, I would have bet you that I wouldn't.
I would have bet you a Bitcoin!
I'm sharing my weekly analysis of the Dow Jones Industrial Average.
After discussing the post CPI news trading day with a colleague and
close friend of mine, and taking an umpteenth look at the numbers,
a slight adjustment in my theory brought some major clarity to this
recent price action, and it dawned on me: I have no idea what is
actually going to happen. It also didn't make it any better that i was
completely unaware that the November interest rate was announced
an entire week ago, LOL...
That realization was also an emphasis on how important it is to keep
things simple when trading and to manage our risk properly and
patiently.
Check out my analysis, and let me know if you think 33,800 is a critical
level like I do.

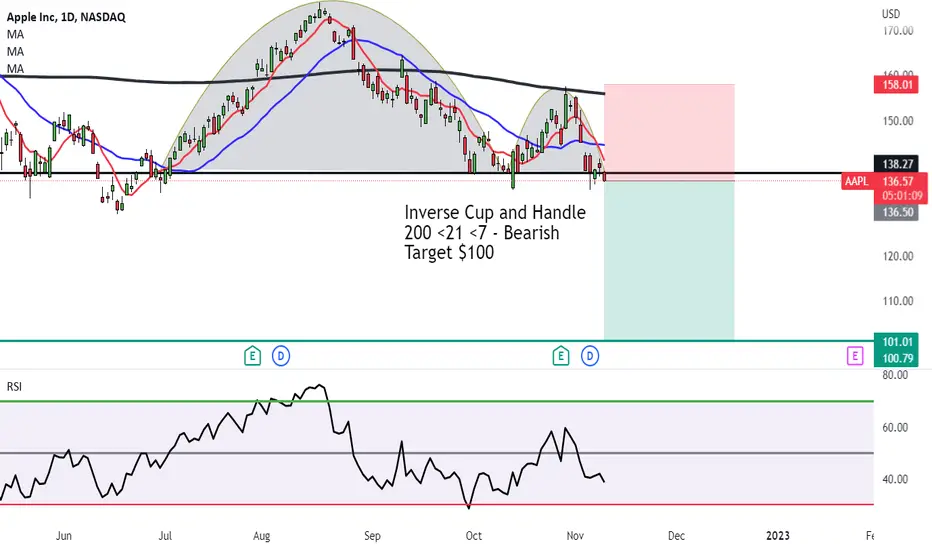
Inv Cup and handle for Apply to $100Inverse Cup and Handle has formed on Daily with Apple.
The price has broken below the brim level
The moving averages are all bearish 200 <21 <7 -
The first target is $100
CONCERNS
There are bullish signs with global stocks, which might cause a fake out.
We can also see a weak break below the brim level, which could make this analysis wrong.
American Airlines Group flying up to $16.93 Inv Head and Shoulders has formed on Daily chart
We are just waiting for the breakout which will send the price to Target $16.93
With the bull market across the board with investors moving their money back to stocks and out of crypto, we are seeing global upside to come for stocks.

Bearish flag on VmwareVMware - Short Term - We look to Sell at 111.95 (stop at 115.15)
The medium-term bias remains bearish. Trading within the Wedge formation. Prices are extending lower from the bearish flag/pennant formation. We have a Gap open at 111.95 from 02/11/2022 to 03/11/2022. The preferred trade is to sell into rallies.
Our profit targets will be 96.19 and 91.55
Resistance: 111.95 / 114.41 / 118.68
Support: 103.55 / 102.53 / 96.19
Please be advised that the information presented on TradingView is provided to Vantage (‘Vantage Global Limited’, ‘we’) by a third-party provider (‘Signal Centre’). Please be reminded that you are solely responsible for the trading decisions on your account. There is a very high degree of risk involved in trading. Any information and/or content is intended entirely for research, educational and informational purposes only and does not constitute investment or consultation advice or investment strategy. The information is not tailored to the investment needs of any specific person and therefore does not involve a consideration of any of the investment objectives, financial situation or needs of any viewer that may receive it. Kindly also note that past performance is not a reliable indicator of future results. Actual results may differ materially from those anticipated in forward-looking or past performance statements. We assume no liability as to the accuracy or completeness of any of the information and/or content provided herein and the Company cannot be held responsible for any omission, mistake nor for any loss or damage including without limitation to any loss of profit which may arise from reliance on any information supplied by Signal Centre.

Rising Wedge in an uptrend for Lamb WestonThis is very subjective, and I am not good with these analyses...
It seems like a Rising Wedge in an uptrend has established (though some might see a Cup and Handle).
Also there is a strong bearish pinbar candle, that has shown the sellers are winning.
The momentum is looking weak and we could very well expect a reversal from here.
I would only short though if the price breaks below the pattern.

Kiss Hershey chocolates hello to $271!Hershey broke up and out of a Cup and Handle pattern.
The Moving Averages are all pointing up and looks good.
There is a retest on the brim level giving this a conservative entry for chart pattern traders.
Target = $271.00
CONCERNS:
With the Interest rate hike of 75 basis points pumping it to 4% with more coming, this could disrupt the upside as it has done with stocks gloablly.

Clearfield, Inc. Growing.Fundamental (reason why I am putting this stock in my watchlist): Their EPS growth and Revenue Grotwh (between Q3 2021 to Q3 is 109% and 84% respectively. ROE is 33%. This is what I define as a potential growth stocks.
Technical : It is correcting after its 6 day rally. It will be interesting if it reverts back to the mean (50,100 and 200 EMA). it is testing the 20EMA right now.
Action : Wait and see if it goes to the mean and/or form a flat tight base.
