NYSE COMPOSITE INDEX. BACK TO 20 000 MARK — KEY RESISTANCE LINEThe NYSE Composite TVC:NYA is a stock market index, that covering all common stock listed on the New York Stock Exchange, including American depositary receipts, real estate investment trusts, tracking stocks, and foreign listings.
Over 2,000 stocks are covered in the index, of which over 1,600 are from United States corporations and over 360 are foreign listings.
However foreign companies are very prevalent among the largest companies in the index: of the 100 companies in the index having the largest market capitalization (and thus the largest impact on the index), more than half (55) are non-U.S. issues.
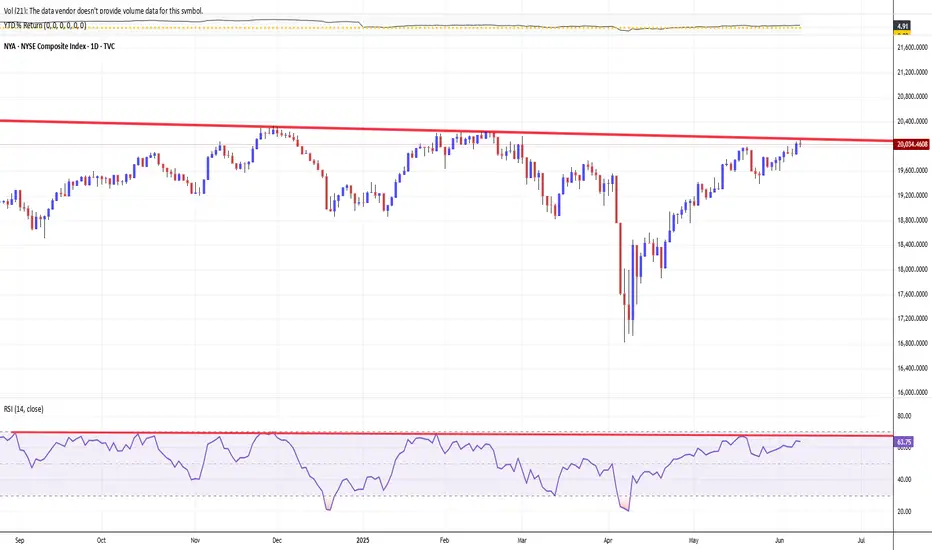
Thanks to many non-U.S. components, NYSE Composite index shows nearly 5 per cent return in 2025 so far, outperforms major U.S. stock indices like Dow Jones Industrial (+0.24%), S&P500 (+1.91%), as well as Nasdaq-100 (+3.21%).
Trade negotiations and tariff expectations have been central drivers of the NYSE Composite Index's recent recovery, shaping both market sentiment and underlying corporate fundamentals.
Trade Negotiations. Market Sensitivity and Relief Rallies
Financial markets, including the NYSE Composite, have reacted sharply to developments in trade negotiations. Historically, when trade talks break down or new tariffs are announced, U.S. stocks tend to sell off due to concerns over higher costs, supply chain disruptions, and reduced global demand. Conversely, when negotiations resume or tariffs are delayed, markets often rebound. For example, during the 2018–2019 U.S.–China trade war, U.S. stocks experienced heightened volatility, but rallied strongly after the announcement of the Phase I trade deal, as uncertainty eased and the threat of further escalation diminished. This pattern has repeated in 2025: the NYSE Composite has staged recoveries following signs of progress in trade talks or delays in tariff implementation, as investors anticipate less disruption to global commerce and corporate earnings.
Tariff Expectations. Impact on Earnings, Valuations, and Sentiment
Tariffs directly affect corporate earnings by raising input costs for companies that rely on imported goods. According to Goldman Sachs Research, every five-percentage-point increase in the U.S. tariff rate is estimated to reduce S&P 500 earnings per share by roughly 1-2%. If companies absorb these costs, profit margins are squeezed; if they pass them on to consumers, sales may decline. The NYSE Composite, which tracks a broad swath of U.S. and international companies, is similarly exposed.
Expectations around tariffs also influence equity valuations.
Elevated policy uncertainty—driven by unpredictable tariff announcements—raises the risk premium investors demand, often compressing price-to-earnings multiples and weighing on stock prices. When clarity emerges, such as the announcement of a tariff pause or the prospect of a negotiated settlement, uncertainty recedes, and valuations can recover, fueling index gains.
The Role of Policy Announcements and Market Psychology.
Trade policy announcements have acted as economic shocks, affecting global trade relationships and growth forecasts. For instance, after the U.S. announced new tariffs in early 2025, recession odds rose and GDP growth forecasts were slashed, prompting a broad market sell-off. However, the subsequent announcement of a 90-day tariff pause and renewed negotiations led to a stabilization and partial recovery in equities, as investors reassessed the likelihood of a severe downturn.
Market psychology amplifies these moves.
As trade rhetoric intensifies, investor sentiment can become excessively pessimistic, sometimes overshooting the actual economic impact of tariffs. This creates conditions for relief rallies when negotiations show progress or when the tariff outlook becomes less severe than feared.
Technical challenge
NYSE Composite index has experiencied record values on Friday, November 29, 2024, following so-called Trump-a-Rally.
The best Closing high was 20,272.04 ponts at those day and the best Intraday high was 20,332.50 points, also at the same day.
However unability to finish the year 2024 firmly above 20 000 round number, sharply pushed stock market bulls into fart and double-digit decline earlier in 2025.
The main chart indicates on major resistance again, near 20 000 point while technical indicator RSI (14) still goes sluggish.
Conclusion
The NYSE Composite Index's recovery has been closely tied to the ebb and flow of trade negotiations and tariff expectations. Positive developments in negotiations and reduced tariff threats have alleviated uncertainty, supported earnings expectations, and improved investor sentiment, all of which have contributed to the index's rebound.
--
Best wishes,
@PandorraResearch Team 😎
Nysecomposite
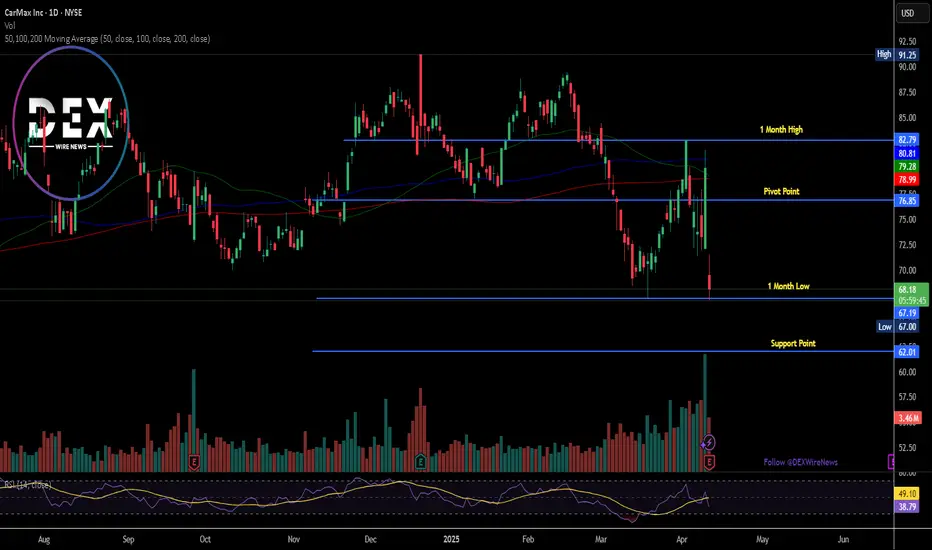
Breaking: CarMax, Inc. (NYSE: KMX) Shares Down Nearly 15% TodayShares of CarMax, Inc. (NYSE: KMX) tanked nearly 15% today amidst missing Fourth Quarter Profit expectation.
CarMax (KMX) shares dropped in premarket trading Thursday after the used-car retailer's fiscal fourth-quarter profit and used-vehicle sales came in below analysts' expectations.1
The Virginia-based company reported earnings per share (EPS) of $0.58 on net sales and operating revenue of $6.00 billion, both up from $0.32 and $5.63 billion a year ago.2 Analysts polled by Visible Alpha projected $0.68 and $5.99 billion, respectively.
CarMax sold a total of 301,811 used vehicles, including 182,655 retail and 119,156 wholesale units, each below consensus. Analysts were looking for 312,800 units of combined sales, consisting of 185,900 retail and 126,900 wholesale vehicles.
A year ago, CarMax said it expected to reach 2 million annual vehicle sales between fiscal 2026 and 2030. It said that before it reached that unit figure, it expected annual revenue to reach $33 billion and market share of up to 10-year-old used vehicles to hit 5%.
Analysts have said both new and used cars are likely to become thousands of dollars more expensive as a result of the Trump administration's tariffs.
CarMax shares, which entered Thursday down 4% over the past 12 months, were down 8% immediately after the report. Last quarter, the stock surged as CEO Bill Nash said the better-than-expected results were helped by "a more stable environment for vehicle valuations.
Buy Brinker InternationalShort Term Trading Advice by Naranj Capital
Buy Brinker International
● Buy Range- 151 - 156
● Target- 166 - 169
● StopLoss- 145
● Potential Return- 6-8%
● Duration- 14-15 Trading Days

Breaking: KB Home (NYSE: KBH) On The Verge of a Selling SpreeShares of KB Home (NYSE: NYSE:KBH ) saw a 7% downtick early morning in Tuesday's premarket session breaking below the psychological support point of $60 enroute towards a selling spree.
Operating as a homebuilding company in the United States, the company operates through four segments: West Coast, Southwest, Central, and Southeast. It builds and sells a variety of homes, including attached and detached single-family residential homes, townhomes, and condominiums primarily for first-time, first move-up, second move-up, and active adult homebuyers.
Yesterday after market close KB Home report earnings results, posting lower profit and revenue in its fiscal first quarter, hurt by softer-than-expected demand.
KB Home shares have declined 10% over the past year due to affordability pressures and elevated interest rates, with Q1 results showing significant demand slowdown.
The company reported weak Q1 financials, with earnings and revenue misses, a 9% drop in deliveries, and a 17% fall in net orders.
Elevated interest rates and increased supply have pressured margins and demand, particularly affecting first-time buyers, leading to reduced revenue guidance and operating margin
Financial Performance
In 2024, KB Home's revenue was $6.93 billion, an increase of 8.10% compared to the previous year's $6.41 billion. Earnings were $650.19 million, an increase of 10.97%.
Technical Outlook
As of the time of writing, shares of NYSE:KBH are down 7.20% on Tuesday's premarket trading with the asset facing selling pressure, should the RSI which is currently at 48 dip to 40, a bearish campaign would be inevitable- similarly, a move above the $72 pivot could change the course for NYSE:KBH shares.
Analyst Forecast
According to 13 analysts, the average rating for KBH stock is "Hold." The 12-month stock price forecast is $75.5, which is an increase of 22.19% from the latest price.

Major Indexes Face Downturn: What's Coming Next?◉ S&P 500 SP:SPX
● The long-term trendline support has been breached.
● The immediate support range is identified around the 5,650 to 5,700 levels.
◉ Nasdaq Composite NASDAQ:IXIC
● The Nasdaq Composite has rebounded from its long-term trendline support, demonstrating resilience amid economic uncertainty.
◉ NYSE Composite TVC:NYA
● The NYSE Composite has found support at its trendline and may bounce back from this important level.
◉ Dow Jones Industrial Average TVC:DJI
● After a consecutive decline over ten days, the index has surpassed its trendline support and is approaching the next support zone between 41,500 and 42,800.
Overall, all indices are anticipated to recover shortly, with expectations of robust performance from major stocks.

US Markets Demonstrate Confidence Despite Election JittersThe US markets are currently demonstrating a bullish sentiment, despite concerns surrounding the upcoming election.
All major indices, including the S&P 500, NYSE Composite, and Nasdaq Composite, have formed a bullish Cup & Handle chart pattern and have subsequently broken to follow an upward trend.
While the S&P 500 and NYSE Composite have reached new all-time highs, the Nasdaq Composite is close to its highest peak, further reinforcing the positive market outlook.
'This overall bullish sentiment suggests that the upward trend in the US markets is likely to continue, even in the face of election-related uncertainties.

NYSE Composite - Price Action Consolidated In A Triangle Pattern(1) The price was in an upward trend before reaching the 17,500 level.
(2) Following that, the price began to decrease, experiencing a drop of nearly 21%.
(3) After finding support near the 13,300 level, the price rose and broke through the neckline of the Inverted Head & Shoulder pattern.
(4) Subsequently, the price increased and is currently consolidating within a triangle pattern.
(5) If the price successfully breaks out, the potential resistance level will be around 19,650.

Guidewire is on a bullrun, the price may increase further(1) The price was repeatedly rejected near the 130 level before experiencing a significant drop.
(2) After a substantial correction, the price found support around the 52 level and surged upwards with great momentum.
(3) Ultimately, the price successfully broke through its previous resistance on high volume and is now holding above the breakout level.

Technical Analysis Of NYSE Composite Index In Daily Timeframe
(1) After the breakout of the Rounding Bottom pattern, price has given a sharp upside rally and reached to its previous All Time High at near 18,340.
(2) After that, a sharp correction has been seen, which was quite natural. Price took support at near 17,380 level.
(3) Then with a strong up move, price made a fresh All Time High at near 18,400 level.
(4) 18,330 level will act as an immediate support level for the price and It is expected that the price will go up again from this level and achieve new highs.
(5) The overall sentiments will remain positive until the price is trading above the 17,380 level.

Berkshire Hathaway Inc. New WCA - Classic Rectangle PatternHello and thank you for taking the time to read my post. Today, we analyze Berkshire Hathaway Inc. New's chart on the weekly scale, focusing on a classic price pattern called the "Rectangle Pattern." Berkshire Hathaway Inc. New is a diversified financial services conglomerate, traded on the NYSE under the tickers BRK.A (Class A shares) and BRK.B (Class B shares).
Classic Rectangle Pattern:
The classic rectangle pattern is a chart pattern formed when the price of an asset moves between two parallel horizontal lines, representing support and resistance levels, over a period of time. In essence, it reflects a consolidation phase where the market is undecided about the direction of the trend.
Analysis:
In the case of Berkshire Hathaway Inc. New, we observe a 322-day rectangle with several touching points. The upper boundary is at 320$, and the lower boundary is at 264$. The price chart has just broken out of the rectangle and is re-testing the old resistance as support, which makes an entry interesting. All this happens while we are above the 200 EMA, which supports a bullish environment and an idea on the long side.
Additional Analysis:
The recent breakout from the rectangle pattern and the re-test of the old resistance as new support suggest a potential upward trend continuation. As we are above the 200 EMA, the bullish environment is further supported, making long positions more attractive. The price target is at 376$, which represents a potential ~17.5% price increase. On the way to the price target, we can expect to encounter resistance at 360$.
Conclusion:
The Berkshire Hathaway Inc. New weekly chart showcases a classic Rectangle Pattern, reflecting a consolidation phase in the market. The recent breakout and re-test of old resistance as support, combined with the price being above the 200 EMA, signal a potential continuation of the bullish trend. With a price target of 376$ and intermediate resistance at 360$, traders should remain vigilant and consider proper risk management strategies when entering long positions.
Company: Berkshire Hathaway Inc. New
Ticker: BRK.A (Class A shares) / BRK.B (Class B shares)
Exchange: NYSE
Sector: Diversified Financial Services
Please note that this analysis is not financial advice. Always do your own due diligence when investing or trading.
Best regards,
Karim Subhieh

Equity Mid Year Macro UpdateIn January I reviewed the long-term technical and fundamental positions of the big four: Bonds, Equities, Commodities, and the Dollar. Those pieces are extensive in terms of both fundamental and technical outlooks and are linked for your review below. I made two particularly important fundamental observations:
1. Both policy vectors (Fiscal and Monetary) are turning negative and are unlikely to provide support. This may change if rising rates break the weakest financial link forcing the Fed to pivot to address a systemic issue or if Congress decides that another money drop is appropriate.
2. Of the 19 bear markets since 1929, 15 have been accompanied by rising inflation. Rising inflation is by far the most consistent/reliable of the bear market factors.
The SPX piece concluded: "The technical trend to higher prices is intact, but, from this trend position, the market is extremely vulnerable. While not yet discontinuing bullish strategies, I would be extremely wary, reducing commitments and deciding on risk management levels. Shorter term time frame weakness can easily morph into something greater."
Where are the markets now?
Since those January posts, equities are sharply lower and both technical and fundamental factors have deteriorated markedly. I suspect that by the end of the fourth quarter the balance of the techncial data will have, at the very least, confirmed that the 14-year uptrend is over. While price behaviors in the SPX and NYSE Composite have yet to confirm a primary bear market, I think it likely that at the least, an extended bear is unfolding.
Since January, the monetary vector has turned decidedly negative (rapidly increasing Fed Funds rate and quantitative tightening), and while the recent declines in commodities are creating optimism, the inflation rate continues to worsen. Even should inflation moderate it remains far in excess of the rough 3% threshold above which most companies struggle. Most importantly the Fed has clearly pivoted from the economy and toward inflation. Because they waited so long to pivot, the battle will be a prolonged one and will likely require a recession, perhaps a serious one, to win. In short, the liquidity that propelled the bull market has reversed and the prospects for it returning soon are limited.
Currently I see no immediate systemic issues that could require a response from the Fed but I am growing more concerned around emerging markets. I also continue to monitor credit conditions (see the post linked below for how to monitor credit on the platform) but so far, the widening in credit spreads isn't compelling.
SPX Monthly: Log Scale:
The market has spent nearly 15 years confined to an upward sloping channel. Prior to the pandemic selloff the market uptrend was best described by the channel defined by trendlines A-B and A1-B1. Despite the channel being violated by the pandemic decline (G), I continue to view A1-B1 as the primary trend support. As long as this trend line remains intact, the price trend in the monthly perspective remains higher. Two observations. 1) Over the 15 years price spent a tremendous amount of time pressed against the top of the channel suggesting strong underlying demand. 2) At the January 2022 high, price overthrew the top of the channel. This "overthrow" behavior often occurs near the end of extended trends. In my view, a violation of the A1-B2 uptrend will move the long-term trend from up to neutral. To then define a downtrend the market will need to begin building a pattern of lower highs and lower lows.
Monthly momentum oscillators have rolled over. I have included a basic MACD oscillator on the chart. I don't use oscillator crosses as buy or sell signals, but I do utilize them as trend filters.
NYSE Composite Monthly (NYA): Log Scale: I prefer to define broad equity via the behaviors in the NYSE Comp. Many of the same observations for the SPX (trendlines and momentum) hold true for NYA. Notably there is an extremely large wedge pattern that will be activated with a drop below roughly 11k (roughly 20% further).
The roughly 20% year to date decline from the all-time seems modest by historical standards. Granted, since the great financial crisis declines have been generally in the -20% zone. But that was against the backdrop of nearly constant quantitative easing. Absent QE, and against a backdrop of rapidly deteriorating economic fundamentals, the current environment is far different.
I have also marked the chart with recession bands. Many commentators are making the case that equites often bottom near the beginning of a recession. I don't see the evidence. In fact, if the US/World is just entering a recession, I wouldn't expect an equity bottom anytime soon. Again, the reaction function of the Fed may come into play. While I think the Greenspan Put is dead, or at least the strike is much lower than in the past, if credit markets freeze or a major systemic issue develops they may feel forced to pivot.
Triple Screen: Monthly momentum has clearly turned lower, and could easily support significant additional losses. Weekly oscillators are moving into configurations that could support some recovery, but it’s likely that strength will be corrective. The mostly lateral movement that has developed in the daily perspective is consistent with a market relieving an oversold condition.
Conclusions:
3. The technical uptrend that has defined the markets path since 2008 remains intact but will likely fail later this year.
4. The weight of evidence, both fundamental and technical, suggests that the current decline is early to mid-stage, and that the uptrend will fail. The moving the long-term trend from up to neutral.
5. The important difference between this decline and the more run of the mill declines that have occurred since the GFC is monetary policy. The Fed has fully pivoted to fighting inflation. Having already erred by assuming transitory inflation, they will be very slow to pivot back to the economy and asset prices.
6. While it would not be surprising to see a decent tactical rally develop in coming weeks, it isn't likely to evolve into a new bull. I will be a much better seller of strength in daily and weekly perspectives.
7. While the market at the index level is vulnerable, many component names are much more advanced in their bear markets. There are opportunities beginning to show up.
The caveat (as always) is the Fed. If systemic issues develop and they pivot from inflation, all bets are off.
Good Trading:
Stewart Taylor, CMT
Chartered Market Technician
Shared content and posted charts are intended to be used for informational and educational purposes only. The CMT Association does not offer, and this information shall not be understood or construed as, financial advice or investment recommendations. The information provided is not a substitute for advice from an investment professional. The CMT Association does not accept liability for any financial loss or damage our audience may incur.

NYSE Composite Crash & Recovery ProjectionTaking the last 4 major corrections since 2000 averages for both % decline and length to recover to previous level gives a benchmark to consider relative to the current situation.
- % decline 39.38%
- length of time to recover 1,172 days
So $NYA on average well bottom around 10.8k and recover mid-March 2025
Aligning relatively close to the current 200 EMA while taking about 2 yrs for full recovery.

LEA Parallel SupportTwo double tops can be identified along the top line
A lower line plotted parallel to this curved line allows for a possible bottom point which coincides with 2.618 Fibonacci circle, which was seen as a level of support. This could also be marked as 0.
A middle line (0.5) hosts the bottom for another double top structure, lets see if the recovery pattern in green repeats

NYSE COMPOSITE - 3/3 CompletesThe NYSE COMP has reached the lower-Price Objective.
A 3 Day Selloff concluded Friday during Expiry.
Will 3/3 of extend...
__________________________________________________
Advances 1,164
Declines 2,184
Unchanged 153
New highs 93
New lows 112
Adv. volume 243,470,747
Decl. volume 687,043,457
Total volume 937,893,669
__________________________________________________
Not a Sign of Health.

NYSE COMPOSITE - 3 Can keep a Secret if 2 are DeadN A S T Y
U G L Y
DUMP
_______________________
NYSE COMP Says it all.
The broadest Measure of Health is DOA
Just beginning to Unwind

possible move for google all this thing we see and analysis the price move up and down as other stocks. there is a possibility of retrace and back to high as area i locate.this is most possible move. if price not back to last level of high the price go up at 1824. and if break this level then go higher 1957. i update there my all views. stay with me further analysis

NYSE COMPOSITE INDEX (NYA) WeeklyDates in the future with the greatest probability for a price high or price low


NYSE COMP INDEX - dailyRange 12,682 - 12,047
resistance test at top of range 12,682
macro trend uncertain
VOL ATR - LONG since JAN 29
PA top of BB indicating strength
RSI MACD indicate possible momentum change
support at 12,047
short term flat/neutral
