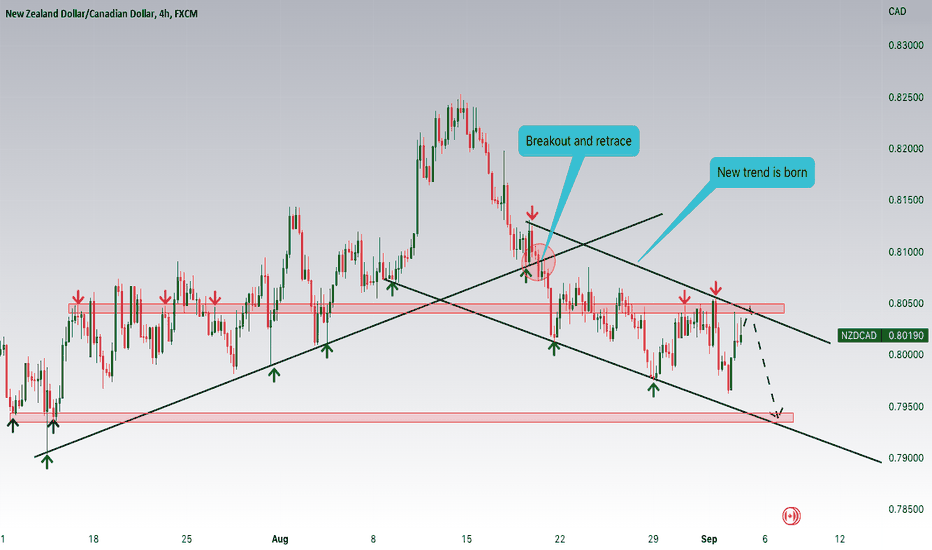
NZDCAD potential for bounce! | 7th April 2022Prics are consolidating in a triangle and abiding by an ascending trendline. We see the potential for a bounce from our Buy Entry at 0.86503 in line with 78.6% Fibonacci Retracement. Prices are trading above our ichimoku cloud.
Any opinions, news, research, analyses, prices, other information, or links to third-party sites contained on this website are provided on an "as-is" basis, as general market commentary, and do not constitute investment advice. The market commentary has not been prepared in accordance with legal requirements designed to promote the independence of investment research, and it is therefore not subject to any prohibition on dealing ahead of dissemination. Although this commentary is not produced by an independent source, FXCM takes all sufficient steps to eliminate or prevent any conflicts of interest arising out of the production and dissemination of this communication. The employees of FXCM commit to acting in the clients' best interests and represent their views without misleading, deceiving, or otherwise impairing the clients' ability to make informed investment decisions. For more information about the FXCM's internal organizational and administrative arrangements for the prevention of conflicts, please refer to the Firms' Managing Conflicts Policy. Please ensure that you read and understand our Full Disclaimer and Liability provision concerning the foregoing Information, which can be accessed on the website.
Nzd-cad
NZDCAD on a double top at the 0.618 🦐NZDCAD on the daily chart after the recent lows retraced exactly at the 0.618 Fibonacci level near to the 0.88 level.
The market ended up creating a perfect double top and is currently testing a weekly support.
How can we approach this scenario?
Being both the double top and the 0.618 potential reversal point we will wait for a possible break below the support area and in that case we will move on the 4h timeframe to check for a possible entry point.
According to Plancton's strategy if the conditions will be satisfied we will set a nice short order.
----
Follow the Shrimp 🦐
Keep in mind.
🟣 Purple structure -> Monthly structure.
🔴 Red structure -> Weekly structure.
🔵 Blue structure -> Daily structure.
🟡 Yellow structure -> 4h structure.
⚫️ Black structure -> >4h structure.
Here is the Plancton0618 technical analysis , please comment below if you have any question.
The ENTRY in the market will be taken only if the condition of the Plancton0618 strategy will trigger
NZDCAD H4 Potential Bullish Momentum | 17th March 2022On the H4, price is abiding by the ascending trendline and near Buy Entry level of 0.87066 in line with 50% Fibonacci retracement . Price can potentially move towards Take Profit level of 0.88088 in line with 78.6% Fibonacci projection , along with a graphical swing high resistance. Our bullish bias is supported by the stochastic indicator as it is near support level .
Any opinions, news, research, analyses, prices, other information, or links to third-party sites contained on this website are provided on an "as-is" basis, as general market commentary, and do not constitute investment advice. The market commentary has not been prepared in accordance with legal requirements designed to promote the independence of investment research, and it is therefore not subject to any prohibition on dealing ahead of dissemination. Although this commentary is not produced by an independent source, FXCM takes all sufficient steps to eliminate or prevent any conflicts of interest arising out of the production and dissemination of this communication. The employees of FXCM commit to acting in the clients' best interests and represent their views without misleading, deceiving, or otherwise impairing the clients' ability to make informed investment decisions. For more information about the FXCM's internal organizational and administrative arrangements for the prevention of conflicts, please refer to the Firms' Managing Conflicts Policy. Please ensure that you read and understand our Full Disclaimer and Liability provision concerning the foregoing Information, which can be accessed on the website.
NZDCAD H4 Potential Bullish Momentum | 17th March 2022On the H4, price is abiding by the ascending trendline and near 1st resistance level of 0.87066 in line with 50% Fibonacci retracement. Price can potentially move towards 2nd resistance level of 0.88088 in line with 78.6% Fibonacci projection, along with a graphical swing high resistance. Our bullish bias is supported by the stochastic indicator as it is near support level.
Any opinions, news, research, analyses, prices, other information, or links to third-party sites contained on this website are provided on an "as-is" basis, as general market commentary, and do not constitute investment advice. The market commentary has not been prepared in accordance with legal requirements designed to promote the independence of investment research, and it is therefore not subject to any prohibition on dealing ahead of dissemination. Although this commentary is not produced by an independent source, FXCM takes all sufficient steps to eliminate or prevent any conflicts of interest arising out of the production and dissemination of this communication. The employees of FXCM commit to acting in the clients' best interests and represent their views without misleading, deceiving, or otherwise impairing the clients' ability to make informed investment decisions. For more information about the FXCM's internal organizational and administrative arrangements for the prevention of conflicts, please refer to the Firms' Managing Conflicts Policy. Please ensure that you read and understand our Full Disclaimer and Liability provision concerning the foregoing Information, which can be accessed on the website.
NSDCAD Analysis I Impulse Correction Welcome back! Here's an analysis of this pair!
**NZDCAD is on its second push impulse wave, thus I expect a correction from previous resistance near 8760 area. It may return to support at 8708 or 8665, and then rise back to resistance 8760, and next stop 8920 zone.
We recommend that you keep this pair on your watchlist and enter when the entry criteria of your strategy is met.
Please support this idea with a LIKE and COMMENT if you find it useful and Click "Follow" on our profile if you'd like these trade ideas delivered straight to your email in the future.
Thanks for your continued support!
Brian & Kenya Horton, BK Forex Academy
NZDCAD H4 Potential Bounce | 28th Feb 2022On the H4, with price moving above the ichimoku cloud , we can expect bullish continuation from our entry at 0.84905 in line with 61.8% Fibonacci retracement towards our take profit at 0.86403 which is a strong resistance and in line with 61.8% Fibonacci retracement . Alternatively, price may break entry structure and head for stop loss, which coincides with the horizontal swing low support at 0.84137.
4 hours ago
Comment: Any opinions, news, research, analyses, prices, other information, or links to third-party sites contained on this website are provided on an "as-is" basis, as general market commentary, and do not constitute investment advice. The market commentary has not been prepared in accordance with legal requirements designed to promote the independence of investment research, and it is therefore not subject to any prohibition on dealing ahead of dissemination. Although this commentary is not produced by an independent source, FXCM takes all sufficient steps to eliminate or prevent any conflicts of interest arising out of the production and dissemination of this communication. The employees of FXCM commit to acting in the clients' best interests and represent their views without misleading, deceiving, or otherwise impairing the clients' ability to make informed investment decisions. For more information about the FXCM's internal organizational and administrative arrangements for the prevention of conflicts, please refer to the Firms' Managing Conflicts Policy. Please ensure that you read and understand our Full Disclaimer and Liability provision concerning the foregoing Information, which can be accessed on the website.
NZDCAD H4 Potential Bounce | 28th Feb 2022On the H4, with price moving above the ichimoku cloud, we can expect bullish continuation from our entry at 0.84905 in line with 61.8% Fibonacci retracement towards our take profit at 0.86403 which is a strong resistance and in line with 61.8% Fibonacci retracement. Alternatively, price may break entry structure and head for stop loss, which coincides with the horizontal swing low support at 0.84137.
NZDCAD-- high probability trade set upNZDCAD printed a very clean impulse to the downside recently (visible on the 1D chart), and now price has found support, confirmed it, and began retracing the impulse, already rejecting the .382 level, and confirming the .236 level as new support, beginning the uptrend. Be sure to the like the publishing if you like this set-up, and let me know what you think in the comments below. Happy trading, and good luck!
[13/1/22] NZDCAD Bullish biasPAIR IN FOCUS: NZDCAD
BIAS: BULLISH / LONG
As stated on the chart, price broke under the zone and had retraced strongly, breaking back above the previously broken zone. This rejection shows that price does not really want to head lower.
In another perspective, price could also be forming an inverse H&S pattern as well.
With market shifting back into risk-on sentiment, NZD could continue to strengthen, which would mean an upward move for NZDCAD.
Institutional Demand: NZD/CAD LongHey,
The last chart I want to share today is NZD/CAD which is beautiful in my opinion, just like the previous two pairs shared here. Most of you guys know how I trade and how mechanical everything is what I do, maybe you find similarities from the ideas. Most of my trading approach is even automated, most of the work is just watching this daily time-frame together with the 4hour. For NZD/CAD longs are in the cards, price has been very clear about this and the demand area shared above is the place where I expect price to bounce from.
I wish you a great year! Speak soon, probably.. :)
Kind regards,
Max Nieveld
NZDCAD more downside awaits
Hello there!
If you are keen to learn more on the technical setups,do visit my website at www.shadowingthebb.com !
If you like my analysis and it helped you ,do give me a thumbs ups on tradingview! 🙏
And if you would like to show further support for me, you can gift me some coins on tradingview! 😁
Thank you!
Disclaimers:
The analysis shared through this channel are purely for educational and entertainment purposes only. They are by no means professional advice for individual/s to enter trades for investment or trading purposes.
The author/producer of these content shall not and will not be responsible for any form of financial/physical/assets losses incurred from trades executed from the derived conclusion of the individual from these content shared.
Thank you, and please do your due diligence before any putting on any trades!
NZD/CAD Bearish ContinuationOn the 4hr chart, the NZD/USD seems to have resumed its downtrend, the confirmation has been triggered when the price moved below the 0.8640 support level (psychology zone), due to the rapid dip that occurred based on the market sentiments ahead of today’s data releases.
The previous correction was at the 23.6% fib reversal level, which looks good for the bears, and watching that falls below the MAs used on the chart ascertain a strong trend in the market. If the sellers are able to keep the price lower, then, the next mark is at the early Dec 2021 support zone located at 0.8550.
So, watch out and stay close.
NZD/CAD Full breakdown I will be doing a full breakdown from monthly to daily. Also I will be including Fundamentals that will help us out with the direction as well.
Monthly:
The price is currently rejecting a demand zone which is good because it can be a sign of a rejection to the up-side like it happened in the past.
Weekly:
The price is clearly over extended. When price is over extended we can expect a correction. If we take the fibonacci to measure the possible correction we can see that the .786 fibonacci level is in confluence with structure. We could expect the price to make a correction and reach the price of 0.88151.
Daily:
The price is bearish making lower lows and lower highs. We need to wait for the shift of the price to a bullish price.
Fundamentals:
To see this movement happen the base currency must be stronger than the quote currency for that specific period of time.
-If we look at the commitments of traders we have a good confirmation that base currency is currently stronger than quote. In the COT we can see that institutions closed 3,078 long and opened 7,862 shorts of the quote currency( CAD).
- Institutions opened 2,630 and also opened 5,939 shorts of the base currency(NZD)
-The base currency is stronger than the quote currency. We can definitely expect the movement to the upside.
With all the information that I gather we can see that there is a strong possibility for the movement to the upside happen.
NZDCAD potential short-term bullish bounce | 31st Dec 2021Price broke out of the descending trendline resistance, signifying an overall bullish momentum. We can expect that price would bounce from pivot level in line with 100% Fibonacci projection and 38.2% Fibonacci retracement towards take profit level in line with 100% Fibonacci projection . Our bullish momentum is further supported by the stochastic indicator where the %K line is abiding to the ascending trendline support.
Any opinions, news, research, analyses, prices, other information, or links to third-party sites contained on this website are provided on an "as-is" basis, as general market commentary, and do not constitute investment advice. The market commentary has not been prepared in accordance with legal requirements designed to promote the independence of investment research, and it is therefore not subject to any prohibition on dealing ahead of dissemination. Although this commentary is not produced by an independent source, FXCM takes all sufficient steps to eliminate or prevent any conflicts of interest arising out of the production and dissemination of this communication. The employees of FXCM commit to acting in the clients' best interests and represent their views without misleading, deceiving, or otherwise impairing the clients' ability to make informed investment decisions. For more information about the FXCM's internal organizational and administrative arrangements for the prevention of conflicts, please refer to the Firms' Managing Conflicts Policy. Please ensure that you read and understand our Full Disclaimer and Liability provision concerning the foregoing Information, which can be accessed on the website.
NZD CAD-H4- Riding Trend Up toward 2022Happy New Year All!!! This New Year we are starting with a new strategy (G Money), new TP range and new targets.
NZD CAD H4 chart provided in the most simplistic way for your quick visual assessment and for a very easy reading by anyone.
We have some opened buy positions already with a target TP 3000 pips and estimated completion are time for this trades gonna be around one month. It is just an idea to be tested and the results of success or failure we gonna see in around 4 weeks time.
In the case of success, G Money makes some money! ;)
Strategy has been back tested until I did run out totally dry on historical trading data. Some minor human errors still happens due lack of concentration, tirednesses.
I do wish You all a very Successful trading in 2022!
PS:
Never trust 100% any TA, keep safeguards On, like as SL, TP , Alerts. In two words: Be smart!
TA analysis are not available for a public due testing, fine tuning & adjusting stage still in the progress.
It is not a financial guidance, advice or investment option. It is just an IDEA! ;)