NZDUSD Potential UpsidesHey Traders, in today's trading session we are monitoring NZDUSD for a buying opportunity around 0.60000 zone, NZDUSD is trading in an uptrend and currently is in a correction phase in which it is approaching the trend at 0.60000 support and resistance area.
Trade safe, Joe.
NZD (New Zealand Dollar)
NZDJPY Strong Breakout!
HI,Traders !
NZDJPY is trading in an
Uptrend and the pair has
Made a bullish breakout of
The key horizontal level
Of 87.394 and the breakout
Is confirmed so we are
Bullish biased and we
Will be expecting a further
Bullish move up !
Comment and subscribe to help us grow !

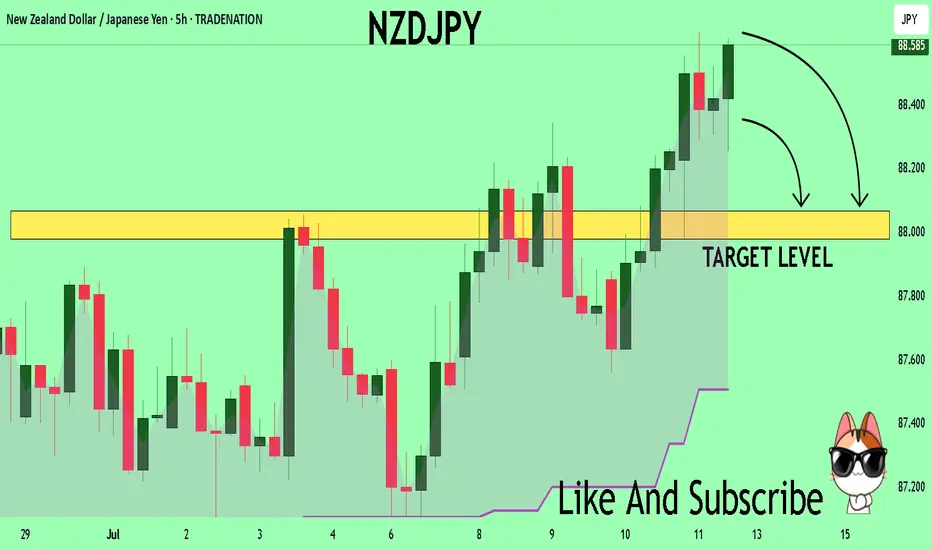
NZDJPY Buyers In Panic! SELL!
My dear followers,
This is my opinion on the NZDJPY next move:
The asset is approaching an important pivot point 88.573
Bias - Bearish
Technical Indicators: Supper Trend generates a clear short signal while Pivot Point HL is currently determining the overall Bearish trend of the market.
Goal - 88.065
About Used Indicators:
For more efficient signals, super-trend is used in combination with other indicators like Pivot Points.
Disclosure: I am part of Trade Nation's Influencer program and receive a monthly fee for using their TradingView charts in my analysis.
———————————
WISH YOU ALL LUCK
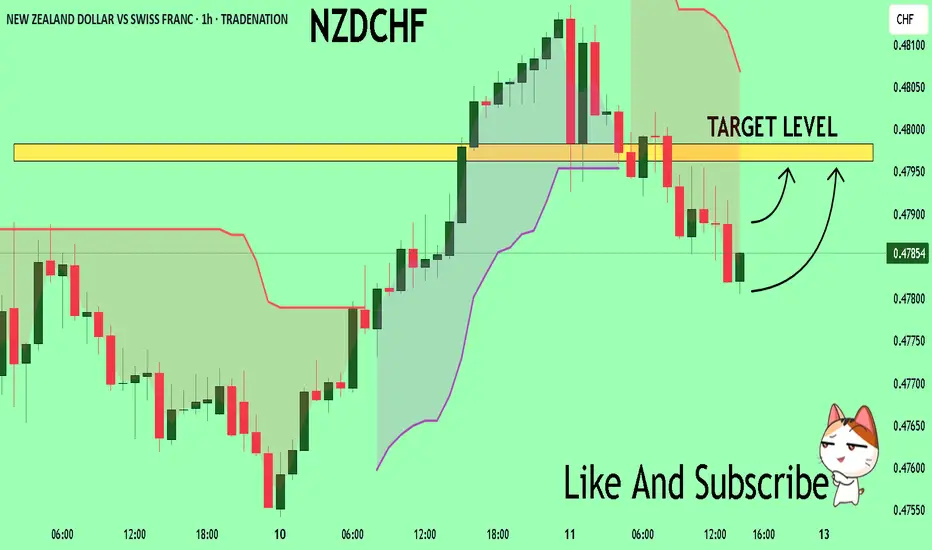
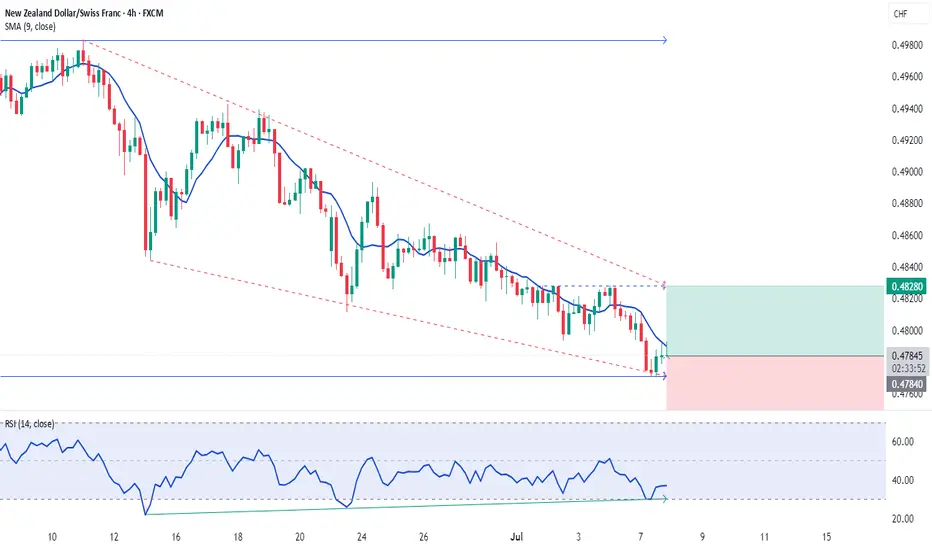
NZDCHF My Opinion! BUY!
My dear friends,
Please, find my technical outlook for NZDCHF below:
The instrument tests an important psychological level 0.4784
Bias - Bullish
Technical Indicators: Supper Trend gives a precise Bullish signal, while Pivot Point HL predicts price changes and potential reversals in the market.
Target - 0.4796
About Used Indicators:
Super-trend indicator is more useful in trending markets where there are clear uptrends and downtrends in price.
Disclosure: I am part of Trade Nation's Influencer program and receive a monthly fee for using their TradingView charts in my analysis.
———————————
WISH YOU ALL LUCK
Bullish reevrsal?EUR/NZD has bounced off the pivot and could rise to the 61.8% Fibonacci resistance.
Pivot: 1.93667
1st Support: 1.93001
1st Resistance: 1.94871
Risk Warning:
Trading Forex and CFDs carries a high level of risk to your capital and you should only trade with money you can afford to lose. Trading Forex and CFDs may not be suitable for all investors, so please ensure that you fully understand the risks involved and seek independent advice if necessary.
Disclaimer:
The above opinions given constitute general market commentary, and do not constitute the opinion or advice of IC Markets or any form of personal or investment advice.
Any opinions, news, research, analyses, prices, other information, or links to third-party sites contained on this website are provided on an "as-is" basis, are intended only to be informative, is not an advice nor a recommendation, nor research, or a record of our trading prices, or an offer of, or solicitation for a transaction in any financial instrument and thus should not be treated as such. The information provided does not involve any specific investment objectives, financial situation and needs of any specific person who may receive it. Please be aware, that past performance is not a reliable indicator of future performance and/or results. Past Performance or Forward-looking scenarios based upon the reasonable beliefs of the third-party provider are not a guarantee of future performance. Actual results may differ materially from those anticipated in forward-looking or past performance statements. IC Markets makes no representation or warranty and assumes no liability as to the accuracy or completeness of the information provided, nor any loss arising from any investment based on a recommendation, forecast or any information supplied by any third-party.

GBPNZD - Look for Long (SWING) 1:3GBPNZD currently shows no signs of reversal, having broken the trendline and heading toward the next supply zone on the higher timeframe. This presents a potential opportunity to go long in line with the prevailing trend, never trade against it. Let’s observe how the price action unfolds.
Disclaimer:
This is simply my personal technical analysis, and you're free to consider it as a reference or disregard it. No obligation! Emphasizing the importance of proper risk management—it can make a significant difference. Wishing you a successful and happy trading experience!

GBP/NZD BEARISH BIAS RIGHT NOW| SHORT
Hello, Friends!
GBP-NZD uptrend evident from the last 1W green candle makes short trades more risky, but the current set-up targeting 2.251 area still presents a good opportunity for us to sell the pair because the resistance line is nearby and the BB upper band is close which indicates the overbought state of the GBP/NZD pair.
Disclosure: I am part of Trade Nation's Influencer program and receive a monthly fee for using their TradingView charts in my analysis.
✅LIKE AND COMMENT MY IDEAS✅

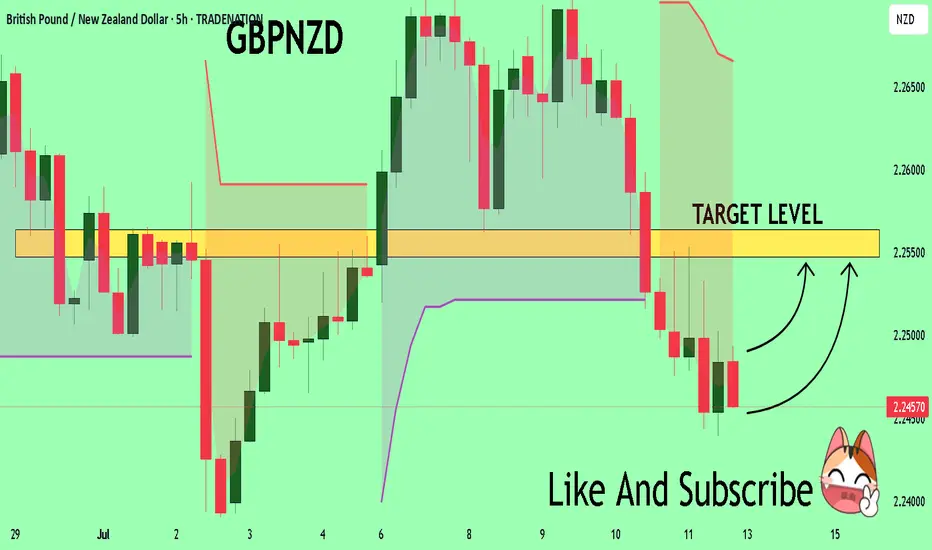
GBPNZD Is Bearish! Sell!
Please, check our technical outlook for GBPNZD.
Time Frame: 1h
Current Trend: Bearish
Sentiment: Overbought (based on 7-period RSI)
Forecast: Bearish
The market is approaching a key horizontal level 2.248.
Considering the today's price action, probabilities will be high to see a movement to 2.241.
P.S
Overbought describes a period of time where there has been a significant and consistent upward move in price over a period of time without much pullback.
Disclosure: I am part of Trade Nation's Influencer program and receive a monthly fee for using their TradingView charts in my analysis.
Like and subscribe and comment my ideas if you enjoy them!

GBPNZD What Next? BUY!
My dear friends,
My technical analysis for GBPNZDis below:
The market is trading on 2.2457 pivot level.
Bias - Bullish
Technical Indicators: Both Super Trend & Pivot HL indicate a highly probable Bullish continuation.
Target - 2.2547
About Used Indicators:
A pivot point is a technical analysis indicator, or calculations, used to determine the overall trend of the market over different time frames.
Disclosure: I am part of Trade Nation's Influencer program and receive a monthly fee for using their TradingView charts in my analysis.
———————————
WISH YOU ALL LUCK
NZD/CHF BEARS ARE STRONG HERE|SHORT
Hello, Friends!
NZD/CHF is trending down which is clear from the red colour of the previous weekly candle. However, the price has locally surged into the overbought territory. Which can be told from its proximity to the BB upper band. Which presents a classical trend following opportunity for a short trade from the resistance line above towards the demand level of 0.475.
Disclosure: I am part of Trade Nation's Influencer program and receive a monthly fee for using their TradingView charts in my analysis.
✅LIKE AND COMMENT MY IDEAS✅

NZD-CHF Broken Wedge Pattern! Buy!
Hello,Traders!
NZD-CHF was trading in a
Narrowing bullish wedge pattern
And now we are finally seeing
A bullish breakout so we are
Bullish biased now and we
Will be expecting a further
Bullish move up after a
Local correction
Buy!
Comment and subscribe to help us grow!
Check out other forecasts below too!
Disclosure: I am part of Trade Nation's Influencer program and receive a monthly fee for using their TradingView charts in my analysis.

NZDCAD Selling Trading IdeaHello Traders
In This Chart nzdcad HOURLY Forex Forecast By FOREX PLANET
today NZDCAD analysis 👆
🟢This Chart includes_ (NZDCAD market update)
🟢What is The Next Opportunity on NZDCAD Market
🟢how to Enter to the Valid Entry With Assurance Profit
This CHART is For Trader's that Want to Improve Their Technical Analysis Skills and Their Trading By Understanding How To Analyze The Market Using Multiple Timeframes and Understanding The Bigger Picture on the Charts

GBPNZD to find buyers at current market price?GBPNZD - 24h expiry
The medium term bias remains bullish.
We look for a temporary move lower. Preferred trade is to buy on dips.
Bespoke support is located at 2.2485.
Risk/Reward is ample to buy at market.
We look to Buy at 2.2485 (stop at 2.2430)
Our profit targets will be 2.2705 and 2.2730
Resistance: 2.2650 / 2.2740 / 2.2790
Support: 2.2500 / 2.2450 / 2.2410
Risk Disclaimer
The trade ideas beyond this page are for informational purposes only and do not constitute investment advice or a solicitation to trade. This information is provided by Signal Centre, a third-party unaffiliated with OANDA, and is intended for general circulation only. OANDA does not guarantee the accuracy of this information and assumes no responsibilities for the information provided by the third party. The information does not take into account the specific investment objectives, financial situation, or particular needs of any particular person. You should take into account your specific investment objectives, financial situation, and particular needs before making a commitment to trade, including seeking advice from an independent financial adviser regarding the suitability of the investment, under a separate engagement, as you deem fit.
You accept that you assume all risks in independently viewing the contents and selecting a chosen strategy.
Where the research is distributed in Singapore to a person who is not an Accredited Investor, Expert Investor or an Institutional Investor, Oanda Asia Pacific Pte Ltd (“OAP“) accepts legal responsibility for the contents of the report to such persons only to the extent required by law. Singapore customers should contact OAP at 6579 8289 for matters arising from, or in connection with, the information/research distributed.

NZDCHF Bullish Breakout!
HI,Traders !
#NZDCHF has formed a bullish
Wedge pattern and now we are
Seeing a bullish breakout which
Is confirmed so we are bullish
Biased and we will be expecting
A further bullish move up !
Comment and subscribe to help us grow !

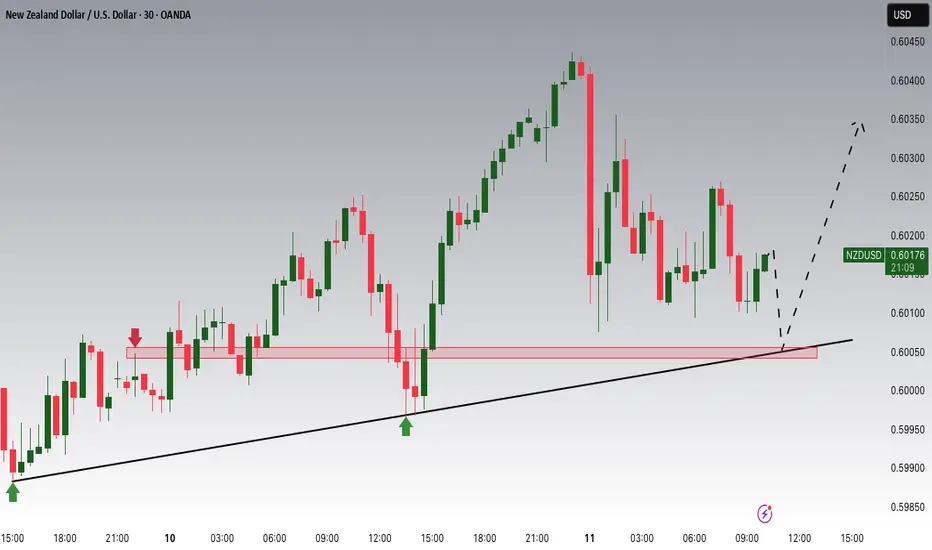
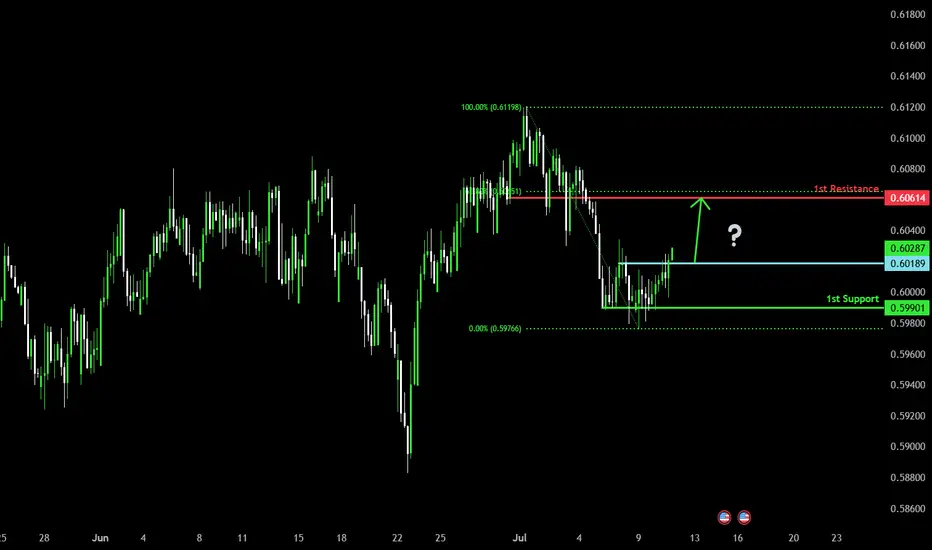
Potential bullish rise?The Kiwi (NZD/USD) is reacting off the pivot and could rise from this level to the 1st resistance.
Pivot: 0.6018
1st Support: 0.5990
1st Resistance: 0.6061
Risk Warning:
Trading Forex and CFDs carries a high level of risk to your capital and you should only trade with money you can afford to lose. Trading Forex and CFDs may not be suitable for all investors, so please ensure that you fully understand the risks involved and seek independent advice if necessary.
Disclaimer:
The above opinions given constitute general market commentary, and do not constitute the opinion or advice of IC Markets or any form of personal or investment advice.
Any opinions, news, research, analyses, prices, other information, or links to third-party sites contained on this website are provided on an "as-is" basis, are intended only to be informative, is not an advice nor a recommendation, nor research, or a record of our trading prices, or an offer of, or solicitation for a transaction in any financial instrument and thus should not be treated as such. The information provided does not involve any specific investment objectives, financial situation and needs of any specific person who may receive it. Please be aware, that past performance is not a reliable indicator of future performance and/or results. Past Performance or Forward-looking scenarios based upon the reasonable beliefs of the third-party provider are not a guarantee of future performance. Actual results may differ materially from those anticipated in forward-looking or past performance statements. IC Markets makes no representation or warranty and assumes no liability as to the accuracy or completeness of the information provided, nor any loss arising from any investment based on a recommendation, forecast or any information supplied by any third-party.
NZDCHF: Will Keep Falling! Here is Why:
It is essential that we apply multitimeframe technical analysis and there is no better example of why that is the case than the current NZDCHF chart which, if analyzed properly, clearly points in the downward direction.
Disclosure: I am part of Trade Nation's Influencer program and receive a monthly fee for using their TradingView charts in my analysis.
❤️ Please, support our work with like & comment! ❤️

GBPNZD | Potential Buy opportunityHey Traders!
We’re taking a shot on GBPNZD — it looks like a solid setup for a move to the upside. Price is currently sitting right on the 4H 50MA, and the 1H 200MA is also aligned at the exact same level, giving this zone even more weight. Our stop loss is tight, risking just a 1:1 minimum, so the downside is limited. On top of that, the Fib is drawn from top to bottom and the 0.5 level lines up perfectly with this area, which adds another layer of confidence. If this zone holds, there’s a good chance we’ll see price continue pushing up.

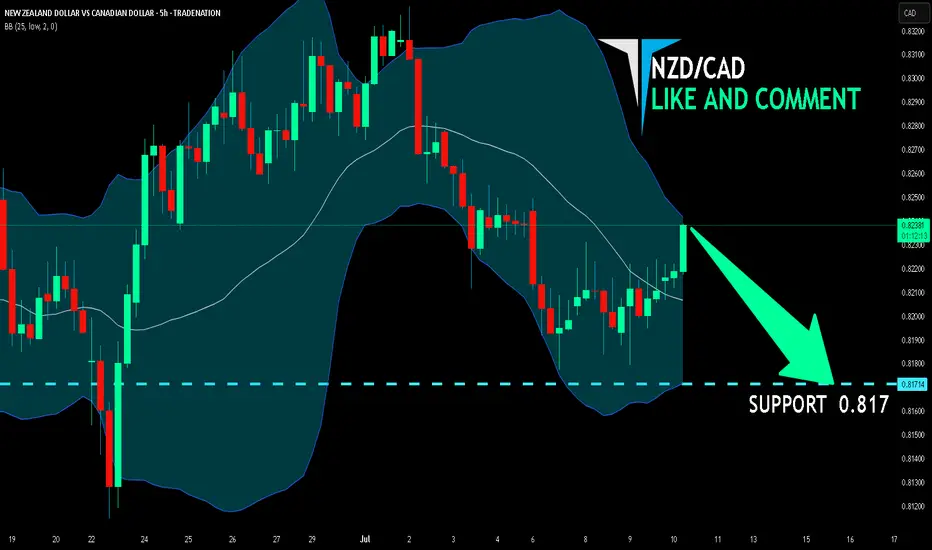
NZD/CAD SELLERS WILL DOMINATE THE MARKET|SHORT
Hello, Friends!
NZD/CAD pair is trading in a local uptrend which we know by looking at the previous 1W candle which is green. On the 5H timeframe the pair is going up too. The pair is overbought because the price is close to the upper band of the BB indicator. So we are looking to sell the pair with the upper BB line acting as resistance. The next target is 0.817 area.
Disclosure: I am part of Trade Nation's Influencer program and receive a monthly fee for using their TradingView charts in my analysis.
✅LIKE AND COMMENT MY IDEAS✅
NZDJPY Long Setup: Institutional Flow Signals Upside to 89.690🗓 Seasonal Outlook
- JPY Seasonal Weakness: Historical trends show July and August tend to be bearish months for the Japanese Yen, reinforcing weakness across JPY pairs.
- NZD Seasonal Strength: July typically supports bullish momentum for NZD, while August may present challenges. However, strength in NZD versus relative JPY softness suggests continued upside potential into early August.
💼 Institutional Positioning (COT Analysis)
- JPY: Commercial traders remain net short, suggesting expectations of further depreciation.
- NZD: Also shows commercial net shorts, yet the price structure aligns more with bullish continuation, hinting at speculative flow favoring NZD upside.
🧠 Technical Analysis
- Liquidity Dynamics:
- Price has cleared multiple buy-side liquidity levels near prior swing highs.
- Sell-side zones continue to hold, indicating strong bullish intent and failed bearish follow-through.
- Market Structure:
- Higher lows and sustained bullish reactions post-liquidity sweeps reinforce an upward trajectory.
- Current structure suggests accumulation and breakout patterns toward the proposed target.
🎯 Target Projection: 89.690

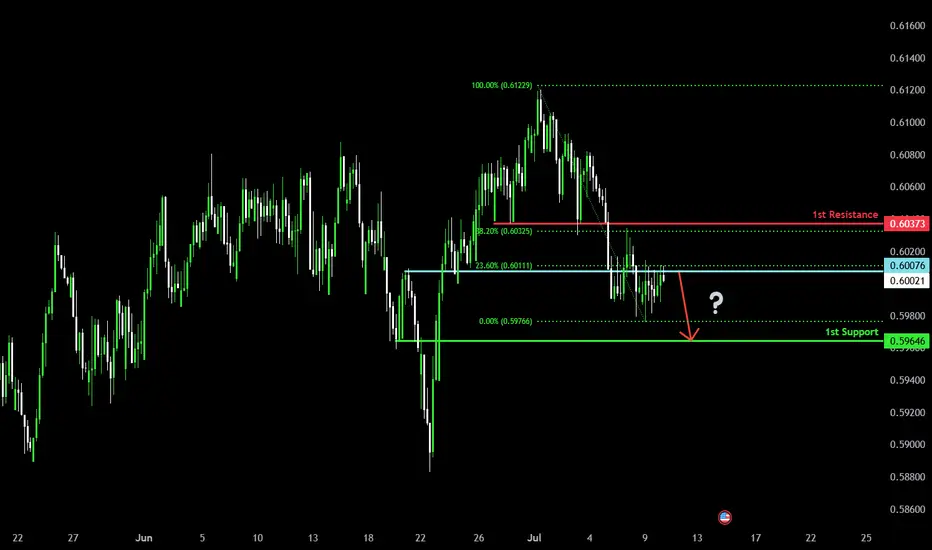
Bearish drop?The Kiwi (NZD/USD) is reacting off the pivot and could drop to the 1st support which is a pullback support.
Pivot: 0.6007
1st Support: 0.5946
1st Resistance: 0.6037
Risk Warning:
Trading Forex and CFDs carries a high level of risk to your capital and you should only trade with money you can afford to lose. Trading Forex and CFDs may not be suitable for all investors, so please ensure that you fully understand the risks involved and seek independent advice if necessary.
Disclaimer:
The above opinions given constitute general market commentary, and do not constitute the opinion or advice of IC Markets or any form of personal or investment advice.
Any opinions, news, research, analyses, prices, other information, or links to third-party sites contained on this website are provided on an "as-is" basis, are intended only to be informative, is not an advice nor a recommendation, nor research, or a record of our trading prices, or an offer of, or solicitation for a transaction in any financial instrument and thus should not be treated as such. The information provided does not involve any specific investment objectives, financial situation and needs of any specific person who may receive it. Please be aware, that past performance is not a reliable indicator of future performance and/or results. Past Performance or Forward-looking scenarios based upon the reasonable beliefs of the third-party provider are not a guarantee of future performance. Actual results may differ materially from those anticipated in forward-looking or past performance statements. IC Markets makes no representation or warranty and assumes no liability as to the accuracy or completeness of the information provided, nor any loss arising from any investment based on a recommendation, forecast or any information supplied by any third-party.
NZDJPY to find buyers at previous support?NZDJPY - 24h expiry
The primary trend remains bullish.
Short term RSI is moving lower.
Preferred trade is to buy on dips.
Risk/Reward would be poor to call a buy from current levels.
Bespoke support is located at 87.50.
We look to Buy at 87.50 (stop at 87.30)
Our profit targets will be 88.30 and 88.50
Resistance: 88.00 / 88.30 / 88.50
Support: 87.50 / 87.20 / 87.00
Risk Disclaimer
The trade ideas beyond this page are for informational purposes only and do not constitute investment advice or a solicitation to trade. This information is provided by Signal Centre, a third-party unaffiliated with OANDA, and is intended for general circulation only. OANDA does not guarantee the accuracy of this information and assumes no responsibilities for the information provided by the third party. The information does not take into account the specific investment objectives, financial situation, or particular needs of any particular person. You should take into account your specific investment objectives, financial situation, and particular needs before making a commitment to trade, including seeking advice from an independent financial adviser regarding the suitability of the investment, under a separate engagement, as you deem fit.
You accept that you assume all risks in independently viewing the contents and selecting a chosen strategy.
Where the research is distributed in Singapore to a person who is not an Accredited Investor, Expert Investor or an Institutional Investor, Oanda Asia Pacific Pte Ltd (“OAP“) accepts legal responsibility for the contents of the report to such persons only to the extent required by law. Singapore customers should contact OAP at 6579 8289 for matters arising from, or in connection with, the information/research distributed.

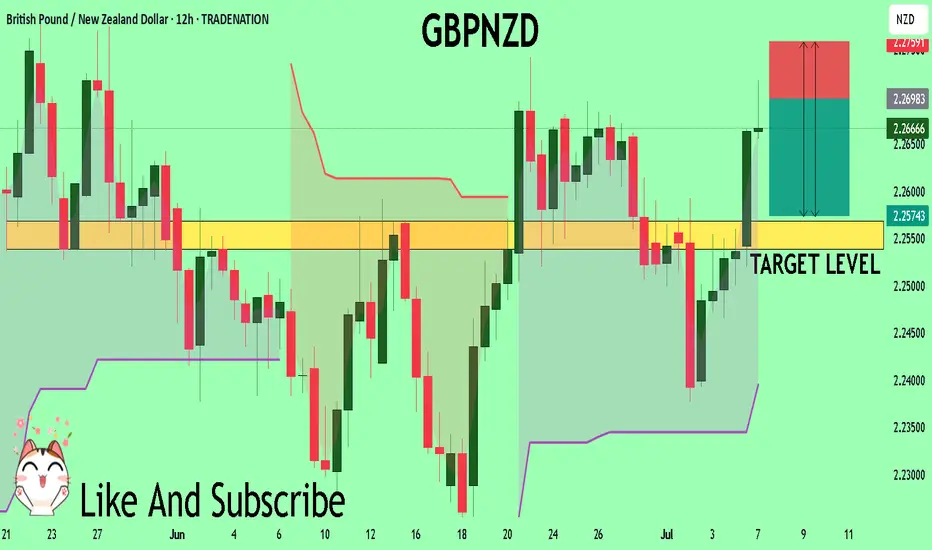
GBPNZD Set To Fall! SELL!
My dear subscribers,
This is my opinion on the GBPNZD next move:
The instrument tests an important psychological level 2.2694
Bias - Bearish
Technical Indicators: Supper Trend gives a precise Bearish signal, while Pivot Point HL predicts price changes and potential reversals in the market.
Target - 2.2568
My Stop Loss - 2.2759
About Used Indicators:
On the subsequent day, trading above the pivot point is thought to indicate ongoing bullish sentiment, while trading below the pivot point indicates bearish sentiment.
Disclosure: I am part of Trade Nation's Influencer program and receive a monthly fee for using their TradingView charts in my analysis.
———————————
WISH YOU ALL LUCK