Heading into overlap resistance?The Kiwi (NZD/USD) is rising towards the pivot, which is overlap resistance, and could reverse to the 1st support.
Pivot: 0.5930
1st Support: 0.5893
1st Resistance: 0.5951
Risk Warning:
Trading Forex and CFDs carries a high level of risk to your capital and you should only trade with money you can afford to lose. Trading Forex and CFDs may not be suitable for all investors, so please ensure that you fully understand the risks involved and seek independent advice if necessary.
Disclaimer:
The above opinions given constitute general market commentary, and do not constitute the opinion or advice of IC Markets or any form of personal or investment advice.
Any opinions, news, research, analyses, prices, other information, or links to third-party sites contained on this website are provided on an "as-is" basis, are intended only to be informative, is not an advice nor a recommendation, nor research, or a record of our trading prices, or an offer of, or solicitation for a transaction in any financial instrument and thus should not be treated as such. The information provided does not involve any specific investment objectives, financial situation and needs of any specific person who may receive it. Please be aware, that past performance is not a reliable indicator of future performance and/or results. Past Performance or Forward-looking scenarios based upon the reasonable beliefs of the third-party provider are not a guarantee of future performance. Actual results may differ materially from those anticipated in forward-looking or past performance statements. IC Markets makes no representation or warranty and assumes no liability as to the accuracy or completeness of the information provided, nor any loss arising from any investment based on a recommendation, forecast or any information supplied by any third-party.
NZD (New Zealand Dollar)

NZDJPY to continue in the downward move?NZDJPY - 24h expiry
The medium term bias remains bearish.
Short term RSI is moving higher.
We look for a temporary move higher.
Preferred trade is to sell into rallies.
Bespoke resistance is located at 85.25.
We look to Sell at 85.25 (stop at 85.55)
Our profit targets will be 84.20 and 84.00
Resistance: 85.25 / 85.70 / 86.10
Support: 84.60 / 84.20 / 84.00
Risk Disclaimer
The trade ideas beyond this page are for informational purposes only and do not constitute investment advice or a solicitation to trade. This information is provided by Signal Centre, a third-party unaffiliated with OANDA, and is intended for general circulation only. OANDA does not guarantee the accuracy of this information and assumes no responsibilities for the information provided by the third party. The information does not take into account the specific investment objectives, financial situation, or particular needs of any particular person. You should take into account your specific investment objectives, financial situation, and particular needs before making a commitment to trade, including seeking advice from an independent financial adviser regarding the suitability of the investment, under a separate engagement, as you deem fit.
You accept that you assume all risks in independently viewing the contents and selecting a chosen strategy.
Where the research is distributed in Singapore to a person who is not an Accredited Investor, Expert Investor or an Institutional Investor, Oanda Asia Pacific Pte Ltd (“OAP“) accepts legal responsibility for the contents of the report to such persons only to the extent required by law. Singapore customers should contact OAP at 6579 8289 for matters arising from, or in connection with, the information/research distributed.

NZD_CAD LONG SIGNAL|
✅NZD_CAD is going down to
Retest a horizontal support of 0.8160
Which makes me locally bullish biased
And I think that we will see a rebound
And a move up from the level
So we can go long wit the
TP of 0.8206 and the SL of 0.8152
LONG🚀
✅Like and subscribe to never miss a new idea!✅
Disclosure: I am part of Trade Nation's Influencer program and receive a monthly fee for using their TradingView charts in my analysis.

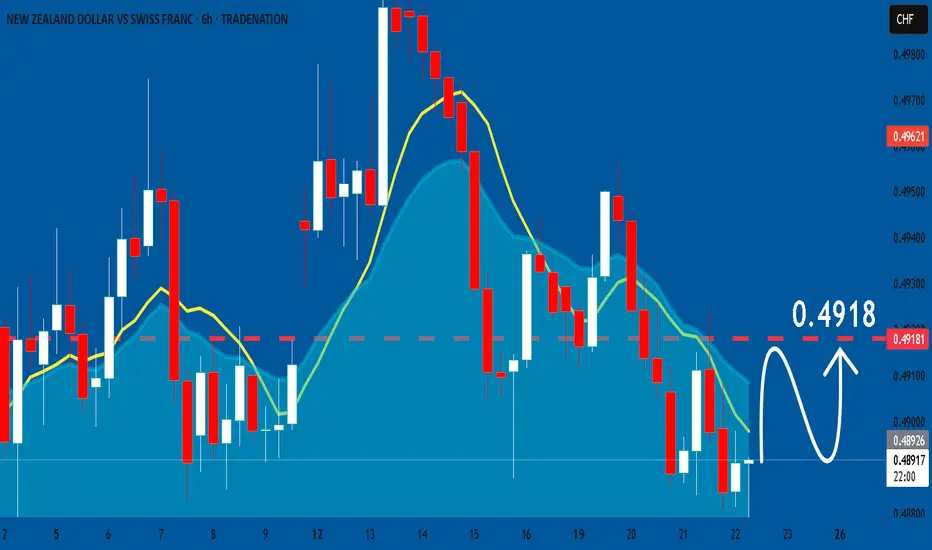
NZDJPY: Long Signal with Entry/SL/TP
NZDJPY
- Classic bullish formation
- Our team expects growth
SUGGESTED TRADE:
Swing Trade
Buy NZDJPY
Entry Level - 84.918
Sl - 84.386
Tp - 85.905
Our Risk - 1%
Start protection of your profits from lower levels
Disclosure: I am part of Trade Nation's Influencer program and receive a monthly fee for using their TradingView charts in my analysis.
❤️ Please, support our work with like & comment! ❤️

NZDCHF: Market Sentiment & Forecast
The charts are full of distraction, disturbance and are a graveyard of fear and greed which shall not cloud our judgement on the current state of affairs in the NZDCHF pair price action which suggests a high likelihood of a coming move up.
Disclosure: I am part of Trade Nation's Influencer program and receive a monthly fee for using their TradingView charts in my analysis.
❤️ Please, support our work with like & comment! ❤️
NZD/JPY Breaks Wedge Structure – Bearish Setup Targets 82.42NZD/JPY has broken down from a rising wedge and failed to reclaim upper support, now acting as resistance. The structure is cleanly bearish on the 4H chart, with rejection near 85.60 and a confirmed lower high. Weak New Zealand data and rising safe-haven demand for JPY add weight to this technical setup. Price looks poised to extend toward 82.42 and possibly 80.99 if momentum builds. Bearish bias is valid unless price closes above 87.17.
🔍 Technical Analysis
Chart Pattern: Rising wedge → broken → retest failed
Bear Flag: Forming below wedge base, suggesting further downside
Resistance Area: 85.60–87.17
Bearish Structure:
Lower highs and bearish candle formations
Price unable to reclaim former support trendline
Support Targets:
First TP: 84.00 – minor support, fib confluence
Second TP: 82.42 – March swing low
Final TP: 81.00 zone – next fib cluster
🌍 Macro Fundamentals
🇳🇿 New Zealand Dollar (NZD)
Retail Sales missed: 0.0% vs 0.9% forecast → consumer sector is slowing
Core Retail Sales weak: 0.7% vs 1.4%
Dairy auction (GDT Index) down -0.9% → key export underperforming
Implication: Risk of slower growth → RBNZ may shift toward neutral/dovish stance
🇯🇵 Japanese Yen (JPY)
JPY supported by risk-off flows due to:
U.S. credit downgrade
Iran-US nuclear tension
Declining global PMI forecasts
Yen strengthens as traders seek safe havens despite BoJ’s dovish baseline
🎯 Trade Plan
Bias: Bearish
Entry Zone: 85.50–85.60 (confirmation area)
Targets:
TP1: 84.00
TP2: 82.42
TP3: 81.00
Stop Loss: Above 87.17 (invalidates wedge breakdown)
⚠️ What to Watch
China sentiment or surprise stimulus (may support NZD)
Sharp equity rallies (could reduce JPY demand short-term)
If NZD/JPY closes above 86.00, reduce position or stay out
🧭 Conclusion
NZD/JPY has rolled over from a broken rising wedge, now forming a clean bearish continuation structure. Weak NZ data and macro risk flows into JPY favor downside extension. This setup offers clear levels, defined risk, and macro alignment — ideal for disciplined short entries.

NZDJPY On The Rise! BUY!
My dear subscribers,
This is my opinion on the NZDJPY next move:
The instrument tests an important psychological level 85.502
Bias - Bullish
Technical Indicators: Supper Trend gives a precise Bullish signal, while Pivot Point HL predicts price changes and potential reversals in the market.
Target - 85.708
About Used Indicators:
On the subsequent day, trading above the pivot point is thought to indicate ongoing bullish sentiment, while trading below the pivot point indicates bearish sentiment.
Disclosure: I am part of Trade Nation's Influencer program and receive a monthly fee for using their TradingView charts in my analysis.
———————————
WISH YOU ALL LUCK

NZD/USD TRADING PLAN – MAY 21 | RETEST OR CONTINUATION?NZD/USD TRADING PLAN – MAY 21 | RETEST OR CONTINUATION? 🔍
After several steady bullish sessions, NZD/USD is pulling back slightly from the 0.5961 resistance zone. The pair remains within a well-defined ascending channel on the H1 chart and is approaching a key support area around 0.5910 — a zone that could trigger a technical bounce and continuation of the current bullish trend.
🌍 MACRO CONTEXT:
The US Dollar Index (DXY) is showing signs of weakness following disappointing CPI and PPI data. This opens up room for commodity currencies like NZD to recover further.
Meanwhile, New Zealand's domestic consumption data has exceeded expectations, and the RBNZ continues to maintain a stable policy outlook — a medium-term bullish sign for NZD.
Market sentiment is leaning cautiously against the USD, especially as the Fed holds its “no cut but no hike” stance — boosting interest in alternative currencies.
📊 TECHNICAL OUTLOOK (H1):
NZD/USD is trading within an ascending price channel.
EMA 13 is above EMA 34 and EMA 200 — a positive short-term trend signal.
Two important zones to watch today are 0.5910 (key support) and 0.5961 (key resistance).
🎯 TRADE SETUPS FOR TODAY:
✅ SCENARIO A – BUY THE RETEST:
If price tests the 0.5910 zone and shows strong reaction:
BUY ZONE: 0.5910 – 0.5915
SL: 0.5890
TP: 0.5960 → 0.5980 → 0.6000 → 0.6006
→ This zone aligns with ascending channel support + prior FVG → strong rebound probability.
✅ SCENARIO B – BREAKOUT & CONTINUATION:
If price breaks and holds above 0.5961:
BUY SCALP: 0.5965 – 0.5970
SL: 0.5950
TP: 0.5980 → 0.6000 → 0.6006
❌ SCENARIO C – BEARISH BREAKDOWN:
If price fails to hold above 0.5910 and closes H1 candle below it:
SELL SCALP: 0.5900 – 0.5895
SL: 0.5915
TP: 0.5870 → 0.5850 → 0.5820
📌 FINAL THOUGHTS:
NZD/USD is at a critical decision point — this could be a retest before continuation to 0.6000 or the beginning of a deeper drop.
Watch the 0.5910 level closely to determine market direction.
⚠️ Risk management is key — high volatility expected as U.S. PMI data is set for release during today’s NY session.
🧠 Be patient. Let price come to your zone. React, don’t predict.

NZDUSD to find sellers at market price?NZDUSD - 24h expiry
Indecisive price action has resulted in sideways congestion on the intraday chart.
Pivot resistance is at 0.5925.
A move through 0.5875 will confirm the bearish momentum.
The measured move target is 0.5750.
Risk/Reward would be poor to call a sell from current levels.
We look to Sell at 0.5925 (stop at 0.5975)
Our profit targets will be 0.5805 and 0.5750
Resistance: 0.5925 / 0.5950 / 0.5975
Support: 0.5850 / 0.5800 / 0.5750
Risk Disclaimer
The trade ideas beyond this page are for informational purposes only and do not constitute investment advice or a solicitation to trade. This information is provided by Signal Centre, a third-party unaffiliated with OANDA, and is intended for general circulation only. OANDA does not guarantee the accuracy of this information and assumes no responsibilities for the information provided by the third party. The information does not take into account the specific investment objectives, financial situation, or particular needs of any particular person. You should take into account your specific investment objectives, financial situation, and particular needs before making a commitment to trade, including seeking advice from an independent financial adviser regarding the suitability of the investment, under a separate engagement, as you deem fit.
You accept that you assume all risks in independently viewing the contents and selecting a chosen strategy.
Where the research is distributed in Singapore to a person who is not an Accredited Investor, Expert Investor or an Institutional Investor, Oanda Asia Pacific Pte Ltd (“OAP“) accepts legal responsibility for the contents of the report to such persons only to the extent required by law. Singapore customers should contact OAP at 6579 8289 for matters arising from, or in connection with, the information/research distributed.

GBPNZD Pushing itself in a buy directionHello Traders
In This Chart GBPNZD 4 HOURLY Forex Forecast By FOREX PLANET
today GBPNZD analysis 👆
🟢This Chart includes GBPNZD market update)
🟢What is The Next Opportunity on EURNZD Market
🟢how to Enter to the Valid Entry With Assurance Profit
This CHART is For Trader's that Want to Improve Their Technical Analysis Skills and Their Trading By Understanding How To Analyze The Market Using Multiple Timeframes and Understanding The Bigger Picture on the Charts
NZDJPY - Off We Go... Again!Hello TradingView Family / Fellow Traders. This is Richard, also known as theSignalyst.
📈NZDJPY has been overall bullish trading within the rising channel marked in red.
Moreover, the green zone is a strong demand!
🏹 Thus, the highlighted blue circle is a strong area to look for buy setups as it is the intersection of demand and lower red trendline acting as a non-horizontal support.
📚 As per my trading style:
As #NZDJPY approaches the blue circle zone, I will be looking for bullish reversal setups (like a double bottom pattern, trendline break , and so on...)
📚 Always follow your trading plan regarding entry, risk management, and trade management.
Good luck!
All Strategies Are Good; If Managed Properly!
~Rich
Disclosure: I am part of Trade Nation's Influencer program and receive a monthly fee for using their TradingView charts in my analysis.

NZDJPY Will Go Up From Support! Buy!
Please, check our technical outlook for NZDJPY.
Time Frame: 1h
Current Trend: Bullish
Sentiment: Oversold (based on 7-period RSI)
Forecast: Bullish
The price is testing a key support 85.439.
Current market trend & oversold RSI makes me think that buyers will push the price. I will anticipate a bullish movement at least to 85.706 level.
P.S
We determine oversold/overbought condition with RSI indicator.
When it drops below 30 - the market is considered to be oversold.
When it bounces above 70 - the market is considered to be overbought.
Disclosure: I am part of Trade Nation's Influencer program and receive a monthly fee for using their TradingView charts in my analysis.
Like and subscribe and comment my ideas if you enjoy them!

NZD/CAD BUYERS WILL DOMINATE THE MARKET|LONG
Hello, Friends!
NZD-CAD downtrend evident from the last 1W red candle makes longs trades more risky, but the current set-up targeting 0.827 area still presents a good opportunity for us to buy the pair because the support line is nearby and the BB lower band is close which indicates the oversold state of the NZD/CAD pair.
Disclosure: I am part of Trade Nation's Influencer program and receive a monthly fee for using their TradingView charts in my analysis.
✅LIKE AND COMMENT MY IDEAS✅

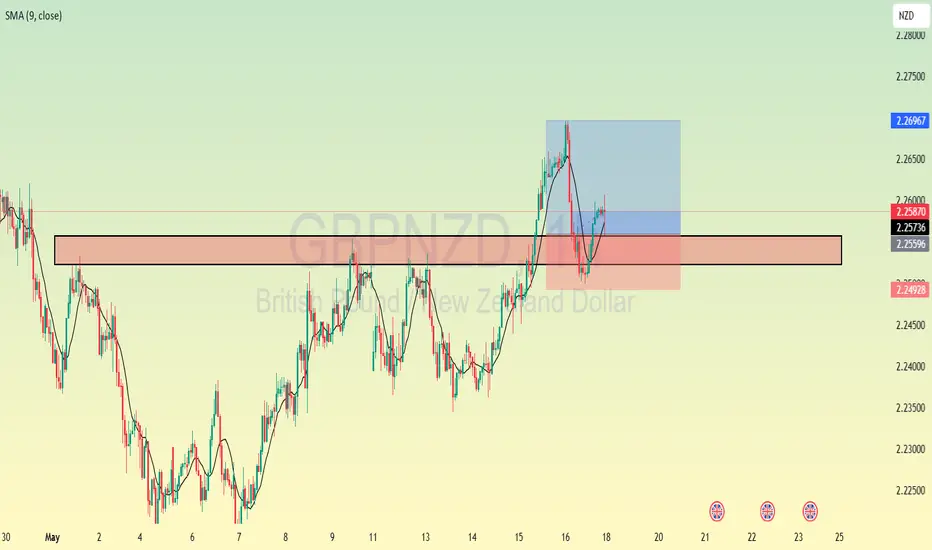
GBP_NZD WILL GROW|LONG|
✅GBP_NZD has retested a key support level of 2.2520
And as the pair is already making a bullish rebound
A move up to retest the supply level above at 2.2600 is likely
LONG🚀
✅Like and subscribe to never miss a new idea!✅
Disclosure: I am part of Trade Nation's Influencer program and receive a monthly fee for using their TradingView charts in my analysis.

Potential bearish drop?The Kiwi (NZD/USD) has rejected off the pivot that lines up with the 127.2% Fibonacci extension and could drop to the pullback support.
Pivot: 0.5933
1st Support: 0.5893
1st Resistance: 0.5968
Risk Warning:
Trading Forex and CFDs carries a high level of risk to your capital and you should only trade with money you can afford to lose. Trading Forex and CFDs may not be suitable for all investors, so please ensure that you fully understand the risks involved and seek independent advice if necessary.
Disclaimer:
The above opinions given constitute general market commentary, and do not constitute the opinion or advice of IC Markets or any form of personal or investment advice.
Any opinions, news, research, analyses, prices, other information, or links to third-party sites contained on this website are provided on an "as-is" basis, are intended only to be informative, is not an advice nor a recommendation, nor research, or a record of our trading prices, or an offer of, or solicitation for a transaction in any financial instrument and thus should not be treated as such. The information provided does not involve any specific investment objectives, financial situation and needs of any specific person who may receive it. Please be aware, that past performance is not a reliable indicator of future performance and/or results. Past Performance or Forward-looking scenarios based upon the reasonable beliefs of the third-party provider are not a guarantee of future performance. Actual results may differ materially from those anticipated in forward-looking or past performance statements. IC Markets makes no representation or warranty and assumes no liability as to the accuracy or completeness of the information provided, nor any loss arising from any investment based on a recommendation, forecast or any information supplied by any third-party.

NZDJPY to find sellers at previous resistance?NZDJPY - 24h expiry
Price action looks to be forming a top.
Short term RSI is moving higher.
We look for a temporary move higher.
Preferred trade is to sell into rallies.
Bespoke resistance is located at 86.35.
We look to Sell at 86.35 (stop at 86.65)
Our profit targets will be 85.30 and 85.00
Resistance: 86.30 / 86.80 / 87.20
Support: 85.30 / 85.00 / 84.50
Risk Disclaimer
The trade ideas beyond this page are for informational purposes only and do not constitute investment advice or a solicitation to trade. This information is provided by Signal Centre, a third-party unaffiliated with OANDA, and is intended for general circulation only. OANDA does not guarantee the accuracy of this information and assumes no responsibilities for the information provided by the third party. The information does not take into account the specific investment objectives, financial situation, or particular needs of any particular person. You should take into account your specific investment objectives, financial situation, and particular needs before making a commitment to trade, including seeking advice from an independent financial adviser regarding the suitability of the investment, under a separate engagement, as you deem fit.
You accept that you assume all risks in independently viewing the contents and selecting a chosen strategy.
Where the research is distributed in Singapore to a person who is not an Accredited Investor, Expert Investor or an Institutional Investor, Oanda Asia Pacific Pte Ltd (“OAP“) accepts legal responsibility for the contents of the report to such persons only to the extent required by law. Singapore customers should contact OAP at 6579 8289 for matters arising from, or in connection with, the information/research distributed.

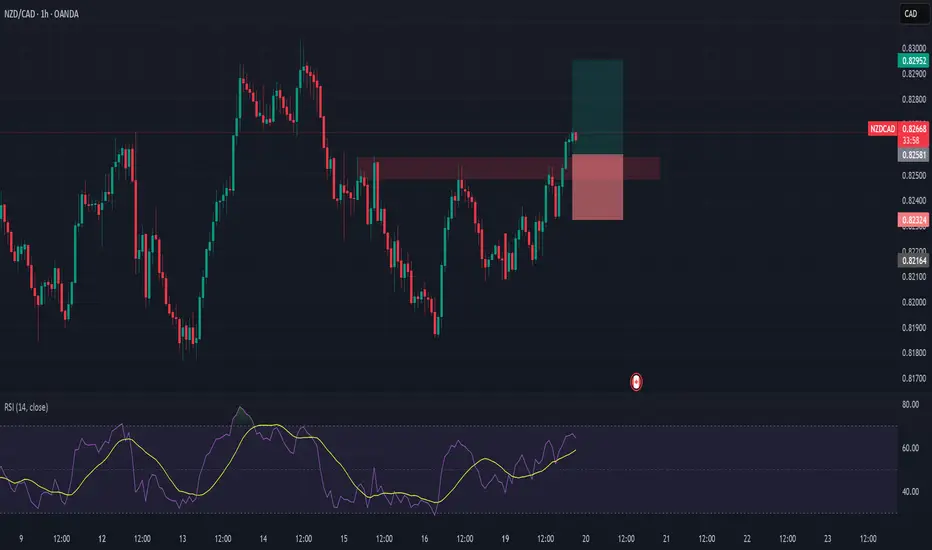
NZDCAD Long – Breakout + Retest Opportunity Backed by Macros🔹 Pair: NZD/CAD
🔹 Timeframe: 1H
🔹 Direction: Long
🔹 Status: Breakout of resistance → waiting for retest at turncoat support
🔹 Entry Zone (Planned): 0.8250–0.8260
NZD is the top gainer this week with strong conditional momentum and seasonal strength. CAD is stagnating under weak macro support. We're now watching for a pullback to the breakout zone for an ideal long entry.
Will look to enter between 0.8250–0.8260, SL under 0.8230, and aiming for 0.8295+.
📊 Macro & Fundamental Confluence
🇳🇿 NZD – Bullish
Biggest Weekly Gainer: Conditional score surged 🚀 from 8 → 13
Seasonal Bias: Strong buy signal from mid-May onward
Central Bank: RBNZ remains hawkish amid stable inflation targets
Risk-On Regime: VIX < 20 favors high-beta currencies like NZD
🇨🇦 CAD – Bearish
Policy vs Data Mismatch: BoC hawkish, but weak retail & CPI data
Global Headwinds: Commodity weakness and trade risks weigh on CAD
🧩 Confluences
✅ NZD macro & conditional strength
✅ CAD stagnation
✅ Risk-on favors NZD
✅ Technical breakout + higher high confirmed
Bearish reversal?NZD/USD has rejected off the resistance level which is an overlap resistance that lines up with the 127.2% Fibonacci extension and the 61.8% Fibonacci retracement and could drop from this level to our take profit.
Entry: 0.5933
Why we like it:
There is an overlap resistance level that lines up with the 61.8% Fibonacci retracement and the 127.2% Fibonacci extension.
Stop loss: 0.5960
Why we like it:
There is a pullback resistance level.
Take profit: 0.5893
Why we like it:
There is a pullback support level that lines up with the 61.8% Fibonacci retracement.
Enjoying your TradingView experience? Review us!
Please be advised that the information presented on TradingView is provided to Vantage (‘Vantage Global Limited’, ‘we’) by a third-party provider (‘Everest Fortune Group’). Please be reminded that you are solely responsible for the trading decisions on your account. There is a very high degree of risk involved in trading. Any information and/or content is intended entirely for research, educational and informational purposes only and does not constitute investment or consultation advice or investment strategy. The information is not tailored to the investment needs of any specific person and therefore does not involve a consideration of any of the investment objectives, financial situation or needs of any viewer that may receive it. Kindly also note that past performance is not a reliable indicator of future results. Actual results may differ materially from those anticipated in forward-looking or past performance statements. We assume no liability as to the accuracy or completeness of any of the information and/or content provided herein and the Company cannot be held responsible for any omission, mistake nor for any loss or damage including without limitation to any loss of profit which may arise from reliance on any information supplied by Everest Fortune Group.

GBPNZD: Bears Will Push Lower
GBPNZD
- Classic bearish formation
- Our team expects fall
SUGGESTED TRADE:
Swing Trade
Sell GBPNZD
Entry Level - 2.2555
Sl - 2.2624
Tp - 2.2425
Our Risk - 1%
Start protection of your profits from lower levels
Disclosure: I am part of Trade Nation's Influencer program and receive a monthly fee for using their TradingView charts in my analysis.
❤️ Please, support our work with like & comment! ❤️

NZD/JPY BEARISH BIAS RIGHT NOW| SHORT
Hello, Friends!
NZD/JPY pair is trading in a local downtrend which know by looking at the previous 1W candle which is red. On the 1D timeframe the pair is going up. The pair is overbought because the price is close to the upper band of the BB indicator. So we are looking to sell the pair with the upper BB line acting as resistance. The next target is 83.261 area.
Disclosure: I am part of Trade Nation's Influencer program and receive a monthly fee for using their TradingView charts in my analysis.
✅LIKE AND COMMENT MY IDEAS✅

NZDJPY Long: Fib 0.786 Retest + Strong NZD Momentum🔹 Pair: NZD/JPY
🔹 Timeframe: Daily
🔹 Direction: Long
🔹 Status: Price holding Fib 0.786 retracement level (bullish structure intact)
🔹 Entry Zone: ~85.50–85.60 (Live entry)
📊 Fundamental Confluence
🇳🇿 NZD – Bullish Momentum
Conditional Score Jump: 🚀 From 8 → 13 (Strongest improvement this week).
Seasonality: 🔼 Strong seasonal bias from mid-May onward.
CB Stance: Hawkish — RBNZ cautious but maintains restrictive policy.
Global Risk-On: VIX < 20 supports high-beta currencies like NZD.
🇯🇵 JPY – Weakening
BoJ Outlook: Delayed inflation target to 2027 = no urgency to tighten.
Score Flat: Minor improvement (11 → 12), not enough to change bias.
Risk Sentiment: Safe-haven demand dropping, weakening JPY.
Macro Drag: Japan underperforming vs G7 counterparts.

NZDJPY, Long, 1D✅ NZDJPY clearly broke a key resistance level, which is now being retested as support.
This retest is likely to trigger a bullish continuation, signaling the start of a new upward trend.
LONG 🚀
✅ Like and subscribe to never miss a new analysis! ✅

NZD-JPY Bearish Breakout! Sell!
Hello,Traders!
NZD-JPY made a bearish
Breakout of the rising support
Line then made a retest of the
New resistance and is going
Down now so we are bearish
Biased and we will be expecting
A further bearish move down
Sell!
Comment and subscribe to help us grow!
Check out other forecasts below too!
Disclosure: I am part of Trade Nation's Influencer program and receive a monthly fee for using their TradingView charts in my analysis.
