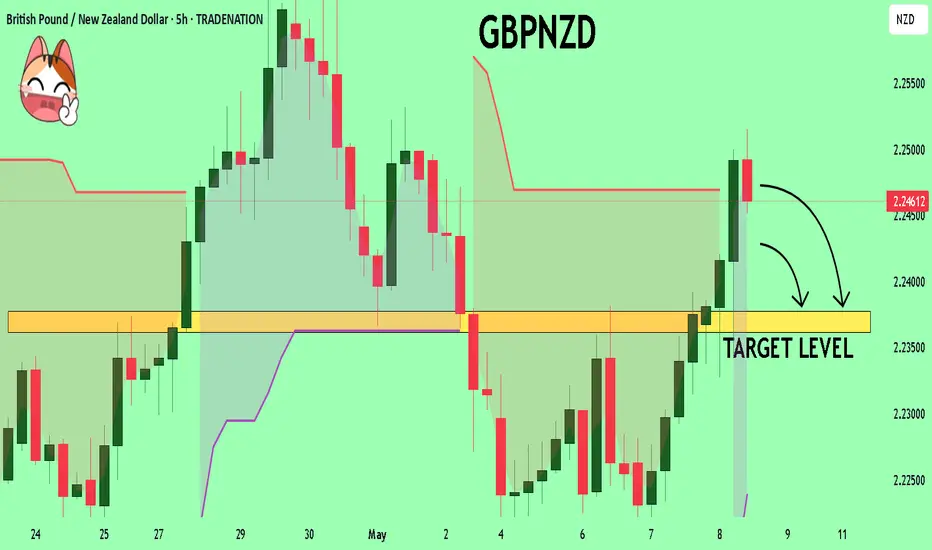
GBPNZD Trading Opportunity! SELL!
My dear followers,
I analysed this chart on GBPNZD and concluded the following:
The market is trading on 2.2456 pivot level.
Bias - Bearish
Technical Indicators: Both Super Trend & Pivot HL indicate a highly probable Bearish continuation.
Target - 2.2377
About Used Indicators:
A super-trend indicator is plotted on either above or below the closing price to signal a buy or sell. The indicator changes color, based on whether or not you should be buying. If the super-trend indicator moves below the closing price, the indicator turns green, and it signals an entry point or points to buy.
Disclosure: I am part of Trade Nation's Influencer program and receive a monthly fee for using their TradingView charts in my analysis.
———————————
WISH YOU ALL LUCK
NZD (New Zealand Dollar)
GBP/NZD SHORT FROM RESISTANCE
Hello, Friends!
GBP/NZD is trending down which is evident from the red colour of the previous weekly candle. However, the price has locally surged into the overbought territory. Which can be told from its proximity to the BB upper band. Which presents a great trend following opportunity for a short trade from the resistance line above towards the demand level of 2.228.
Disclosure: I am part of Trade Nation's Influencer program and receive a monthly fee for using their TradingView charts in my analysis.
✅LIKE AND COMMENT MY IDEAS✅

NZDCAD - Short Term Sell Trade Update!!!Hi Traders, on May 7th I shared this idea "NZDCAD - Looking To Sell Pullbacks In The Short Term"
I expected to see retraces and further continuation lower. You can read the full post using the link above.
Retrace and push lower happened as per the plan!!!
If you enjoy this idea, don’t forget to LIKE 👍, FOLLOW ✅, SHARE 🙌, and COMMENT ✍! Drop your thoughts and charts below to keep the discussion going. Your support helps keep this content free and reach more people! 🚀
-------------------------------------------------------------------------------------------------------------------
Disclosure: I am part of Trade Nation's Influencer program and receive a monthly fee for using their TradingView charts in my analysis.

NZDJPY Will Move Lower! Short!
Here is our detailed technical review for NZDJPY.
Time Frame: 4h
Current Trend: Bearish
Sentiment: Overbought (based on 7-period RSI)
Forecast: Bearish
The market is trading around a solid horizontal structure 85.876.
The above observations make me that the market will inevitably achieve 85.270 level.
P.S
We determine oversold/overbought condition with RSI indicator.
When it drops below 30 - the market is considered to be oversold.
When it bounces above 70 - the market is considered to be overbought.
Disclosure: I am part of Trade Nation's Influencer program and receive a monthly fee for using their TradingView charts in my analysis.
Like and subscribe and comment my ideas if you enjoy them!

SHORT ON NZD/CHFNZD/CHF is currently falling from a major resistance level.
I will be selling this pair to the next level of demand/support for 150-200 pips.

Possible Move For NZD JPYLooking at the Daily, 1hr and 15m charts. I feel moves will continue to be bearish. Heading into fill the 15m FVG. Possible small move up from here before continuing down to fill the Daily FVG and aiming for the next big price zone of around 83.413. Let's see.

GBPNZD | 05.05.2025BUY 2.22500 | STOP 2.21000 | TAKE 2.24400 | Technical view: the pair is trading in a wide mid-month range. The New Zealand Dollar is likely to be under pressure this week. We expect the price to rise again to the area of 2.25000.

Falling towards pullback support?The Kiwi (NZD/USD) is falling towards the pivot which acts as a pullback support and could bounce to the 1st resistance.
Pivot: 0.5902
1st Support: 0.5852
1st Resistance: 0.6020
Risk Warning:
Trading Forex and CFDs carries a high level of risk to your capital and you should only trade with money you can afford to lose. Trading Forex and CFDs may not be suitable for all investors, so please ensure that you fully understand the risks involved and seek independent advice if necessary.
Disclaimer:
The above opinions given constitute general market commentary, and do not constitute the opinion or advice of IC Markets or any form of personal or investment advice.
Any opinions, news, research, analyses, prices, other information, or links to third-party sites contained on this website are provided on an "as-is" basis, are intended only to be informative, is not an advice nor a recommendation, nor research, or a record of our trading prices, or an offer of, or solicitation for a transaction in any financial instrument and thus should not be treated as such. The information provided does not involve any specific investment objectives, financial situation and needs of any specific person who may receive it. Please be aware, that past performance is not a reliable indicator of future performance and/or results. Past Performance or Forward-looking scenarios based upon the reasonable beliefs of the third-party provider are not a guarantee of future performance. Actual results may differ materially from those anticipated in forward-looking or past performance statements. IC Markets makes no representation or warranty and assumes no liability as to the accuracy or completeness of the information provided, nor any loss arising from any investment based on a recommendation, forecast or any information supplied by any third-party.

NZDJPY to find sellers at current resistance?NZDJPY - 24h expiry
The primary trend remains bearish.
The rally has posted a correction count on the daily chart.
Price action looks to be forming a top.
Preferred trade is to sell into rallies.
Bespoke resistance is located at 85.95.
We look to Sell at 85.95 (stop at 86.20)
Our profit targets will be 85.05 and 84.85
Resistance: 86.10 / 86.40 / 86.70
Support: 85.30 / 85.00 / 84.80
Risk Disclaimer
The trade ideas beyond this page are for informational purposes only and do not constitute investment advice or a solicitation to trade. This information is provided by Signal Centre, a third-party unaffiliated with OANDA, and is intended for general circulation only. OANDA does not guarantee the accuracy of this information and assumes no responsibilities for the information provided by the third party. The information does not take into account the specific investment objectives, financial situation, or particular needs of any particular person. You should take into account your specific investment objectives, financial situation, and particular needs before making a commitment to trade, including seeking advice from an independent financial adviser regarding the suitability of the investment, under a separate engagement, as you deem fit.
You accept that you assume all risks in independently viewing the contents and selecting a chosen strategy.
Where the research is distributed in Singapore to a person who is not an Accredited Investor, Expert Investor or an Institutional Investor, Oanda Asia Pacific Pte Ltd (“OAP“) accepts legal responsibility for the contents of the report to such persons only to the extent required by law. Singapore customers should contact OAP at 6579 8289 for matters arising from, or in connection with, the information/research distributed.

GBPNZD: Support Rebound! Target 2.26 on the Horizon? The weekly chart of GBPNZD shows a consolidation phase following a strong bearish impulse. The price has reacted positively from the support area around 2.2200, forming a significant bullish candle that could indicate a rebound towards the resistance area at 2.2600. The positive momentum suggests a possible test of the intermediate resistance at 2.2500, with the RSI gradually rising from an oversold zone.
Fundamental Analysis
According to the COT data updated as of April 29, 2025, we observe an increase in long positions on GBP by institutional traders, with an increment of +10,665 contracts. On the other hand, commercial traders (hedgers) continue to maintain a significant short exposure on GBP. This imbalance may suggest a potential short-term speculative interest in a bullish GBP move.
Regarding NZD, the latest COT report shows a significant increase in commercial long positions (+3,884 contracts), indicating a strengthening of the New Zealand dollar. However, the overall market sentiment shows a prevalence of short positions on GBPNZD (59% short vs. 41% long), suggesting that retail traders might be on the wrong side of the market.
Seasonal Analysis
Historically, in May, GBP tends to show weakness (-0.0076 over the last 20 years), while NZD does not show a clear seasonal pattern. This could reduce the likelihood of a decisive GBP movement during this month.
Operational Strategy
The rebound from 2.2200 could favor the opening of long positions with the first target at 2.2500 and the second target at 2.2600. The stop loss could be placed below the key support at 2.2100. In case of a resistance breakout, an extension towards the 2.2700 area would be plausible.

GBPJPY UPDATEHello friends
Given the channel break and the continuation of the decline, we expect the price to move to the two specified supports.
*Trade safely with us*

NZDJPY Expected Growth! BUY!
My dear friends,
Please, find my technical outlook for NZDJPY below:
The price is coiling around a solid key level - 85.539
Bias - Bullish
Technical Indicators: Pivot Points Low anticipates a potential price reversal.
Super trend shows a clear buy, giving a perfect indicators' convergence.
Goal - 85.760
About Used Indicators:
The pivot point itself is simply the average of the high, low and closing prices from the previous trading day.
Disclosure: I am part of Trade Nation's Influencer program and receive a monthly fee for using their TradingView charts in my analysis.
———————————
WISH YOU ALL LUCK

NZDCAD: Last Idea Running 300+ Pips, Next Big Opportunity OTW! Dear Traders,
Our last idea hit 340+ pips successfully, and we expect price to continue rising up, after touching our imbalance zone. That area remain a strong possible buying area for buyers. Once rejected at the area we can see strong rebound from our buying zone. 400-500 pips move is expected.
Good Luck and Trade Safe
**If you like our idea then please do like, comment and follow for more**

NZDCHF short: trend continuationMain trend – bearish.
Pull back to nearest s/r level at 0.49850 has been completed.
A lower high has now been formed.
Price is below the 200dma.
We are in all time low territory, so I will be targeting the 0.4700 round number and then evaluate again.
This is not a trade recommendation; it’s merely my own analysis. Trading carries a high level of risk, so only trade with money you can afford to lose and carefully manage your capital and risk. If you like my idea, please give a “boost” and follow me to get even more. Please comment and share your thoughts too!!
It’s not whether you are right or wrong, but how much money you make when you are right and how much you lose when you are wrong – George Soros

NZDCAD - Looking To Sell Pullbacks In The Short TermM15 - Bearish divergence followed by the most recent uptrend line breakout.
No opposite signs.
Currently it looks like a pullback is happening.
Expecting bearish continuation until the strong resistance zone holds.
If you enjoy this idea, don’t forget to LIKE 👍, FOLLOW ✅, SHARE 🙌, and COMMENT ✍! Drop your thoughts and charts below to keep the discussion going. Your support helps keep this content free and reach more people! 🚀
--------------------------------------------------------------------------------------------------------------------
Disclosure: I am part of Trade Nation's Influencer program and receive a monthly fee for using their TradingView charts in my analysis.

NZDCAD Will Go Lower! Short!
Here is our detailed technical review for NZDCAD.
Time Frame: 6h
Current Trend: Bearish
Sentiment: Overbought (based on 7-period RSI)
Forecast: Bearish
The market is trading around a solid horizontal structure 0.825.
The above observations make me that the market will inevitably achieve 0.816 level.
P.S
Please, note that an oversold/overbought condition can last for a long time, and therefore being oversold/overbought doesn't mean a price rally will come soon, or at all.
Disclosure: I am part of Trade Nation's Influencer program and receive a monthly fee for using their TradingView charts in my analysis.
Like and subscribe and comment my ideas if you enjoy them!

NZDCAD: Bearish Continuation is Expected! Here is Why:
The recent price action on the NZDCAD pair was keeping me on the fence, however, my bias is slowly but surely changing into the bearish one and I think we will see the price go down.
Disclosure: I am part of Trade Nation's Influencer program and receive a monthly fee for using their TradingView charts in my analysis.
❤️ Please, support our work with like & comment! ❤️

NZDCAD Sell to 0.816?There is a potential sell on the 4 hour chart.
I expect NZD CAD to start declining to at least 0.817
Stop loss: 0.8273
TP : Around 0.817

gbpnzd buy signal. Don't forget about stop-loss.
Write in the comments all your questions and instruments analysis of which you want to see.
Friends, push the like button, write a comment, and share with your mates - that would be the best THANK YOU.
P.S. I personally will open entry if the price will show it according to my strategy.
Always make your analysis before a trade

Long GBPNZD - good setup but better to wait for news later todayA resistance area that turns into support usually creates high probability trades and that is what I see here. But we have NZD employment data release later today. I will stay patient and await the effect of that news release. You never know we could get this opportunity to go long even at that time.
This is not a trade recommendation; it’s merely my own analysis. Trading carries a high level of risk, so only trade with money you can afford to lose and carefully manage your capital and risk. If you like my idea, please give a “boost” and follow me to get even more. Please comment and share your thoughts too!!
It’s not whether you are right or wrong, but how much money you make when you are right and how much you lose when you are wrong – George Soros

GBPNZD: Expecting Bullish Movement! Here is Why:
Balance of buyers and sellers on the GBPNZD pair, that is best felt when all the timeframes are analyzed properly is shifting in favor of the buyers, therefore is it only natural that we go long on the pair.
Disclosure: I am part of Trade Nation's Influencer program and receive a monthly fee for using their TradingView charts in my analysis.
❤️ Please, support our work with like & comment! ❤️

EURNZD - Strong Intersection!Hello TradingView Family / Fellow Traders. This is Richard, also known as theSignalyst.
📈EURNZD has been in a correction phase trading within the falling red channel and it is currently retesting the lower bound of the bullish channel marked in blue.
Moreover, the green zone is a strong structure and support zone.
🏹 Thus, the highlighted blue circle is a strong area to look for buy setups as it is the intersection of structure and lower blue and red trendlines acting as non-horizontal support.
📚 As per my trading style:
As #EURNZD approaches the blue circle, I will be looking for bullish reversal setups (like a double bottom pattern, trendline break , and so on...)
📚 Always follow your trading plan regarding entry, risk management, and trade management.
Good luck!
All Strategies Are Good; If Managed Properly!
~Rich
Disclosure: I am part of Trade Nation's Influencer program and receive a monthly fee for using their TradingView charts in my analysis.

NZDUSD to continue in the upward move?NZDUSD - 24h expiry
Indecisive price action has resulted in sideways congestion on the intraday chart.
Momentum is flat, highlighting the lack of clear direction.
Risk/Reward would be poor to call a buy from current levels.
A move through 0.6000 will confirm the bullish momentum.
The measured move target is 0.6075.
We look to Buy at 0.5950 (stop at 0.5900)
Our profit targets will be 0.6050 and 0.6075
Resistance: 0.6000 / 0.6025 / 0.6050
Support: 0.5950 / 0.5925 / 0.5900
Risk Disclaimer
The trade ideas beyond this page are for informational purposes only and do not constitute investment advice or a solicitation to trade. This information is provided by Signal Centre, a third-party unaffiliated with OANDA, and is intended for general circulation only. OANDA does not guarantee the accuracy of this information and assumes no responsibilities for the information provided by the third party. The information does not take into account the specific investment objectives, financial situation, or particular needs of any particular person. You should take into account your specific investment objectives, financial situation, and particular needs before making a commitment to trade, including seeking advice from an independent financial adviser regarding the suitability of the investment, under a separate engagement, as you deem fit.
You accept that you assume all risks in independently viewing the contents and selecting a chosen strategy.
Where the research is distributed in Singapore to a person who is not an Accredited Investor, Expert Investor or an Institutional Investor, Oanda Asia Pacific Pte Ltd (“OAP“) accepts legal responsibility for the contents of the report to such persons only to the extent required by law. Singapore customers should contact OAP at 6579 8289 for matters arising from, or in connection with, the information/research distributed.
