Bearish drop?EUR/NZD has rejected off the pivot and could drop tothe 1st support.
Pivot: 1.92325
1st Support: 1.88101
1st Resistance: 1.93451
Risk Warning:
Trading Forex and CFDs carries a high level of risk to your capital and you should only trade with money you can afford to lose. Trading Forex and CFDs may not be suitable for all investors, so please ensure that you fully understand the risks involved and seek independent advice if necessary.
Disclaimer:
The above opinions given constitute general market commentary, and do not constitute the opinion or advice of IC Markets or any form of personal or investment advice.
Any opinions, news, research, analyses, prices, other information, or links to third-party sites contained on this website are provided on an "as-is" basis, are intended only to be informative, is not an advice nor a recommendation, nor research, or a record of our trading prices, or an offer of, or solicitation for a transaction in any financial instrument and thus should not be treated as such. The information provided does not involve any specific investment objectives, financial situation and needs of any specific person who may receive it. Please be aware, that past performance is not a reliable indicator of future performance and/or results. Past Performance or Forward-looking scenarios based upon the reasonable beliefs of the third-party provider are not a guarantee of future performance. Actual results may differ materially from those anticipated in forward-looking or past performance statements. IC Markets makes no representation or warranty and assumes no liability as to the accuracy or completeness of the information provided, nor any loss arising from any investment based on a recommendation, forecast or any information supplied by any third-party.
NZD (New Zealand Dollar)

GBP-NZD Swing Long! Buy!
Hello,Traders!
GBP-NZD made a bullish
Rebound from the rising
Support line so we are
Bullish biased and we
Will be expecting a
Further bullish move up
Buy!
Comment and subscribe to help us grow!
Check out other forecasts below too!
Disclosure: I am part of Trade Nation's Influencer program and receive a monthly fee for using their TradingView charts in my analysis.

NZDJPY - Following the Bears...Hello TradingView Family / Fellow Traders. This is Richard, also known as theSignalyst.
📈From a long-term perspective, NZDJPY has been overall bearish trading within the falling wedge pattern in red.
Moreover, the orange zone is a strong supply.
🏹 Thus, the highlighted red circle is a strong area to look for sell setups as it is the intersection of the upper red trendline and supply.
📚 As per my trading style:
As #NZDJPY approaches the red circle zone, I will be looking for bearish reversal setups (like a double top pattern, trendline break , and so on...)
📚 Always follow your trading plan regarding entry, risk management, and trade management.
Good luck!
All Strategies Are Good; If Managed Properly!
~Rich
Disclosure: I am part of Trade Nation's Influencer program and receive a monthly fee for using their TradingView charts in my analysis.

NZD_CAD SHORT SIGNAL|
✅NZD_CAD has reached a supply level
So according to our strategy
We can enter a short trade
With TP of 0.8258 and the
SL of 0.8352 as we will be
Expecting a local bearish correction
SHORT🔥
✅Like and subscribe to never miss a new idea!✅
Disclosure: I am part of Trade Nation's Influencer program and receive a monthly fee for using their TradingView charts in my analysis.

NZDUSD to continue in the upward move?NZDUSD - 24h expiry
There is no indication that the rally is coming to an end.
Although we remain bullish overall, a correction is possible with plenty of room to move lower without impacting the trend higher.
Risk/Reward would be poor to call a buy from current levels.
A move through 0.6025 will confirm the bullish momentum.
The measured move target is 0.6075.
We look to Buy at 0.5950 (stop at 0.5900)
Our profit targets will be 0.6050 and 0.6075
Resistance: 0.6025 / 0.6050 / 0.6075
Support: 0.6000 / 0.5950 / 0.5925
Risk Disclaimer
The trade ideas beyond this page are for informational purposes only and do not constitute investment advice or a solicitation to trade. This information is provided by Signal Centre, a third-party unaffiliated with OANDA, and is intended for general circulation only. OANDA does not guarantee the accuracy of this information and assumes no responsibilities for the information provided by the third party. The information does not take into account the specific investment objectives, financial situation, or particular needs of any particular person. You should take into account your specific investment objectives, financial situation, and particular needs before making a commitment to trade, including seeking advice from an independent financial adviser regarding the suitability of the investment, under a separate engagement, as you deem fit.
You accept that you assume all risks in independently viewing the contents and selecting a chosen strategy.
Where the research is distributed in Singapore to a person who is not an Accredited Investor, Expert Investor or an Institutional Investor, Oanda Asia Pacific Pte Ltd (“OAP“) accepts legal responsibility for the contents of the report to such persons only to the extent required by law. Singapore customers should contact OAP at 6579 8289 for matters arising from, or in connection with, the information/research distributed.

Bearish drop?EUR/NZD has rejected off the resistance level which is a pullback resistance that lines up with the 38.2% Fibonacci retracement and could drop from this level to our take profit.
Entry: 1.92864
Why we like it:
There is a pullback resistance level that lines up with the 38.2% Fibonacci retracement.
Stop loss: 1.96601
Why we like it:
There is a pullback resistance level that lines up with the 61.8% Fibonacci retracement.
Take profit: 1.88133
Why we like it:
There is a pullback support level.
Enjoying your TradingView experience? Review us!
Please be advised that the information presented on TradingView is provided to Vantage (‘Vantage Global Limited’, ‘we’) by a third-party provider (‘Everest Fortune Group’). Please be reminded that you are solely responsible for the trading decisions on your account. There is a very high degree of risk involved in trading. Any information and/or content is intended entirely for research, educational and informational purposes only and does not constitute investment or consultation advice or investment strategy. The information is not tailored to the investment needs of any specific person and therefore does not involve a consideration of any of the investment objectives, financial situation or needs of any viewer that may receive it. Kindly also note that past performance is not a reliable indicator of future results. Actual results may differ materially from those anticipated in forward-looking or past performance statements. We assume no liability as to the accuracy or completeness of any of the information and/or content provided herein and the Company cannot be held responsible for any omission, mistake nor for any loss or damage including without limitation to any loss of profit which may arise from reliance on any information supplied by Everest Fortune Group.

Bullish bounce?NZD/JPY has bounced off the support level which is an overlaps support that lines up with the 23.6% Fibonacci retracement and could rise from this level to our take profit.
Entry: 83.98
Why we like it:
There is an overlap support level that lines up with the 23.6% Fibonacci retracement.
Stop loss: 82.82
Why we like it:
There is an overlap support level that is slightly above the 50% Fibonacci retracement.
Take profit: 86.15
Why we like it:
There is a pullback resistance level.
Enjoying your TradingView experience? Review us!
Please be advised that the information presented on TradingView is provided to Vantage (‘Vantage Global Limited’, ‘we’) by a third-party provider (‘Everest Fortune Group’). Please be reminded that you are solely responsible for the trading decisions on your account. There is a very high degree of risk involved in trading. Any information and/or content is intended entirely for research, educational and informational purposes only and does not constitute investment or consultation advice or investment strategy. The information is not tailored to the investment needs of any specific person and therefore does not involve a consideration of any of the investment objectives, financial situation or needs of any viewer that may receive it. Kindly also note that past performance is not a reliable indicator of future results. Actual results may differ materially from those anticipated in forward-looking or past performance statements. We assume no liability as to the accuracy or completeness of any of the information and/or content provided herein and the Company cannot be held responsible for any omission, mistake nor for any loss or damage including without limitation to any loss of profit which may arise from reliance on any information supplied by Everest Fortune Group.

GBPNZD: Long Signal Explained
GBPNZD
- Classic bullish setup
- Our team expects bullish continuation
SUGGESTED TRADE:
Swing Trade
Long GBPNZD
Entry Point - 2.2295
Stop Loss - 2.2146
Take Profit - 2.2587
Our Risk - 1%
Start protection of your profits from lower levels
Disclosure: I am part of Trade Nation's Influencer program and receive a monthly fee for using their TradingView charts in my analysis.
❤️ Please, support our work with like & comment! ❤️

NZDCAD: Bearish Continuation is Highly Probable! Here is Why:
The price of NZDCAD will most likely collapse soon enough, due to the supply beginning to exceed demand which we can see by looking at the chart of the pair.
❤️ Please, support our work with like & comment! ❤️

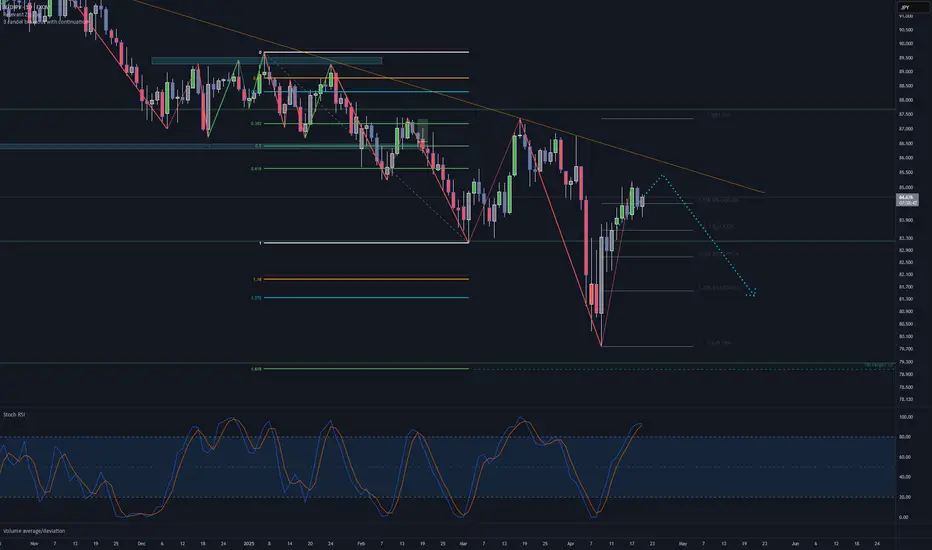
NZDJPY short oportunityWatch for end of retracment trade!
I think this can be good RR oportunity, the Target is to Low of previousextension.
On 4 chart we are already see some bearih divergances, But still in uptrend. Soo wiat for some kind of confirmation.
Trade safe ;)
NZDCHF Reversal Builds as Trade Data Surprises Bulls Eye 0.5078NZDCHF has formed a clear inverse head & shoulders pattern on the 4H chart, with price currently hovering above the neckline at 0.4840. The technical breakout remains valid, with bullish targets at:
TP1: 0.4993
TP2: 0.5078
SL: Below 0.4740
🧠 Fundamental Update – NZ Trade Balance (Apr 21):
Latest Data:
Actual: +80M
Forecast: +510M
Previous: +510M
✅ Still positive, but below expectations
⚠️ Weaker-than-expected trade surplus may weigh on NZD short-term
Combined With Recent CPI Data (Apr 16):
Inflation rose to 2.5% YoY, higher than forecast but still within the RBNZ's target band
Most price pressures are seen as temporary (fuel, education)
RBNZ cut OCR to 3.5% in April and has left the door open to further cuts
Markets still fully price in a rate cut on May 28, with a projected floor of 2.75% by October
🌏 Global Context:
Trade tensions and slowing global growth (esp. from U.S. tariff risk) are driving demand for safe havens like CHF
ANZ economists have revised forecasts for additional RBNZ easing to 2.5%, citing weak global sentiment
🧭 Interpretation for NZDCHF:
Short-term:
✅ Positive technical structure
✅ Net trade surplus supports slight NZD demand
⚠️ Trade miss and dovish RBNZ tone keep bullish momentum cautious
Medium-term:
⚠️ Macro headwinds + expected RBNZ cut may limit upside
⚠️ Potential pullbacks if rate-cut sentiment strengthens into May
💡 Final Trade Strategy:
Bullish bias valid above 0.4840, but watch for volatility
Profit-taking recommended at 0.4993
Be cautious near 0.5078, especially before the May 28 RBNZ meeting
A close below 0.4740 would invalidate the bullish setup

gbpnzd xabcd buy/hold exit +300 pips🔸Hello traders, let's review the 40 minute chart for GBPNZD.
Chart looks oversold recently, expecting bounce setup soon.
🔸Speculative XABCD structure defined by point X 2460 point A 2210 point B 2400 point C 2180 point D/PRZ 2530 still pending. C also pending later today.
🔸Advanced BUY/HOLD from point C targeting point D of the sequence. Higher risk trade setup, use protective SL and adjust to BE at +60 pips.
🔸Recommended strategy for GN traders: buy/hold at point C TP1 is +150 pips TP2 +300 pips or point D of the XABCD structure.
🎁Please hit the like button and
🎁Leave a comment to support our team!

Bearish reversal off overlap resistance?The Kiwi (NZD/USD) is rising towards the pivot and could reverse to the pullback support.
Pivot: 0.5987
1st Support: 0.5831
1st Resistance: 0.6125
Risk Warning:
Trading Forex and CFDs carries a high level of risk to your capital and you should only trade with money you can afford to lose. Trading Forex and CFDs may not be suitable for all investors, so please ensure that you fully understand the risks involved and seek independent advice if necessary.
Disclaimer:
The above opinions given constitute general market commentary, and do not constitute the opinion or advice of IC Markets or any form of personal or investment advice.
Any opinions, news, research, analyses, prices, other information, or links to third-party sites contained on this website are provided on an "as-is" basis, are intended only to be informative, is not an advice nor a recommendation, nor research, or a record of our trading prices, or an offer of, or solicitation for a transaction in any financial instrument and thus should not be treated as such. The information provided does not involve any specific investment objectives, financial situation and needs of any specific person who may receive it. Please be aware, that past performance is not a reliable indicator of future performance and/or results. Past Performance or Forward-looking scenarios based upon the reasonable beliefs of the third-party provider are not a guarantee of future performance. Actual results may differ materially from those anticipated in forward-looking or past performance statements. IC Markets makes no representation or warranty and assumes no liability as to the accuracy or completeness of the information provided, nor any loss arising from any investment based on a recommendation, forecast or any information supplied by any third-party.

GBP_NZD LONG FROM RISING SUPPORT|
✅GBP_NZD is trading along the rising support line
And as the pair is going up now
After the retest of the line
I am expecting the price to keep growing
To retest the supply levels above around 2.2532
LONG🚀
✅Like and subscribe to never miss a new idea!✅
Disclosure: I am part of Trade Nation's Influencer program and receive a monthly fee for using their TradingView charts in my analysis.

GBPAUD NULLISH OR BEARISH DETAILED ANALYSIS GBPAUD is currently trading around the 2.0850 level, hovering just above a strong confluence support zone as seen on the 12H chart. Price action has formed a bullish symmetrical triangle pattern following a strong impulsive rally earlier this month. This compression near a major demand zone signals a potential bullish breakout as price builds pressure right above the support base. The 2.0700–2.0600 region has historically acted as a key level, now reinforcing itself as solid structure support.
Technically, this setup is clean and aligned with classic continuation pattern behavior. We had a strong rally leading into the triangle, and the market has been respecting both the lower support boundary and declining resistance trendline. The recent candles show signs of rejection from the lower bounds of the wedge, adding to the bullish sentiment. A confirmed breakout above 2.0900 could trigger a fresh wave of upside momentum targeting the 2.1300–2.1600 zone in the coming sessions.
Fundamentally, GBP remains supported by stronger-than-expected inflation data and ongoing hawkish tones from the Bank of England. Markets are dialing back expectations of near-term rate cuts, giving the pound further upside traction. Meanwhile, AUD is weakening amid soft Chinese economic data, increasing risk aversion, and fading demand for commodities. Australia’s labor market also showed signs of cooling, reducing the RBA’s tightening pressure and putting the Aussie on the back foot.
This is a high-probability swing setup gaining traction on TradingView due to the combination of strong technical formation and macro divergence. With the pattern maturing above support and a clear bullish structure, GBPAUD is offering an attractive risk-to-reward scenario for bulls eyeing continuation into Q2. Patience on the breakout confirmation will be key, but the bias remains clearly bullish from both a chart and economic perspective.

NZDCHF: Short Signal with Entry/SL/TP
NZDCHF
- Classic bearish setup
- Our team expects bearish continuation
SUGGESTED TRADE:
Swing Trade
Short NZDCHF
Entry Point - 0.4892
Stop Loss - 0.4962
Take Profit - 0.4769
Our Risk - 1%
Start protection of your profits from lower levels
Disclosure: I am part of Trade Nation's Influencer program and receive a monthly fee for using their TradingView charts in my analysis.
❤️ Please, support our work with like & comment! ❤️

NZD/CHF BEARS ARE STRONG HERE|SHORT
Hello, Friends!
NZD/CHF is trending down which is clear from the red colour of the previous weekly candle. However, the price has locally surged into the overbought territory. Which can be told from its proximity to the BB upper band. Which presents a classical trend following opportunity for a short trade from the resistance line above towards the demand level of 0.477.
Disclosure: I am part of Trade Nation's Influencer program and receive a monthly fee for using their TradingView charts in my analysis.
✅LIKE AND COMMENT MY IDEAS✅

NZDCHF Will Go Up! Long!
Please, check our technical outlook for NZDCHF.
Time Frame: 1h
Current Trend: Bullish
Sentiment: Oversold (based on 7-period RSI)
Forecast: Bullish
The market is approaching a key horizontal level 0.489.
Considering the today's price action, probabilities will be high to see a movement to 0.492.
P.S
We determine oversold/overbought condition with RSI indicator.
When it drops below 30 - the market is considered to be oversold.
When it bounces above 70 - the market is considered to be overbought.
Disclosure: I am part of Trade Nation's Influencer program and receive a monthly fee for using their TradingView charts in my analysis.
Like and subscribe and comment my ideas if you enjoy them!

NZDCHF LONGi enter NZDCHF long, i see trend line brake on 4h, bullish divergence on RSI. on 4h i dont see trend brake yet so that is why i put SL on prevous DAILY level.
On daily looks like bullish divergence on Stochastic but not so clear.
will see how this will work out.

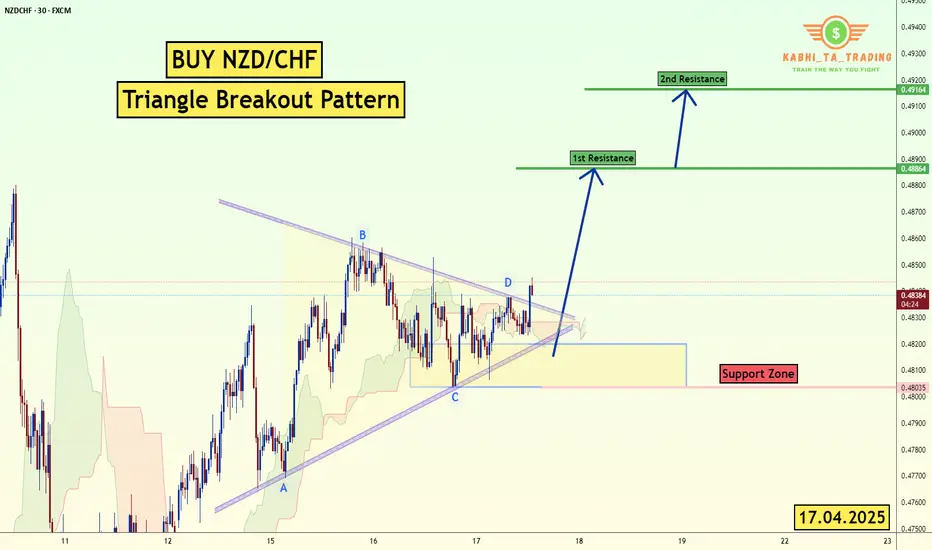
NZD/CHF Triangle Breakout (17.04.2025)The NZD/CHF pair on the M30 timeframe presents a Potential Buying Opportunity due to a recent Formation of a Breakout Pattern. This suggests a shift in momentum towards the upside and a higher likelihood of further advances in the coming hours.
Possible Long Trade:
Entry: Consider Entering A Long Position around Trendline Of The Pattern.
Target Levels:
1st Resistance – 0.4886
2nd Resistance – 0.4916
🎁 Please hit the like button and
🎁 Leave a comment to support for My Post !
Your likes and comments are incredibly motivating and will encourage me to share more analysis with you.
Best Regards, KABHI_TA_TRADING
Thank you.
NZD_CHF WILL GROW|LONG|
✅NZD_CHF is making a recovery
Move up and made a bullish breakout
Of the key level of 0.4860 so we
Are bullish biased and a
Further move up is to
Be expected
LONG🚀
✅Like and subscribe to never miss a new idea!✅
Disclosure: I am part of Trade Nation's Influencer program and receive a monthly fee for using their TradingView charts in my analysis.

GBP-NZD Local Long! Buy!
Hello,Traders!
GBP-NZD fell down strongly
Through the first line of
Support but a strong support
Was hit around 2.2160 from
Where a local bullish rebound
Is likely to happen on Monday
So we will be able to enter
A long trade with the Take
Profit of 2.2300 and the
Stop Loss of 2.2123
Buy!
Comment and subscribe to help us grow!
Check out other forecasts below too!
Disclosure: I am part of Trade Nation's Influencer program and receive a monthly fee for using their TradingView charts in my analysis.

NZDCAD: Bearish Continuation & Short Signal
NZDCAD
- Classic bearish formation
- Our team expects fall
SUGGESTED TRADE:
Swing Trade
Sell NZDCAD
Entry Level - 0.8262
Sl - 0.8332
Tp - 0.8116
Our Risk - 1%
Start protection of your profits from lower levels
Disclosure: I am part of Trade Nation's Influencer program and receive a monthly fee for using their TradingView charts in my analysis.
❤️Please, support our work with like & comment!❤️
