GBPNZD Will Go Up! Long!
Here is our detailed technical review for GBPNZD.
Time Frame: 9h
Current Trend: Bullish
Sentiment: Oversold (based on 7-period RSI)
Forecast: Bullish
The market is trading around a solid horizontal structure 2.264.
The above observations make me that the market will inevitably achieve 2.285 level.
P.S
Overbought describes a period of time where there has been a significant and consistent upward move in price over a period of time without much pullback.
Disclosure: I am part of Trade Nation's Influencer program and receive a monthly fee for using their TradingView charts in my analysis.
Like and subscribe and comment my ideas if you enjoy them!
NZD (New Zealand Dollar)

Bullish bounce?The Kiwi (NZD/USD) is falling towards the pivot and could bounce to the 1st support which has been identified as a pullback support.
Pivot: 0.5937
1st Support: 0.5820
1st Resistance: 0.6098
Risk Warning:
Trading Forex and CFDs carries a high level of risk to your capital and you should only trade with money you can afford to lose. Trading Forex and CFDs may not be suitable for all investors, so please ensure that you fully understand the risks involved and seek independent advice if necessary.
Disclaimer:
The above opinions given constitute general market commentary, and do not constitute the opinion or advice of IC Markets or any form of personal or investment advice.
Any opinions, news, research, analyses, prices, other information, or links to third-party sites contained on this website are provided on an "as-is" basis, are intended only to be informative, is not an advice nor a recommendation, nor research, or a record of our trading prices, or an offer of, or solicitation for a transaction in any financial instrument and thus should not be treated as such. The information provided does not involve any specific investment objectives, financial situation and needs of any specific person who may receive it. Please be aware, that past performance is not a reliable indicator of future performance and/or results. Past Performance or Forward-looking scenarios based upon the reasonable beliefs of the third-party provider are not a guarantee of future performance. Actual results may differ materially from those anticipated in forward-looking or past performance statements. IC Markets makes no representation or warranty and assumes no liability as to the accuracy or completeness of the information provided, nor any loss arising from any investment based on a recommendation, forecast or any information supplied by any third-party.

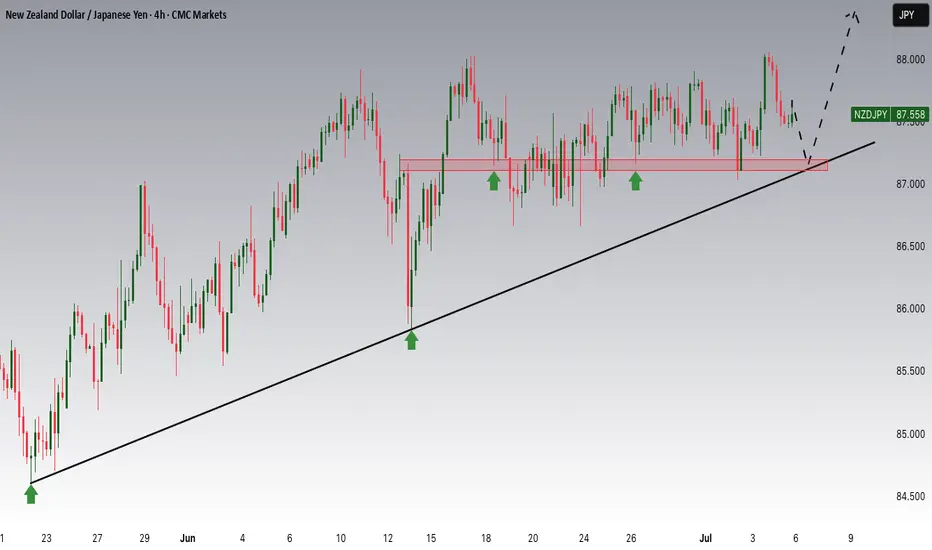
Buy NZDJPY Buy Opportunities on NZDJPY
ENTRY: 87.100
STOPLOSS: 86.900
TAKE PROFIT: 88.00
COMMENT YOUR OPINION
For fund management contact me on X @shajudeakinoba1

GBPUSD UPDATE (NICE CHART)Hello friends
Given the failure of the pain and the strong growth of the price, you can see that the price is in correction, which is a good opportunity for safe purchases at the indicated support points, of course with capital and risk management...
*Trade safely with us*

NZDJPY Potential UpsidesHey Traders, in the coming week we are monitoring NZDJPY for a buying opportunity around 87.200 zone, NZDJPY is trading in an uptrend and currently is in a correction phase in which it is approaching the trend at 87.200 support and resistance area.
Trade safe, Joe.
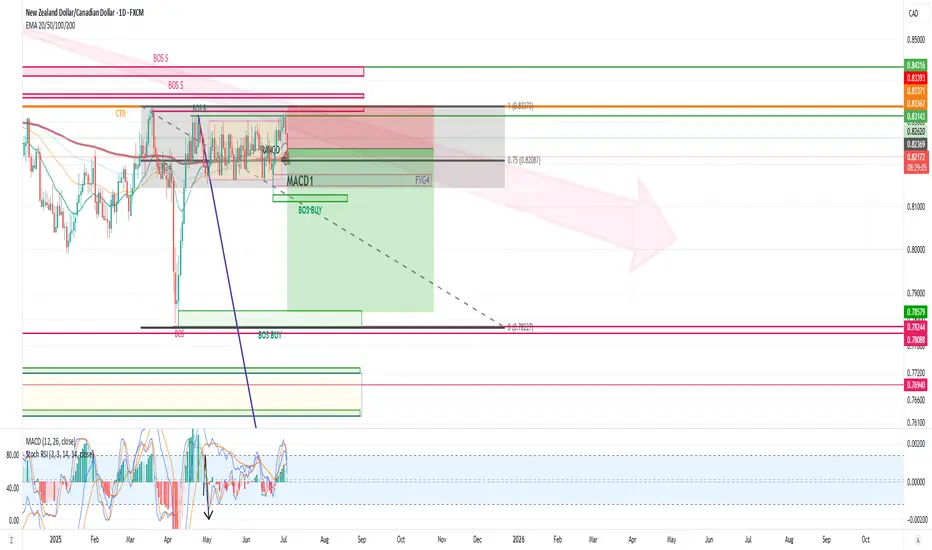
NZDCAD: High-Conviction Long - Fundamental Strength & TechnicalThis analysis identifies an extremely high-conviction long opportunity in the NZDCAD currency pair 📈🇨🇦🇳🇿. Our conviction is primarily driven by a significant divergence in monetary policy outlooks and economic fundamentals between New Zealand and Canada. New Zealand's economic resilience, underpinned by robust dairy prices and a less dovish central bank stance, contrasts sharply with Canada's decelerating growth, rising unemployment, and a central bank poised for further rate cuts amidst trade policy uncertainties. Technically, NZDCAD appears poised for an upward move from key support levels, supported by bullish momentum indicators on the 4-hour chart. This is a medium-term trade expected to play out over days to weeks. 🗓️
I. Fundamental Rationale: Diverging Economic Trajectories 📊🌍
The core of this trade lies in the starkly different economic paths New Zealand and Canada are currently on, creating a compelling fundamental case for NZD appreciation against CAD:
Monetary Policy Divergence:
New Zealand (NZD): The Reserve Bank of New Zealand (RBNZ) maintained its Official Cash Rate (OCR) at 3.25% in June 2025. Analysts anticipate a hold at the upcoming July 9 meeting, balancing growth concerns with an "uncomfortably high near-term inflation outlook". This signals a less aggressive easing path. 🏦🇳🇿
Canada (CAD): In contrast, the Bank of Canada (BoC) held its policy rate steady at 2.75% in June 2025, after nine consecutive 0.25% cuts since June 2024. Market expectations for the upcoming July 30, 2025 meeting indicate a 33% chance of a further 25 basis point cut, with economists anticipating gradual cuts to 2.25% by mid-2025. This clear easing bias is driven by consistently below-target inflation (1.73% in May 2025). 📉🇨🇦
Impact: This creates a clear and widening interest rate differential fundamentally favoring the NZD. 💰
Inflation Outlook:
New Zealand: Annual inflation accelerated to 2.5% in Q1 2025, exceeding market expectations and marking the highest rate since June 2024. This reinforces the RBNZ's cautious stance. ⬆️
Canada: Canada's CPI registered 1.73% in May 2025, notably below the BoC's 2.0% target, providing ample justification for further monetary easing. ⬇️
Economic Performance & Labor Market:
New Zealand: GDP is projected to grow by 1.9% in 2025. The unemployment rate remained unchanged at 5.1% in March 2025, with average hourly earnings increasing by 4.5% annually. 💼✨
Canada: Real GDP contracted by 0.1% in April 2025, with a flash estimate pointing to another 0.1% decline in May, implying an annualized loss of 0.3% in Q2 2025. The unemployment rate rose to 7.0% in May 2025, its highest since September 2016 (excluding pandemic years). 📉🏭
Impact: New Zealand demonstrates greater economic resilience and a more stable labor market. 💪
Commodity & Trade Dynamics:
New Zealand: Benefits significantly from surging dairy prices, its top export commodity, which saw a substantial 10% increase in Q1 2025, with Fonterra forecasting record milk prices and production volumes. This contributed to a robust monthly trade surplus of $1.2 billion in May 2025. 🥛🧀💰
Canada: While the CAD maintains a strong positive correlation with oil prices, energy exports decreased by 5.6% in May, with crude oil exports falling 4.0%. Furthermore, Canadian exports to the US have declined for four consecutive months due to ongoing US tariffs. 🛢️📉
Impact: Strong commodity tailwinds and a healthy trade surplus for NZD, versus tariff-induced headwinds and declining energy exports for CAD. 🌬️
Yield Differential: The New Zealand 10-year government bond yield (4.57% as of June 30, 2025) is notably higher than Canada's (3.38% as of July 3, 2025). This provides a positive carry for holding NZD over CAD. 📊
II. Technical Rationale: Chart Insights (4-Hour Timeframe) 📈🔍
The technical picture on the 4-hour chart supports a bullish reversal from current levels, complementing the fundamental outlook:
Current Price Action & Long-Term Trend: NZDCAD is currently approximately 0.8277 (as of July 1, 2025). While short-term analyses may show a "sharp bearish trend," the pair is described as "trading in an uptrend and currently is in a correction phase" as it approaches a key support area. The 1-month change for NZDCAD is +0.13%, and year-to-date is +2.45%, indicating a longer-term bullish bias despite recent fluctuations. This corrective dip presents a favorable entry point. 📉➡️📈
Key Support & Resistance Levels:
Entry Point (0.8270) is strategically chosen near the immediate support cluster, specifically around the Pivot Point 1st Support of 0.8276 and an identified buying opportunity zone around 0.82700. ✅
Take Profit (TP) of 0.8350 is positioned just below the Pivot Point 3rd Level Resistance of 0.8356. 🎯
Stop Loss (SL) of 0.8220) is carefully placed below the key support levels of 0.8240 (Pivot Point 3rd Support) and 0.8236 (Pivot Point 3rd Support). A sustained break below this level would invalidate the bullish thesis. 🛑
Momentum Indicators:
RSI (14): The 14-day RSI for NZDCAD is around 41.78 to 54.33, suggesting a neutral to slightly bullish sentiment, with room for upward movement. 📊
MACD (12, 26, 9): A "bullish divergence" has been identified on the hourly timeframe, often signaling a return of buying interest. The MACD line is also observed to be slightly above its signal line, hinting at a potential bullish crossover. ⬆️
Moving Averages: The 50-day Simple Moving Average (SMA) is positioned slightly above the 200-day Exponential Moving Average (EMA). This configuration suggests a potential bullish crossover of longer-term moving averages, generally considered a positive long-term signal. 📈
III. Trade Setup: 📋✨
Currency Pair: NZDCAD 🇳🇿🇨🇦
Direction: Long (Buy) ⬆️
Entry Point: 0.8270
Take Profit (TP): 0.8350
Stop Loss (SL): 0.8220
Calculated Risk (in pips): 50 pips
Calculated Reward (in pips): 80 pips
Risk-Reward Ratio: Approximately 1.6:1 (A favorable ratio for a high-probability setup!) ✅
Key Considerations: Always adhere to strict risk management principles, risking no more than 1-2% of your total trading capital on this single trade. Be mindful of potential volatility around upcoming high-impact economic events in July, particularly the RBNZ and Bank of Canada interest rate decisions, and inflation data. 🗓️🔔

NZDCAD: Market of Buyers
Our strategy, polished by years of trial and error has helped us identify what seems to be a great trading opportunity and we are here to share it with you as the time is ripe for us to buy NZDCAD.
Disclosure: I am part of Trade Nation's Influencer program and receive a monthly fee for using their TradingView charts in my analysis.
❤️ Please, support our work with like & comment! ❤️

NZDJPY is in an ascending triangle?Looking at the technical picture, FX_IDC:NZDJPY is in an ascending triangle formation. According to the TA rules, such patterns tend to break to the upside, but a confirmation break is still needed. Let's dig in.
MARKETSCOM:NZDJPY
Let us know what you think in the comments below.
Thank you.
77.3% of retail investor accounts lose money when trading CFDs with this provider. You should consider whether you understand how CFDs work and whether you can afford to take the high risk of losing your money. Past performance is not necessarily indicative of future results. The value of investments may fall as well as rise and the investor may not get back the amount initially invested. This content is not intended for nor applicable to residents of the UK. Cryptocurrency CFDs and spread bets are restricted in the UK for all retail clients.

NZDJPY Strong Breakout!
HI,Traders !
NZDJPY is trading in an
Uptrend and the pair has
Made a bullish breakout of
The key horizontal level
Of 87.394 and the breakout
Is confirmed so we are
Bullish biased and we
Will be expecting a further
Bullish move up !
Comment and subscribe to help us grow !

Heading into pullback resistance?The Kiwi (NZD/USD) is rising towards the pivot which is a pullback resistance and could reverse to the 1st support.
Pivot: 0.6103
1st Support: 0.6057
1st Resistance: 0.6120
Risk Warning:
Trading Forex and CFDs carries a high level of risk to your capital and you should only trade with money you can afford to lose. Trading Forex and CFDs may not be suitable for all investors, so please ensure that you fully understand the risks involved and seek independent advice if necessary.
Disclaimer:
The above opinions given constitute general market commentary, and do not constitute the opinion or advice of IC Markets or any form of personal or investment advice.
Any opinions, news, research, analyses, prices, other information, or links to third-party sites contained on this website are provided on an "as-is" basis, are intended only to be informative, is not an advice nor a recommendation, nor research, or a record of our trading prices, or an offer of, or solicitation for a transaction in any financial instrument and thus should not be treated as such. The information provided does not involve any specific investment objectives, financial situation and needs of any specific person who may receive it. Please be aware, that past performance is not a reliable indicator of future performance and/or results. Past Performance or Forward-looking scenarios based upon the reasonable beliefs of the third-party provider are not a guarantee of future performance. Actual results may differ materially from those anticipated in forward-looking or past performance statements. IC Markets makes no representation or warranty and assumes no liability as to the accuracy or completeness of the information provided, nor any loss arising from any investment based on a recommendation, forecast or any information supplied by any third-party.

GBPNZD Local Short!
HI,Traders !
#GBPNZD made a retest of
The horizontal resistance
Of 2.27442 from where we
Are already seeing a bearish
Pullback so we will be
Expecting a further local
Move down !
Comment and subscribe to help us grow !

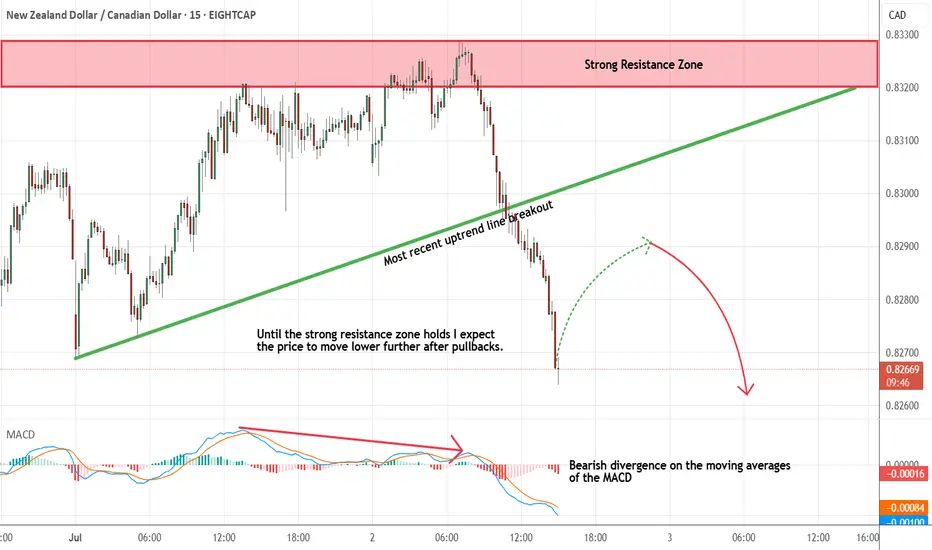
NZDCAD - Looking To Sell Pullbacks In The Short TermM15 - Bearish divergence followed by the most recent uptrend line breakout.
No opposite signs.
Expecting pullbacks and bearish continuation until the strong resistance zone holds.
If you enjoy this idea, don’t forget to LIKE 👍, FOLLOW ✅, SHARE 🙌, and COMMENT ✍! Drop your thoughts and charts below to keep the discussion going. Your support helps keep this content free and reach more people! 🚀
--------------------------------------------------------------------------------------------------------------------
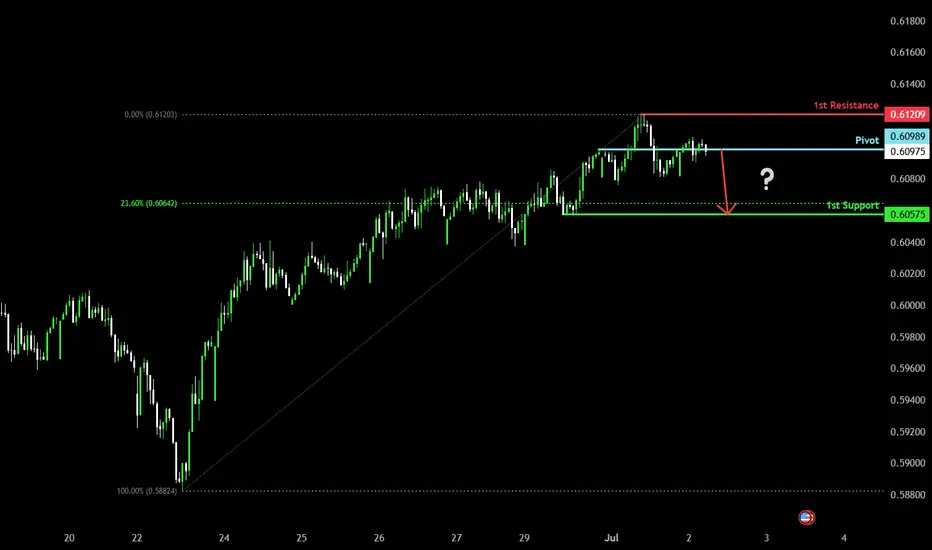
Potential bearish drop?The Kiwi (NZD/USD) is reacting off the pivot which is a pullback resistance and could drop to the 1st support.
Pivot: 0.6098
1st Support: 0.6057
1st Resistance: 0.6120
Risk Warning:
Trading Forex and CFDs carries a high level of risk to your capital and you should only trade with money you can afford to lose. Trading Forex and CFDs may not be suitable for all investors, so please ensure that you fully understand the risks involved and seek independent advice if necessary.
Disclaimer:
The above opinions given constitute general market commentary, and do not constitute the opinion or advice of IC Markets or any form of personal or investment advice.
Any opinions, news, research, analyses, prices, other information, or links to third-party sites contained on this website are provided on an "as-is" basis, are intended only to be informative, is not an advice nor a recommendation, nor research, or a record of our trading prices, or an offer of, or solicitation for a transaction in any financial instrument and thus should not be treated as such. The information provided does not involve any specific investment objectives, financial situation and needs of any specific person who may receive it. Please be aware, that past performance is not a reliable indicator of future performance and/or results. Past Performance or Forward-looking scenarios based upon the reasonable beliefs of the third-party provider are not a guarantee of future performance. Actual results may differ materially from those anticipated in forward-looking or past performance statements. IC Markets makes no representation or warranty and assumes no liability as to the accuracy or completeness of the information provided, nor any loss arising from any investment based on a recommendation, forecast or any information supplied by any third-party.
NZD-CAD Swing Short! Sell!
Hello,Traders!
NZD-CAD keeps growing
In an uptrend but the pair
Will soon retest a wide
Horizontal resistance level
Around 0.8350 so after the
Retest we will be expecting
A bearish pullback
Sell!
Comment and subscribe to help us grow!
Check out other forecasts below too!
Disclosure: I am part of Trade Nation's Influencer program and receive a monthly fee for using their TradingView charts in my analysis.

NZDUSD to continue in the upward move?NZDUSD - 24h expiry
There is no clear indication that the upward move is coming to an end.
Although we remain bullish overall, a correction is possible with plenty of room to move lower without impacting the trend higher.
Risk/Reward would be poor to call a buy from current levels.
A move through 0.6100 will confirm the bullish momentum.
The measured move target is 0.6130.
We look to Buy at 0.6075 (stop at 0.6050)
Our profit targets will be 0.6125 and 0.6130
Resistance: 0.6100 / 0.6125 / 0.6130
Support: 0.6075 / 0.6060 / 0.6050
Risk Disclaimer
The trade ideas beyond this page are for informational purposes only and do not constitute investment advice or a solicitation to trade. This information is provided by Signal Centre, a third-party unaffiliated with OANDA, and is intended for general circulation only. OANDA does not guarantee the accuracy of this information and assumes no responsibilities for the information provided by the third party. The information does not take into account the specific investment objectives, financial situation, or particular needs of any particular person. You should take into account your specific investment objectives, financial situation, and particular needs before making a commitment to trade, including seeking advice from an independent financial adviser regarding the suitability of the investment, under a separate engagement, as you deem fit.
You accept that you assume all risks in independently viewing the contents and selecting a chosen strategy.
Where the research is distributed in Singapore to a person who is not an Accredited Investor, Expert Investor or an Institutional Investor, Oanda Asia Pacific Pte Ltd (“OAP“) accepts legal responsibility for the contents of the report to such persons only to the extent required by law. Singapore customers should contact OAP at 6579 8289 for matters arising from, or in connection with, the information/research distributed.

NZDCAD Selling Trading IdeaHello Traders
In This Chart nzdcad HOURLY Forex Forecast By FOREX PLANET
today NZDCAD analysis 👆
🟢This Chart includes_ (NZDCAD market update)
🟢What is The Next Opportunity on NZDCAD Market
🟢how to Enter to the Valid Entry With Assurance Profit
This CHART is For Trader's that Want to Improve Their Technical Analysis Skills and Their Trading By Understanding How To Analyze The Market Using Multiple Timeframes and Understanding The Bigger Picture on the Charts

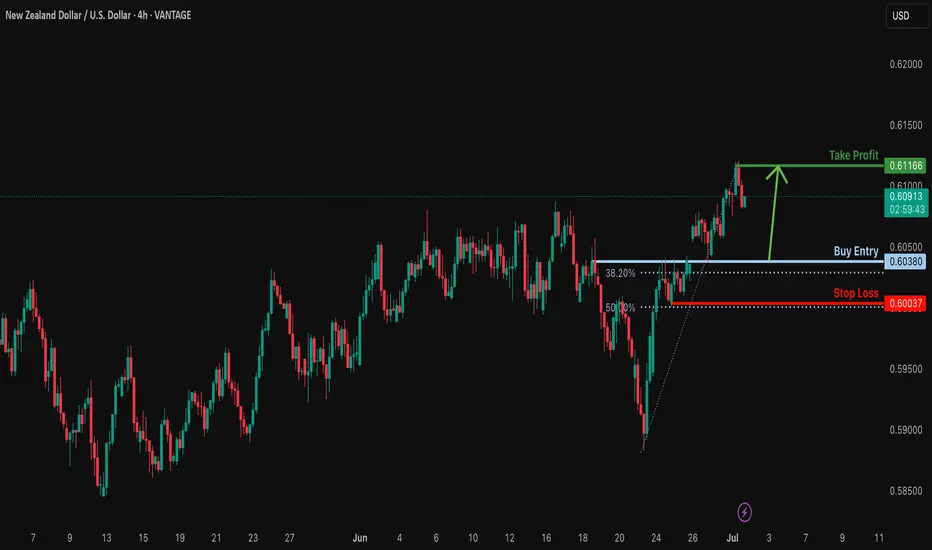
Bullish bounce?NZD/USD is falling towards the support level which is an overlap support that is slightly above the 38.2% Fibonacci retracement and could bounce from this level to our take profit.
Entry: 0.6038
Why we like it:
There is an overlap support that is slightly above the 38.2% Fibonacci retracement.
Stop loss: 0.6038
Why we like it:
There is a pullback support that aligns with the 50% Fibonacci retracement.
Take profit: 0.6116
Why we like it:
There is a pullback resistance.
Enjoying your TradingView experience? Review us!
Please be advised that the information presented on TradingView is provided to Vantage (‘Vantage Global Limited’, ‘we’) by a third-party provider (‘Everest Fortune Group’). Please be reminded that you are solely responsible for the trading decisions on your account. There is a very high degree of risk involved in trading. Any information and/or content is intended entirely for research, educational and informational purposes only and does not constitute investment or consultation advice or investment strategy. The information is not tailored to the investment needs of any specific person and therefore does not involve a consideration of any of the investment objectives, financial situation or needs of any viewer that may receive it. Kindly also note that past performance is not a reliable indicator of future results. Actual results may differ materially from those anticipated in forward-looking or past performance statements. We assume no liability as to the accuracy or completeness of any of the information and/or content provided herein and the Company cannot be held responsible for any omission, mistake nor for any loss or damage including without limitation to any loss of profit which may arise from reliance on any information supplied by Everest Fortune Group.
EURUSD Potential UpsidesHey Traders, in today's trading session we are monitoring EURUSD for a buying opportunity around 1.17600 zone, EURUSD is trading in an uptrend and currently is in a correction phase in which it is approaching the trend at 1.17600 support and resistance area.
Trade safe, Joe.

GBP/NZD BEST PLACE TO BUY FROM|LONG
Hello, Friends!
Bullish trend on GBP/NZD, defined by the green colour of the last week candle combined with the fact the pair is oversold based on the BB lower band proximity, makes me expect a bullish rebound from the support line below and a retest of the local target above at 2.267.
Disclosure: I am part of Trade Nation's Influencer program and receive a monthly fee for using their TradingView charts in my analysis.
✅LIKE AND COMMENT MY IDEAS✅

NZDCHF – Waiting for a Reaction at Key LevelWe’re waiting for price to reach our marked zone.
✅ Short is the primary scenario — but only with a valid bearish signal.
❗️If the zone breaks and price confirms above, we’ll look to buy after a proper pullback and signal.
We don’t predict — we prepare.
The market decides, we just follow with structure and discipline.

NZDJPY to find sellers at market price?NZDJPY - 24h expiry
Trading has been mixed and volatile.
Price action looks to be forming a top.
We look for a temporary move higher.
Preferred trade is to sell into rallies.
Bespoke resistance is located at 87.80.
We look to Sell at 87.80 (stop at 88.00)
Our profit targets will be 87.00 and 86.85
Resistance: 87.80 / 88.00 / 88.25
Support: 87.20 / 87.00 / 86.75
Risk Disclaimer
The trade ideas beyond this page are for informational purposes only and do not constitute investment advice or a solicitation to trade. This information is provided by Signal Centre, a third-party unaffiliated with OANDA, and is intended for general circulation only. OANDA does not guarantee the accuracy of this information and assumes no responsibilities for the information provided by the third party. The information does not take into account the specific investment objectives, financial situation, or particular needs of any particular person. You should take into account your specific investment objectives, financial situation, and particular needs before making a commitment to trade, including seeking advice from an independent financial adviser regarding the suitability of the investment, under a separate engagement, as you deem fit.
You accept that you assume all risks in independently viewing the contents and selecting a chosen strategy.
Where the research is distributed in Singapore to a person who is not an Accredited Investor, Expert Investor or an Institutional Investor, Oanda Asia Pacific Pte Ltd (“OAP“) accepts legal responsibility for the contents of the report to such persons only to the extent required by law. Singapore customers should contact OAP at 6579 8289 for matters arising from, or in connection with, the information/research distributed.

NZD_JPY WAIT FOR BREAKOUT|LONG|
✅NZD_JPY is trading in an
Uptrend and the pair has formed
A bullish triangle pattern
And we are bullish biased
So IF we see a bullish breakout
It will be our signal that
A bullish continuation is
Likely and we will be
Able to enter a long trade
LONG🚀
✅Like and subscribe to never miss a new idea!✅
Disclosure: I am part of Trade Nation's Influencer program and receive a monthly fee for using their TradingView charts in my analysis.
