GBP/NZD SELLERS WILL DOMINATE THE MARKET|SHORT
Hello, Friends!
We are targeting the 2.241 level area with our short trade on GBP/NZD which is based on the fact that the pair is overbought on the BB band scale and is also approaching a resistance line above thus going us a good entry option.
Disclosure: I am part of Trade Nation's Influencer program and receive a monthly fee for using their TradingView charts in my analysis.
✅LIKE AND COMMENT MY IDEAS✅
NZD (New Zealand Dollar)

NZD_JPY WILL KEEP GROWING|LONG|
✅NZD_JPY is trading along
The rising support line
And as the pair is going up now
After the retest of the line
I am expecting the price to keep growing
To retest the supply levels above at 87.429
LONG🚀
✅Like and subscribe to never miss a new idea!✅
Disclosure: I am part of Trade Nation's Influencer program and receive a monthly fee for using their TradingView charts in my analysis.

GBPNZD What Next? BUY!
My dear followers,
This is my opinion on the GBPNZD next move:
The asset is approaching an important pivot point 2.2338
Bias - Bullish
Safe Stop Loss - 2.2269
Technical Indicators: Supper Trend generates a clear long signal while Pivot Point HL is currently determining the overall Bullish trend of the market.
Goal - 2.2459
About Used Indicators:
For more efficient signals, super-trend is used in combination with other indicators like Pivot Points.
Disclosure: I am part of Trade Nation's Influencer program and receive a monthly fee for using their TradingView charts in my analysis.
———————————
WISH YOU ALL LUCK

! Audnzd Sell !audnzd is currently in a bearish trend on the Daily tf. its also trading inside of a Daily Supply zone. at the moment price is rejecting off a 30 and 15 poi levels. giving they are also in the Daily supply zone we have confluence added strength the Daily bearish bias. there are 4hr key levels underneath. im waiting to under for a close under the area where theres a 4hr and 15m key level close to each other.

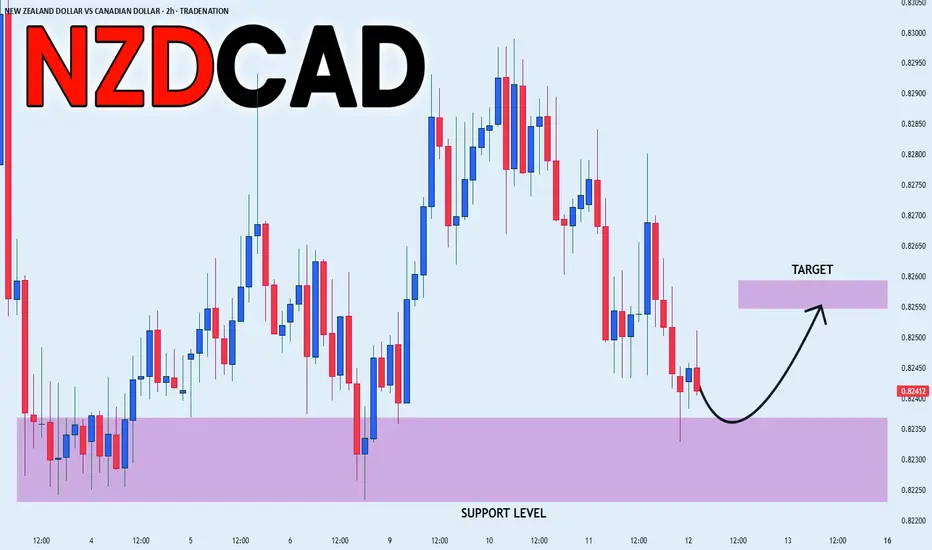
NZD_CAD RISKY LONG|
✅NZD_CAD has been falling recently
And the pair seems locally oversold
So as the pair is approaching a horizontal support of 0.8230
Price growth is to be expected
LONG🚀
✅Like and subscribe to never miss a new idea!✅
Disclosure: I am part of Trade Nation's Influencer program and receive a monthly fee for using their TradingView charts in my analysis.
GBP-NZD Resistance Ahead! Sell!
Hello,Traders!
GBP-NZD keeps growing
But the pair will soon hit
A horizontal resistance
Level above at 2.2540
So after the retest we
Will be expecting a
Local bearish pullback
Sell!
Comment and subscribe to help us grow!
Check out other forecasts below too!
Disclosure: I am part of Trade Nation's Influencer program and receive a monthly fee for using their TradingView charts in my analysis.

Bearish drop?NZD/CHF has reacted off the pivot and could drop to the 1st support.
Pivot: 0.49574
1st Support: 0.49171
1st Resistance: 0.49801
Risk Warning:
Trading Forex and CFDs carries a high level of risk to your capital and you should only trade with money you can afford to lose. Trading Forex and CFDs may not be suitable for all investors, so please ensure that you fully understand the risks involved and seek independent advice if necessary.
Disclaimer:
The above opinions given constitute general market commentary, and do not constitute the opinion or advice of IC Markets or any form of personal or investment advice.
Any opinions, news, research, analyses, prices, other information, or links to third-party sites contained on this website are provided on an "as-is" basis, are intended only to be informative, is not an advice nor a recommendation, nor research, or a record of our trading prices, or an offer of, or solicitation for a transaction in any financial instrument and thus should not be treated as such. The information provided does not involve any specific investment objectives, financial situation and needs of any specific person who may receive it. Please be aware, that past performance is not a reliable indicator of future performance and/or results. Past Performance or Forward-looking scenarios based upon the reasonable beliefs of the third-party provider are not a guarantee of future performance. Actual results may differ materially from those anticipated in forward-looking or past performance statements. IC Markets makes no representation or warranty and assumes no liability as to the accuracy or completeness of the information provided, nor any loss arising from any investment based on a recommendation, forecast or any information supplied by any third-party.

#GBPNZD:+1000 PIPS Two Take Profit Swing Buy Analysis The price is currently consolidating, indicating no clear move. We’re looking for a safe entry point here. There are two potential targets for setting your take profit. We anticipate a strong price reversal on this pair and significant volume in the coming weeks.
Good luck! Show us some support by liking and commenting on the ideas.
Team Setupsfx_

NZDJPY Potential UpsidesHey Traders, in today's trading session we are monitoring NZDJPY for a buying opportunity around 87.350 zone, NZDJPY is trading in an uptrend and currently is in a correction phase in which it is approaching the trend at 87.350 support and resistance area.
Trade safe, Joe.

NZD_CHF BEARISH BIAS|SHORT|
✅NZD_CHF has retested a key resistance level of 0.5000
And as the pair is already making a bearish pullback
A move down to retest the demand level below at 0.4941 is likely
SHORT🔥
✅Like and subscribe to never miss a new idea!✅
Disclosure: I am part of Trade Nation's Influencer program and receive a monthly fee for using their TradingView charts in my analysis.

Bullish bounce?The Kiwi (NZD/USD) is falling towards the pivot which acts as an overlap support and could bounce to the 1st resistance.
Pivot: 0.5989
1st Support: 0.5939
1st Resistance: 0.6060
Risk Warning:
Trading Forex and CFDs carries a high level of risk to your capital and you should only trade with money you can afford to lose. Trading Forex and CFDs may not be suitable for all investors, so please ensure that you fully understand the risks involved and seek independent advice if necessary.
Disclaimer:
The above opinions given constitute general market commentary, and do not constitute the opinion or advice of IC Markets or any form of personal or investment advice.
Any opinions, news, research, analyses, prices, other information, or links to third-party sites contained on this website are provided on an "as-is" basis, are intended only to be informative, is not an advice nor a recommendation, nor research, or a record of our trading prices, or an offer of, or solicitation for a transaction in any financial instrument and thus should not be treated as such. The information provided does not involve any specific investment objectives, financial situation and needs of any specific person who may receive it. Please be aware, that past performance is not a reliable indicator of future performance and/or results. Past Performance or Forward-looking scenarios based upon the reasonable beliefs of the third-party provider are not a guarantee of future performance. Actual results may differ materially from those anticipated in forward-looking or past performance statements. IC Markets makes no representation or warranty and assumes no liability as to the accuracy or completeness of the information provided, nor any loss arising from any investment based on a recommendation, forecast or any information supplied by any third-party.

Potential bearish drop off major resistance?NZD/USD has rejected off the resistance level which is a pullback resistance and could drop from this level to our take profit.
Entry: 0.6061
Why we like it:
There is a pullback resistance level.
Stop loss: 0.6080
Why we like it:
There is a pullback resistance level.
Take profit: 0.6010
Why we like it:
There is a pullback support level.
Enjoying your TradingView experience? Review us!
Please be advised that the information presented on TradingView is provided to Vantage (‘Vantage Global Limited’, ‘we’) by a third-party provider (‘Everest Fortune Group’). Please be reminded that you are solely responsible for the trading decisions on your account. There is a very high degree of risk involved in trading. Any information and/or content is intended entirely for research, educational and informational purposes only and does not constitute investment or consultation advice or investment strategy. The information is not tailored to the investment needs of any specific person and therefore does not involve a consideration of any of the investment objectives, financial situation or needs of any viewer that may receive it. Kindly also note that past performance is not a reliable indicator of future results. Actual results may differ materially from those anticipated in forward-looking or past performance statements. We assume no liability as to the accuracy or completeness of any of the information and/or content provided herein and the Company cannot be held responsible for any omission, mistake nor for any loss or damage including without limitation to any loss of profit which may arise from reliance on any information supplied by Everest Fortune Group.

NZDCAD: Price Action & Swing Analysis
It is essential that we apply multitimeframe technical analysis and there is no better example of why that is the case than the current NZDCAD chart which, if analyzed properly, clearly points in the downward direction.
Disclosure: I am part of Trade Nation's Influencer program and receive a monthly fee for using their TradingView charts in my analysis.
❤️ Please, support our work with like & comment! ❤️

NZDUSD Potential UpsidesHey Traders, in today's trading session we are monitoring NZDUSD for a buying opportunity around 0.60350 zone, NZDUSD is trading in an uptrend and currently is in a correction phase in which it is approaching the trend at 0.60350 support and resistance area.
Trade safe, Joe.

A Detailed Technical, Fundamental, and Macro AnalysisNZD/USD Trading Plan: A Detailed Technical, Fundamental, and Macro Analysis
1. Technical Analysis:
The 30-minute chart of NZD/USD highlights key price action within a well-defined channel between crucial support and resistance levels:
Resistance (0.60769): The price is testing significant resistance around 0.60769. If this level is broken, the price could continue higher, indicating further upward momentum.
Support (0.60271): A strong support level is found at 0.60271. If the price retraces and holds this level, a potential rebound could take place.
EMA (Exponential Moving Averages):
EMA 13 (Blue): Currently moving upwards, confirming a bullish short-term trend.
EMA 34 (Yellow) and EMA 89 (Red): These are trending sideways, suggesting that the market is in a consolidation phase, waiting for further signals.
2. Fundamental Analysis:
FED's Monetary Policy: The actions and statements of the Federal Reserve regarding interest rates have a significant impact on the USD. If the FED maintains or hikes rates, this could push the USD higher, putting downward pressure on NZD.
New Zealand Economic Indicators: The strength of New Zealand's economy, particularly export data, plays a vital role in supporting or weakening the NZD. Positive economic reports could support a bullish NZD.
3. Macroeconomic Analysis:
Global Risk Sentiment: Market sentiment is being influenced by global factors like trade tensions, economic growth projections, and political factors. A shift in risk sentiment, especially regarding the U.S. economy or geopolitical tensions, could lead to significant price movements in the NZD/USD pair.
4. Buy and Sell Zones:
BUY ZONE:
Entry: 0.60271 - 0.60300
SL (Stop Loss): 0.60200
TP (Take Profit): 0.60700 → 0.60769 → 0.60900
SELL ZONE:
Entry: 0.60750 - 0.60800
SL: 0.60900
TP: 0.60300 → 0.60200 → 0.60100
5. Strategy:
Buy Orders: If price consolidates at the support level of 0.60271 and shows confirmation with EMA indicators, consider a buy with a target at 0.60769.
Sell Orders: If price fails to break through the resistance at 0.60769, a sell order could be placed, targeting the 0.60271 support level.
6. Market Sentiment:
The market is highly sensitive to news and economic reports, and therefore, it is essential to remain alert to potential volatility. Any major economic release from New Zealand or U.S. Federal Reserve news could significantly influence the pair.

SHORT ON NZD/JPYNZD/JPY has given us a CHOC (change or character) to the downside breaking a previous low.
I will be looking for NZD/JPY to retouch the supply area before dropping.
Aiming for 100-200 pips easy!

GBP/NZD Giving Amazing Bearish P.A , Be Ready For Extra 250 PipsHere is my opinion on GBP/NZD , this pair is very bearish and now we have a very good breakout for second support and we have a very good closure below it so i see that we have a good chance to sell it when the price go back to retest the broken support if we have a good touch and bearish price action , we can targeting 200 pips .

GBPNZD Is Going Down! Sell!
Please, check our technical outlook for GBPNZD.
Time Frame: 9h
Current Trend: Bearish
Sentiment: Overbought (based on 7-period RSI)
Forecast: Bearish
The market is approaching a key horizontal level 2.249.
Considering the today's price action, probabilities will be high to see a movement to 2.237.
P.S
Please, note that an oversold/overbought condition can last for a long time, and therefore being oversold/overbought doesn't mean a price rally will come soon, or at all.
Disclosure: I am part of Trade Nation's Influencer program and receive a monthly fee for using their TradingView charts in my analysis.
Like and subscribe and comment my ideas if you enjoy them!

Falling towards overlap support?The Kiwi (NZD/USD) is falling towards the pivot and could bounce to the 1st resistance.
Pivot: 0.5989
1st Support: 0.5939
1st Resistance: 0.6080
Risk Warning:
Trading Forex and CFDs carries a high level of risk to your capital and you should only trade with money you can afford to lose. Trading Forex and CFDs may not be suitable for all investors, so please ensure that you fully understand the risks involved and seek independent advice if necessary.
Disclaimer:
The above opinions given constitute general market commentary, and do not constitute the opinion or advice of IC Markets or any form of personal or investment advice.
Any opinions, news, research, analyses, prices, other information, or links to third-party sites contained on this website are provided on an "as-is" basis, are intended only to be informative, is not an advice nor a recommendation, nor research, or a record of our trading prices, or an offer of, or solicitation for a transaction in any financial instrument and thus should not be treated as such. The information provided does not involve any specific investment objectives, financial situation and needs of any specific person who may receive it. Please be aware, that past performance is not a reliable indicator of future performance and/or results. Past Performance or Forward-looking scenarios based upon the reasonable beliefs of the third-party provider are not a guarantee of future performance. Actual results may differ materially from those anticipated in forward-looking or past performance statements. IC Markets makes no representation or warranty and assumes no liability as to the accuracy or completeness of the information provided, nor any loss arising from any investment based on a recommendation, forecast or any information supplied by any third-party.

GBPUSDHello Traders! 👋
What are your thoughts on GBPUSD?
GBP/USD has reached a key resistance zone and is currently trading below it. A bearish divergence has also formed, signaling potential weakness in bullish momentum.
Given the confluence of resistance and negative divergence, we expect the price to struggle breaking above this level and likely decline toward the specified support zones.
Unless price breaks above the resistance decisively, the bias remains bearish in the short term.
Don’t forget to like and share your thoughts in the comments! ❤️

gbpnzd buy signal. Don't forget about stop-loss.
Write in the comments all your questions and instruments analysis of which you want to see.
Friends, push the like button, write a comment, and share with your mates - that would be the best THANK YOU.
P.S. I personally will open entry if the price will show it according to my strategy.
Always make your analysis before a trade

GBP_NZD GROWTH AHEAD|LONG|
✅GBP_NZD went down to retest
A horizontal support of 2.2346
Which makes me locally bullish biased
And I think that a move up
From the level is to be expected
Towards the target above 2.2449
LONG🚀
✅Like and subscribe to never miss a new idea!✅
Disclosure: I am part of Trade Nation's Influencer program and receive a monthly fee for using their TradingView charts in my analysis.

NZDUSD to continue in the upward move?NZDUSD - 24h expiry
There is no clear indication that the upward move is coming to an end.
Although we remain bullish overall, a correction is possible with plenty of room to move lower without impacting the trend higher.
Risk/Reward would be poor to call a buy from current levels.
A move through 0.6050 will confirm the bullish momentum.
The measured move target is 0.6075.
We look to Buy at 0.6020 (stop at 0.5995)
Our profit targets will be 0.6070 and 0.6075
Resistance: 0.6050 / 0.6070 / 0.6075
Support: 0.6025 / 0.6020 / 0.6000
Risk Disclaimer
The trade ideas beyond this page are for informational purposes only and do not constitute investment advice or a solicitation to trade. This information is provided by Signal Centre, a third-party unaffiliated with OANDA, and is intended for general circulation only. OANDA does not guarantee the accuracy of this information and assumes no responsibilities for the information provided by the third party. The information does not take into account the specific investment objectives, financial situation, or particular needs of any particular person. You should take into account your specific investment objectives, financial situation, and particular needs before making a commitment to trade, including seeking advice from an independent financial adviser regarding the suitability of the investment, under a separate engagement, as you deem fit.
You accept that you assume all risks in independently viewing the contents and selecting a chosen strategy.
Where the research is distributed in Singapore to a person who is not an Accredited Investor, Expert Investor or an Institutional Investor, Oanda Asia Pacific Pte Ltd (“OAP“) accepts legal responsibility for the contents of the report to such persons only to the extent required by law. Singapore customers should contact OAP at 6579 8289 for matters arising from, or in connection with, the information/research distributed.
Update idea
Add note
