GBPNZD Pushing itself in a buy directionHello Traders
In This Chart GBPNZD 4 HOURLY Forex Forecast By FOREX PLANET
today GBPNZD analysis 👆
🟢This Chart includes GBPNZD market update)
🟢What is The Next Opportunity on EURNZD Market
🟢how to Enter to the Valid Entry With Assurance Profit
This CHART is For Trader's that Want to Improve Their Technical Analysis Skills and Their Trading By Understanding How To Analyze The Market Using Multiple Timeframes and Understanding The Bigger Picture on the Charts
NZD (New Zealand Dollar)

GBPNZD Is Very Bullish! Long!
Here is our detailed technical review for GBPNZD.
Time Frame: 1D
Current Trend: Bullish
Sentiment: Oversold (based on 7-period RSI)
Forecast: Bullish
The market is trading around a solid horizontal structure 2.262.
The above observations make me that the market will inevitably achieve 2.298 level.
P.S
The term oversold refers to a condition where an asset has traded lower in price and has the potential for a price bounce.
Overbought refers to market scenarios where the instrument is traded considerably higher than its fair value. Overvaluation is caused by market sentiments when there is positive news.
Disclosure: I am part of Trade Nation's Influencer program and receive a monthly fee for using their TradingView charts in my analysis.
Like and subscribe and comment my ideas if you enjoy them!

NZDCHF BULLISH OR BEARISH DETAILED ANALYSIS ??NZDCHF is currently consolidating in a textbook bullish flag pattern after a sharp recovery from the recent lows near 0.4680. Price action is compressing just below a key supply zone around 0.4950–0.4980, signaling a potential breakout setup as momentum builds. This flag is forming after a clear impulse move, and with the structure respecting higher lows, I’m preparing for a bullish continuation toward the 0.5100–0.5150 target zone.
Fundamentally, the New Zealand dollar is gaining strength supported by the RBNZ's firm hold on tight monetary policy, as inflation remains sticky in services and housing. Governor Orr’s latest comments reaffirmed that the central bank is not ready to pivot until they see a clear disinflationary trend. On the other hand, the Swiss franc is showing signs of weakness, as the SNB remains one of the most dovish central banks in the G10 space, with real interest rates still negative and inflation pressures easing significantly.
Technically, we’re in a bullish structure with key demand holding strong at the 0.4840–0.4860 range. Price is now coiling just under resistance, and a clean breakout above the 0.4950 level could ignite the next impulsive leg toward 0.5100. If the breakout confirms with increased volume and market sentiment aligns, this setup presents a high probability long opportunity with a favorable R\:R.
NZDCHF remains on my radar as a breakout trade backed by both technical structure and macro fundamentals. With capital flows favoring the Kiwi and risk appetite rotating back into higher-yielding currencies, this pair offers a solid bullish continuation setup for the coming weeks. Stay patient, let the breakout confirm, and ride the momentum higher.

GBPNZD: Price came back to strong bullish reversal point!GBPNZD reversed from a point we previously pointed out in our analysis. The price moved nicely, but it didn’t continue the bullish trend as we had initially expected. Since the price has decided to retest the bullish zone one more time, we thought it would be a great zone to swing buy GBPNZD. You can set two take-profit targets based on your own analysis and bias.
This analysis is purely for educational and secondary bias purposes only and does not guarantee that the price will move as described in the chart.
We really appreciate your unwavering support! ❤️🚀
If you’d like to lend a hand, here are a few ways you can contribute:
- Give our ideas a like
- Share your thoughts in the comments
- Spread the word about our ideas
Cheers,
Team Setupsfx_

NZDUSD 1D Golden Cross, final bull signal.The NZDUSD pair has been trading within a Channel Up pattern that only broke during the early April sell-off and has found Support near its 1D MA50 (blue trend-line) on its recent May consolidation.
As the 1D MACD just formed the 4th Bullish Cross of the year we expect this long with the emerging 1D Golden Cross to be the final buy signal before a long-term correction. Our Target is 0.60900 representing a +4.30% rise, the minimum previous within this pattern.
-------------------------------------------------------------------------------
** Please LIKE 👍, FOLLOW ✅, SHARE 🙌 and COMMENT ✍ if you enjoy this idea! Also share your ideas and charts in the comments section below! This is best way to keep it relevant, support us, keep the content here free and allow the idea to reach as many people as possible. **
-------------------------------------------------------------------------------
💸💸💸💸💸💸
👇 👇 👇 👇 👇 👇

RBNZ rate decision coming upKeep your eyes on the rate cut tomorrow by the RBNZ and on the NZD reaction to all of it. We have an interesting technical set up building on FX_IDC:NZDUSD . Let's dig in...
MARKETSCOM:NZDUSD
Let us know what you think in the comments below.
Thank you.
77.3% of retail investor accounts lose money when trading CFDs with this provider. You should consider whether you understand how CFDs work and whether you can afford to take the high risk of losing your money. Past performance is not necessarily indicative of future results. The value of investments may fall as well as rise and the investor may not get back the amount initially invested. This content is not intended for nor applicable to residents of the UK. Cryptocurrency CFDs and spread bets are restricted in the UK for all retail clients.

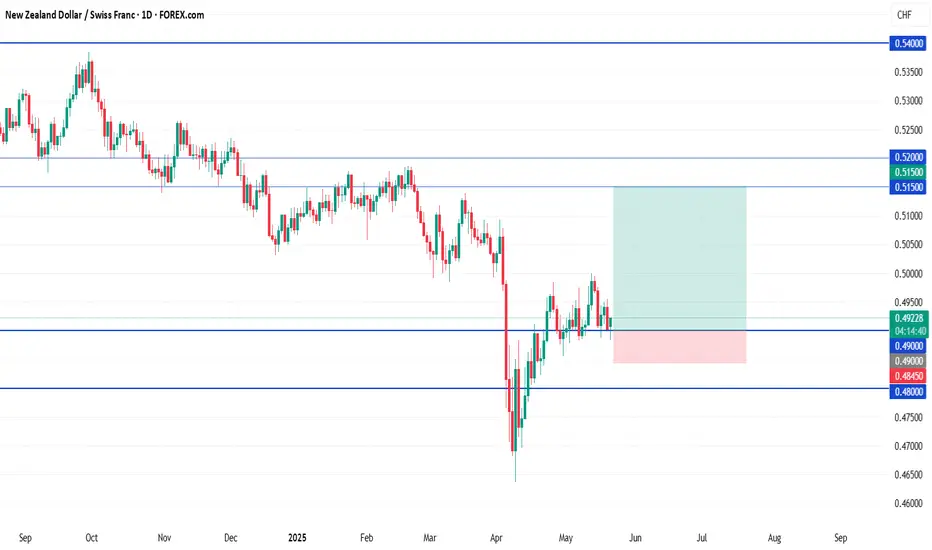
NZD/CHF BEARS WILL DOMINATE THE MARKET|SHORT
NZD/CHF SIGNAL
Trade Direction: short
Entry Level: 0.492
Target Level: 0.486
Stop Loss: 0.495
RISK PROFILE
Risk level: medium
Suggested risk: 1%
Timeframe: 8h
Disclosure: I am part of Trade Nation's Influencer program and receive a monthly fee for using their TradingView charts in my analysis.
✅LIKE AND COMMENT MY IDEAS✅

GBPNZD Trading Opportunity! SELL!
My dear friends,
Please, find my technical outlook for GBPNZD below:
The instrument tests an important psychological level 2.2738
Bias - Bearish
Technical Indicators: Supper Trend gives a precise Bearish signal, while Pivot Point HL predicts price changes and potential reversals in the market.
Target - 2.2584
Recommended Stop Loss - 2.2812
About Used Indicators:
Super-trend indicator is more useful in trending markets where there are clear uptrends and downtrends in price.
Disclosure: I am part of Trade Nation's Influencer program and receive a monthly fee for using their TradingView charts in my analysis.
———————————
WISH YOU ALL LUCK

GBPAUD SHORT TERM SELLS BEFORE TE BUYSGbpAUD is expected to sell for a short term correction before the major buys

Falling towards 61.8% Fibonacci support?AUD/NZD is falling towards the pivot and could bounce to the 1st resistance.
Pivot: 1.0750
1st Support: 1.07095
1st Resistance: 1.08521
Risk Warning:
Trading Forex and CFDs carries a high level of risk to your capital and you should only trade with money you can afford to lose. Trading Forex and CFDs may not be suitable for all investors, so please ensure that you fully understand the risks involved and seek independent advice if necessary.
Disclaimer:
The above opinions given constitute general market commentary, and do not constitute the opinion or advice of IC Markets or any form of personal or investment advice.
Any opinions, news, research, analyses, prices, other information, or links to third-party sites contained on this website are provided on an "as-is" basis, are intended only to be informative, is not an advice nor a recommendation, nor research, or a record of our trading prices, or an offer of, or solicitation for a transaction in any financial instrument and thus should not be treated as such. The information provided does not involve any specific investment objectives, financial situation and needs of any specific person who may receive it. Please be aware, that past performance is not a reliable indicator of future performance and/or results. Past Performance or Forward-looking scenarios based upon the reasonable beliefs of the third-party provider are not a guarantee of future performance. Actual results may differ materially from those anticipated in forward-looking or past performance statements. IC Markets makes no representation or warranty and assumes no liability as to the accuracy or completeness of the information provided, nor any loss arising from any investment based on a recommendation, forecast or any information supplied by any third-party.

Bearish reversal?NZD/JPY is rising towards the pivot and could reverse to the 1st support.
Pivot: 86.38
1st Support: 84.37
1st Resistance: 87.07
Risk Warning:
Trading Forex and CFDs carries a high level of risk to your capital and you should only trade with money you can afford to lose. Trading Forex and CFDs may not be suitable for all investors, so please ensure that you fully understand the risks involved and seek independent advice if necessary.
Disclaimer:
The above opinions given constitute general market commentary, and do not constitute the opinion or advice of IC Markets or any form of personal or investment advice.
Any opinions, news, research, analyses, prices, other information, or links to third-party sites contained on this website are provided on an "as-is" basis, are intended only to be informative, is not an advice nor a recommendation, nor research, or a record of our trading prices, or an offer of, or solicitation for a transaction in any financial instrument and thus should not be treated as such. The information provided does not involve any specific investment objectives, financial situation and needs of any specific person who may receive it. Please be aware, that past performance is not a reliable indicator of future performance and/or results. Past Performance or Forward-looking scenarios based upon the reasonable beliefs of the third-party provider are not a guarantee of future performance. Actual results may differ materially from those anticipated in forward-looking or past performance statements. IC Markets makes no representation or warranty and assumes no liability as to the accuracy or completeness of the information provided, nor any loss arising from any investment based on a recommendation, forecast or any information supplied by any third-party.

Momentum builds in GBP/USD and NZD/USD following tariff delayThe U.S. dollar weakened sharply in recent sessions as President Trump's announcement that the proposed 50% tariffs on EU imports will now be delayed until July 9, giving markets temporary relief.
GBP/USD edged toward 1.3600, testing levels last seen three years ago. The RSI sits just under 60, suggesting there’s still room before overbought conditions are reached. Volume has been gradually increasing, potentially reinforcing the strength of the breakout.
Risk-on flows also lifted the Australian and New Zealand dollars. NZD/USD has broken above the Ichimoku cloud and rose 0.62% on the day. Price is well above the Tenkan-sen (blue) and Kijun-sen (red), indicating strong upward momentum. However, the pair is pulling back slightly after the sharp breakout, suggesting short-term consolidation.

NZD/CHF Technical Outlook – Bullish Reversal in Play! 📅 Chart Date: May 26, 2025
💱 Pair: NZD/CHF
📈 Current Price: 0.49246
📏 Indicators Used:
🔵 200 EMA: 0.50959
🔴 50 EMA: 0.49424
📍 Key Technical Levels:
🟣 Reversal Point (Support Zone): 0.4880 – 0.4930
This zone has shown consistent buying interest. The price recently bounced off this level, indicating strong bullish sentiment forming here.
🟪 Resistance Zone: 0.5080 – 0.5160
This area has previously capped upside movement. It's aligned near the 200 EMA – a significant dynamic resistance.
📈 Bullish Setup Active! 🐂
The price action shows a strong bullish reaction off the reversal zone.
There's a potential higher low forming, indicating a trend reversal.
The price is currently reclaiming the 50 EMA – a bullish sign when followed by strong candles.
If momentum continues, we could see a target retest of the resistance zone around 0.51+ 🔝
⚠️ Watch Out:
A rejection from the 50 EMA may lead to another dip toward the support zone.
Bearish confirmation only below 0.4880 with strong volume 🔻
📌 Conclusion:
This chart suggests a bullish momentum building up in NZD/CHF. As long as price holds above the reversal zone, we can expect a push toward the resistance area. A break above 0.5160 would confirm a medium-term trend reversal. 📈🔥
💡 Traders Tip: Consider entries above 0.4945 with SL below 0.4880 and TP around 0.5080–0.5160. 🎯

Potential bearish drop?NZD/JPY is reacting off the resistance level which is a pullback resistance that aligns with the 50% Fibonacci retracement and could drop from this level to our take profit.
Entry: 86.13
Why we like it:
There is a pullback resistance level that lines up with the 50% Fibonacci retracement.
Stop loss: 87.09
Why we like it:
There is a pullback resistance level that lines up with the 78.6% Fibonacci retracement.
Take profit: 84.73
Why we like it:
There is a pullback support level.
Enjoying your TradingView experience? Review us!
Please be advised that the information presented on TradingView is provided to Vantage (‘Vantage Global Limited’, ‘we’) by a third-party provider (‘Everest Fortune Group’). Please be reminded that you are solely responsible for the trading decisions on your account. There is a very high degree of risk involved in trading. Any information and/or content is intended entirely for research, educational and informational purposes only and does not constitute investment or consultation advice or investment strategy. The information is not tailored to the investment needs of any specific person and therefore does not involve a consideration of any of the investment objectives, financial situation or needs of any viewer that may receive it. Kindly also note that past performance is not a reliable indicator of future results. Actual results may differ materially from those anticipated in forward-looking or past performance statements. We assume no liability as to the accuracy or completeness of any of the information and/or content provided herein and the Company cannot be held responsible for any omission, mistake nor for any loss or damage including without limitation to any loss of profit which may arise from reliance on any information supplied by Everest Fortune Group.

NZD/JPY BEARISH BIAS RIGHT NOW| SHORT
NZD/JPY SIGNAL
Trade Direction: short
Entry Level: 85.992
Target Level: 83.908
Stop Loss: 87.366
RISK PROFILE
Risk level: medium
Suggested risk: 1%
Timeframe: 1D
Disclosure: I am part of Trade Nation's Influencer program and receive a monthly fee for using their TradingView charts in my analysis.
✅LIKE AND COMMENT MY IDEAS✅

gbpnzd buy signal. Don't forget about stop-loss.
Write in the comments all your questions and instruments analysis of which you want to see.
Friends, push the like button, write a comment, and share with your mates - that would be the best THANK YOU.
P.S. I personally will open entry if the price will show it according to my strategy.
Always make your analysis before a trade

GBPNZD | 19.05.2025SELL 2.26800 | STOP 2.28800 | TAKE 2.24400 | The pound has been showing gains since the opening of this week's trading. In this pair we expect an approach to the strong resistance in the range of 2.26800 - 2.28500 and reversal of the movement down to the local support. We are also oriented on the publication of economic data this week.

GBPNZD: 1100+ PIPs Move, Get Ready For Price To Bounce! Hey there everyone
We’re feeling optimistic about GBPNZD and expecting a bullish move that could take it to its previous yearly high. We’ve set three take profit targets, but feel free to adjust them based on your own analysis.
Good luck and trade safely! We really appreciate your unwavering support! ❤️🚀
If you’d like to lend a hand, here are a few ways you can contribute:
- Give our ideas a like
- Share your thoughts in the comments
- Spread the word about our ideas
Cheers,
Team Setupsfx_

NZD/JPY "Kiwi vs Yen" Forex Bank Heist (Day Trade Plan)🌟Hi! Hola! Ola! Bonjour! Hallo! Marhaba!🌟
Dear Money Makers & Robbers, 🤑 💰💸✈️
Based on 🔥Thief Trading style technical and fundamental analysis🔥, here is our master plan to heist the NZD/JPY "Kiwi vs Yen" Forex Bank Heist. Please adhere to the strategy I've outlined in the chart, which emphasizes long entry. Our aim is to escape near the high-risk Yellow MA Zone. Risky level, overbought market, consolidation, trend reversal, trap at the level where traders and bearish robbers are stronger. 🏆💸"Take profit and treat yourself, traders. You deserve it!💪🏆🎉
Entry 📈 : "The heist is on! Wait for the Crossing previous high (86.000) then make your move - Bullish profits await!"
however I advise to Place Buy stop orders above the Moving average (or) Place buy limit orders within a 15 or 30 minute timeframe most recent or swing, low or high level for Pullback entries.
📌I strongly advise you to set an "alert (Alarm)" on your chart so you can see when the breakout entry occurs.
Stop Loss 🛑: "🔊 Yo, listen up! 🗣️ If you're lookin' to get in on a buy stop order, don't even think about settin' that stop loss till after the breakout 🚀. You feel me? Now, if you're smart, you'll place that stop loss where I told you to 📍, but if you're a rebel, you can put it wherever you like 🤪 - just don't say I didn't warn you ⚠️. You're playin' with fire 🔥, and it's your risk, not mine 👊."
📍 Thief SL placed at the nearest/swing low level Using the 30mins timeframe (84.800) Day trade basis.
📍 SL is based on your risk of the trade, lot size and how many multiple orders you have to take.
🏴☠️Target 🎯: 88.000
🧲Scalpers, take note 👀 : only scalp on the Long side. If you have a lot of money, you can go straight away; if not, you can join swing traders and carry out the robbery plan. Use trailing SL to safeguard your money 💰.
💰💵💸NZD/JPY "Kiwi vs Yen" Forex Bank Heist (Day Trade Plan) is currently experiencing a bullishness,., driven by several key factors. .☝☝☝
📰🗞️Get & Read the Fundamental, Macro Economics, COT Report, Quantitative Analysis, Sentimental Outlook, Intermarket Analysis, Future trend targets with overall score... go ahead to check 👉👉👉🔗🔗🔗
⚠️Trading Alert : News Releases and Position Management 📰🗞️🚫🚏
As a reminder, news releases can have a significant impact on market prices and volatility. To minimize potential losses and protect your running positions,
we recommend the following:
Avoid taking new trades during news releases
Use trailing stop-loss orders to protect your running positions and lock in profits
💖Supporting our robbery plan 💥Hit the Boost Button💥 will enable us to effortlessly make and steal money 💰💵. Boost the strength of our robbery team. Every day in this market make money with ease by using the Thief Trading Style.🏆💪🤝❤️🎉🚀
I'll see you soon with another heist plan, so stay tuned 🤑🐱👤🤗🤩

GBP/NZD BEARS ARE GAINING STRENGTH|SHORT
Hello, Friends!
The BB upper band is nearby so GBP-NZD is in the overbought territory. Thus, despite the uptrend on the 1W timeframe I think that we will see a bearish reaction from the resistance line above and a move down towards the target at around 2.225.
Disclosure: I am part of Trade Nation's Influencer program and receive a monthly fee for using their TradingView charts in my analysis.
✅LIKE AND COMMENT MY IDEAS✅

NZDCAD The Target Is UP! BUY!
My dear followers,
This is my opinion on the NZDCAD next move:
The asset is approaching an important pivot point 0.8191
Bias - Bullish
Technical Indicators: Supper Trend generates a clear long signal while Pivot Point HL is currently determining the overall Bullish trend of the market.
Goal - 0.8219
About Used Indicators:
For more efficient signals, super-trend is used in combination with other indicators like Pivot Points.
Disclosure: I am part of Trade Nation's Influencer program and receive a monthly fee for using their TradingView charts in my analysis.
———————————
WISH YOU ALL LUCK

GBPNZD – Bearish Rejection + Fundamental DivergenceGBPNZD is facing strong resistance at 2.2757, where price is showing signs of a double top / lower high formation. This zone aligns with prior rejection highs and is reinforced by bearish price action. Momentum is fading, and sellers are beginning to step in.
A break below 2.2500 confirms downside pressure, targeting:
2.2178 – Structural support
2.2002 – Demand area
2.1810 – Swing base
2.1677 – Final bearish extension zone
Fundamental Overview:
🔻 GBP Headwinds:
UK CPI came in hot recently, but forward guidance shows the Bank of England may not hike further.
Growth concerns and mixed economic signals keep GBP vulnerable, especially with weak retail data and subdued consumer confidence.
Political uncertainty and trade tensions with the EU are also weighing on sentiment.
🟢 NZD Tailwinds:
The RBNZ remains relatively hawkish, with inflation still above target and robust employment holding up.
Strong dairy prices and resilient trade balance support the NZ economy.
Risk appetite has been favorable for commodity-linked currencies like NZD.
Summary:
Bias: Bearish below 2.2757
Trigger: Break & close below 2.2500
Targets: 2.2178 → 2.2002 → 2.1810
Invalidation: Break above 2.2800
Fundamental divergence supports downside: GBP faces policy uncertainty and growth risks, while NZD holds firm on RBNZ stance and stable macro backdrop.
