They Had to Take Before They Could GivePrice swept below the previous day’s low (PDL), triggered liquidity, and gave us a clean BOS. This isn’t random, it’s intention.
Now, we wait to see if the market delivers the follow-through into that FVG below.
Your job isn’t to chase price. Your job is to recognize its story.
NZDCAD

NZDCAD Is Going Down! Sell!
Take a look at our analysis for NZDCAD.
Time Frame: 1h
Current Trend: Bearish
Sentiment: Overbought (based on 7-period RSI)
Forecast: Bearish
The market is testing a major horizontal structure 0.825.
Taking into consideration the structure & trend analysis, I believe that the market will reach 0.822 level soon.
P.S
Overbought describes a period of time where there has been a significant and consistent upward move in price over a period of time without much pullback.
Disclosure: I am part of Trade Nation's Influencer program and receive a monthly fee for using their TradingView charts in my analysis.
Like and subscribe and comment my ideas if you enjoy them!

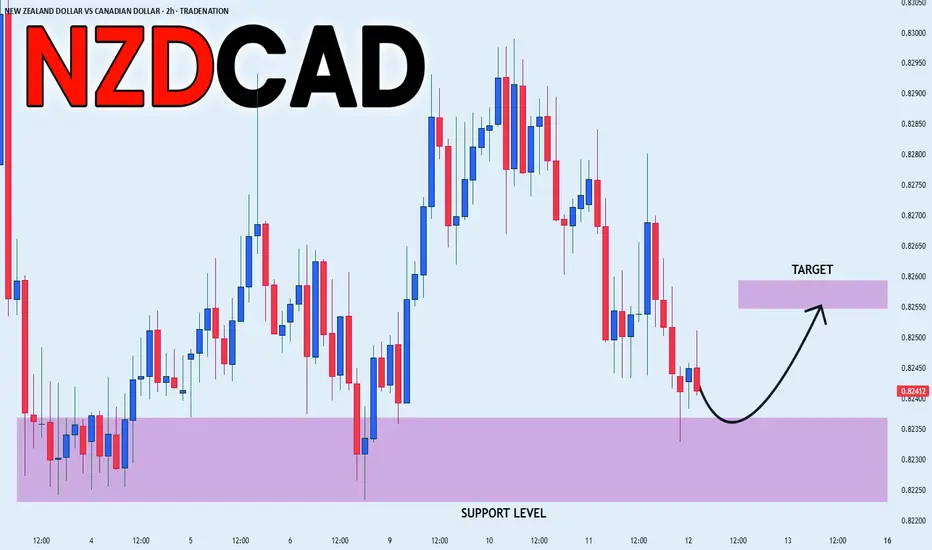
NZD_CAD REBOUND AHEAD|LONG|
✅NZD_CAD is set to retest a
Strong support level below at 0.8160
After trading in a local downtrend for some time
Which makes a bullish rebound a likely scenario
With the target being a local resistance above at 0.8182
LONG🚀
✅Like and subscribe to never miss a new idea!✅
Disclosure: I am part of Trade Nation's Influencer program and receive a monthly fee for using their TradingView charts in my analysis.

NZD-CAD Free Signal! Buy!
Hello,Traders!
NZD-CAD is about to retest
A horizontal support level
Of 0.8161 from where we
Will be expecting a local
Bullish rebound so we can
Enter a long trade with the
Take Profit of 0.8191 and
The Stop Loss of 0.8153
Buy!
Comment and subscribe to help us grow!
Check out other forecasts below too!
Disclosure: I am part of Trade Nation's Influencer program and receive a monthly fee for using their TradingView charts in my analysis.

NZD_CAD RISKY LONG|
✅NZD_CAD has been falling recently
And the pair seems locally oversold
So as the pair is approaching a horizontal support of 0.8230
Price growth is to be expected
LONG🚀
✅Like and subscribe to never miss a new idea!✅
Disclosure: I am part of Trade Nation's Influencer program and receive a monthly fee for using their TradingView charts in my analysis.
NZDCAD: Price Action & Swing Analysis
It is essential that we apply multitimeframe technical analysis and there is no better example of why that is the case than the current NZDCAD chart which, if analyzed properly, clearly points in the downward direction.
Disclosure: I am part of Trade Nation's Influencer program and receive a monthly fee for using their TradingView charts in my analysis.
❤️ Please, support our work with like & comment! ❤️

NZDCAD Selling Trading IdeaHello Traders
In This Chart nzdcad HOURLY Forex Forecast By FOREX PLANET
today NZDCAD analysis 👆
🟢This Chart includes_ (NZDCAD market update)
🟢What is The Next Opportunity on NZDCAD Market
🟢how to Enter to the Valid Entry With Assurance Profit
This CHART is For Trader's that Want to Improve Their Technical Analysis Skills and Their Trading By Understanding How To Analyze The Market Using Multiple Timeframes and Understanding The Bigger Picture on the Charts

NZDCAD - Lucrative Range!Hello TradingView Family / Fellow Traders. This is Richard, also known as theSignalyst.
📈NZDCAD has been hovering within a range between the red support and blue resistance.
This week, NZDCAD has been bearish and approaching the red support.
Moreover, it is retesting the lower bound of its rising wedge pattern in blue.
🏹 Thus, the highlighted blue circle is a strong area to look for buy setups as it is the intersection of support and lower blue trendline acting as a non-horizontal support.
📚 As per my trading style:
As #NZDCAD approaches the blue circle zone, I will be looking for bullish reversal setups (like a double bottom pattern, trendline break , and so on...)
📚 Always follow your trading plan regarding entry, risk management, and trade management.
Good luck!
All Strategies Are Good; If Managed Properly!
~Rich
Disclosure: I am part of Trade Nation's Influencer program and receive a monthly fee for using their TradingView charts in my analysis.

NZD_CAD RISKY SHORT|
✅NZD_CAD went up to retest
A horizontal resistance of 0.8276
Which makes me locally bearish biased
And I think that we will see a pullback
And a move down from the level
Towards the target below at 0.8251
SHORT🔥
✅Like and subscribe to never miss a new idea!✅
Disclosure: I am part of Trade Nation's Influencer program and receive a monthly fee for using their TradingView charts in my analysis.

NZDCAD Selling Trading IdeaHello Traders
In This Chart nzdcad HOURLY Forex Forecast By FOREX PLANET
today NZDCAD analysis 👆
🟢This Chart includes_ (NZDCAD market update)
🟢What is The Next Opportunity on NZDCAD Market
🟢how to Enter to the Valid Entry With Assurance Profit
This CHART is For Trader's that Want to Improve Their Technical Analysis Skills and Their Trading By Understanding How To Analyze The Market Using Multiple Timeframes and Understanding The Bigger Picture on the Charts

NZDCHF BULLISH OR BEARISH DETAILED ANALYSIS ??NZDCHF is currently consolidating in a textbook bullish flag pattern after a sharp recovery from the recent lows near 0.4680. Price action is compressing just below a key supply zone around 0.4950–0.4980, signaling a potential breakout setup as momentum builds. This flag is forming after a clear impulse move, and with the structure respecting higher lows, I’m preparing for a bullish continuation toward the 0.5100–0.5150 target zone.
Fundamentally, the New Zealand dollar is gaining strength supported by the RBNZ's firm hold on tight monetary policy, as inflation remains sticky in services and housing. Governor Orr’s latest comments reaffirmed that the central bank is not ready to pivot until they see a clear disinflationary trend. On the other hand, the Swiss franc is showing signs of weakness, as the SNB remains one of the most dovish central banks in the G10 space, with real interest rates still negative and inflation pressures easing significantly.
Technically, we’re in a bullish structure with key demand holding strong at the 0.4840–0.4860 range. Price is now coiling just under resistance, and a clean breakout above the 0.4950 level could ignite the next impulsive leg toward 0.5100. If the breakout confirms with increased volume and market sentiment aligns, this setup presents a high probability long opportunity with a favorable R\:R.
NZDCHF remains on my radar as a breakout trade backed by both technical structure and macro fundamentals. With capital flows favoring the Kiwi and risk appetite rotating back into higher-yielding currencies, this pair offers a solid bullish continuation setup for the coming weeks. Stay patient, let the breakout confirm, and ride the momentum higher.

NZDCAD The Target Is UP! BUY!
My dear followers,
This is my opinion on the NZDCAD next move:
The asset is approaching an important pivot point 0.8191
Bias - Bullish
Technical Indicators: Supper Trend generates a clear long signal while Pivot Point HL is currently determining the overall Bullish trend of the market.
Goal - 0.8219
About Used Indicators:
For more efficient signals, super-trend is used in combination with other indicators like Pivot Points.
Disclosure: I am part of Trade Nation's Influencer program and receive a monthly fee for using their TradingView charts in my analysis.
———————————
WISH YOU ALL LUCK

NZDCAD Is Bearish! Sell!
Take a look at our analysis for NZDCAD.
Time Frame: 10h
Current Trend: Bearish
Sentiment: Overbought (based on 7-period RSI)
Forecast: Bearish
The market is testing a major horizontal structure 0.824.
Taking into consideration the structure & trend analysis, I believe that the market will reach 0.817 level soon.
P.S
We determine oversold/overbought condition with RSI indicator.
When it drops below 30 - the market is considered to be oversold.
When it bounces above 70 - the market is considered to be overbought.
Disclosure: I am part of Trade Nation's Influencer program and receive a monthly fee for using their TradingView charts in my analysis.
Like and subscribe and comment my ideas if you enjoy them!

NZD_CAD LONG SIGNAL|
✅NZD_CAD is going down to
Retest a horizontal support of 0.8160
Which makes me locally bullish biased
And I think that we will see a rebound
And a move up from the level
So we can go long wit the
TP of 0.8206 and the SL of 0.8152
LONG🚀
✅Like and subscribe to never miss a new idea!✅
Disclosure: I am part of Trade Nation's Influencer program and receive a monthly fee for using their TradingView charts in my analysis.

NZD/CAD BUYERS WILL DOMINATE THE MARKET|LONG
Hello, Friends!
NZD-CAD downtrend evident from the last 1W red candle makes longs trades more risky, but the current set-up targeting 0.827 area still presents a good opportunity for us to buy the pair because the support line is nearby and the BB lower band is close which indicates the oversold state of the NZD/CAD pair.
Disclosure: I am part of Trade Nation's Influencer program and receive a monthly fee for using their TradingView charts in my analysis.
✅LIKE AND COMMENT MY IDEAS✅

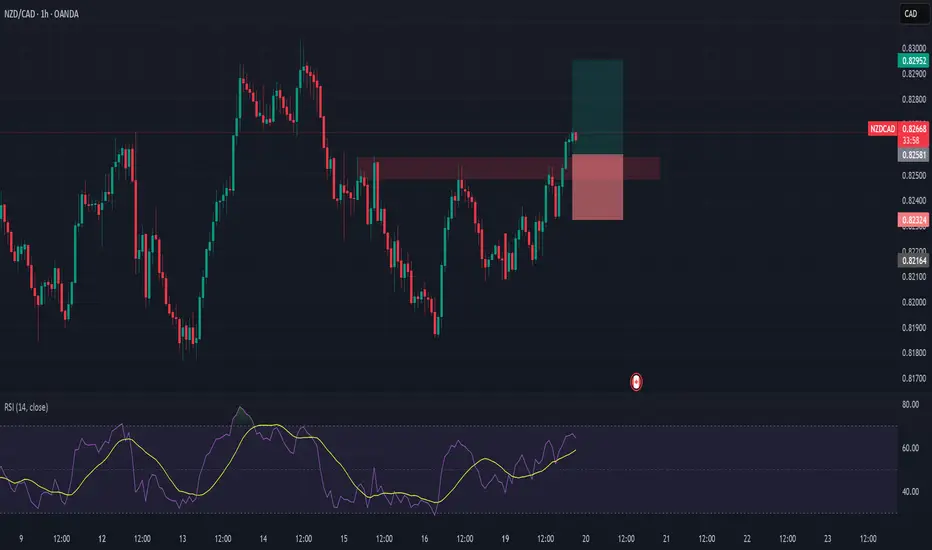
NZDCAD Long – Breakout + Retest Opportunity Backed by Macros🔹 Pair: NZD/CAD
🔹 Timeframe: 1H
🔹 Direction: Long
🔹 Status: Breakout of resistance → waiting for retest at turncoat support
🔹 Entry Zone (Planned): 0.8250–0.8260
NZD is the top gainer this week with strong conditional momentum and seasonal strength. CAD is stagnating under weak macro support. We're now watching for a pullback to the breakout zone for an ideal long entry.
Will look to enter between 0.8250–0.8260, SL under 0.8230, and aiming for 0.8295+.
📊 Macro & Fundamental Confluence
🇳🇿 NZD – Bullish
Biggest Weekly Gainer: Conditional score surged 🚀 from 8 → 13
Seasonal Bias: Strong buy signal from mid-May onward
Central Bank: RBNZ remains hawkish amid stable inflation targets
Risk-On Regime: VIX < 20 favors high-beta currencies like NZD
🇨🇦 CAD – Bearish
Policy vs Data Mismatch: BoC hawkish, but weak retail & CPI data
Global Headwinds: Commodity weakness and trade risks weigh on CAD
🧩 Confluences
✅ NZD macro & conditional strength
✅ CAD stagnation
✅ Risk-on favors NZD
✅ Technical breakout + higher high confirmed
NZD/CAD SHORT FROM RESISTANCE
Hello, Friends!
We are going short on the NZD/CAD with the target of 0.818 level, because the pair is overbought and will soon hit the resistance line above. We deduced the overbought condition from the price being near to the upper BB band. However, we should use low risk here because the 1W TF is green and gives us a counter-signal.
Disclosure: I am part of Trade Nation's Influencer program and receive a monthly fee for using their TradingView charts in my analysis.
✅LIKE AND COMMENT MY IDEAS✅

NZDCAD - Short Term Sell Trade Update!!!Hi Traders, on May 7th I shared this idea "NZDCAD - Looking To Sell Pullbacks In The Short Term"
I expected to see retraces and further continuation lower. You can read the full post using the link above.
Retrace and push lower happened as per the plan!!!
If you enjoy this idea, don’t forget to LIKE 👍, FOLLOW ✅, SHARE 🙌, and COMMENT ✍! Drop your thoughts and charts below to keep the discussion going. Your support helps keep this content free and reach more people! 🚀
-------------------------------------------------------------------------------------------------------------------
Disclosure: I am part of Trade Nation's Influencer program and receive a monthly fee for using their TradingView charts in my analysis.

NZDCAD: Last Idea Running 300+ Pips, Next Big Opportunity OTW! Dear Traders,
Our last idea hit 340+ pips successfully, and we expect price to continue rising up, after touching our imbalance zone. That area remain a strong possible buying area for buyers. Once rejected at the area we can see strong rebound from our buying zone. 400-500 pips move is expected.
Good Luck and Trade Safe
**If you like our idea then please do like, comment and follow for more**

NZDCAD - Looking To Sell Pullbacks In The Short TermM15 - Bearish divergence followed by the most recent uptrend line breakout.
No opposite signs.
Currently it looks like a pullback is happening.
Expecting bearish continuation until the strong resistance zone holds.
If you enjoy this idea, don’t forget to LIKE 👍, FOLLOW ✅, SHARE 🙌, and COMMENT ✍! Drop your thoughts and charts below to keep the discussion going. Your support helps keep this content free and reach more people! 🚀
--------------------------------------------------------------------------------------------------------------------
Disclosure: I am part of Trade Nation's Influencer program and receive a monthly fee for using their TradingView charts in my analysis.

NZDCAD Will Go Lower! Short!
Here is our detailed technical review for NZDCAD.
Time Frame: 6h
Current Trend: Bearish
Sentiment: Overbought (based on 7-period RSI)
Forecast: Bearish
The market is trading around a solid horizontal structure 0.825.
The above observations make me that the market will inevitably achieve 0.816 level.
P.S
Please, note that an oversold/overbought condition can last for a long time, and therefore being oversold/overbought doesn't mean a price rally will come soon, or at all.
Disclosure: I am part of Trade Nation's Influencer program and receive a monthly fee for using their TradingView charts in my analysis.
Like and subscribe and comment my ideas if you enjoy them!

NZDCAD: Bearish Continuation is Expected! Here is Why:
The recent price action on the NZDCAD pair was keeping me on the fence, however, my bias is slowly but surely changing into the bearish one and I think we will see the price go down.
Disclosure: I am part of Trade Nation's Influencer program and receive a monthly fee for using their TradingView charts in my analysis.
❤️ Please, support our work with like & comment! ❤️

NZDCAD Sell to 0.816?There is a potential sell on the 4 hour chart.
I expect NZD CAD to start declining to at least 0.817
Stop loss: 0.8273
TP : Around 0.817
