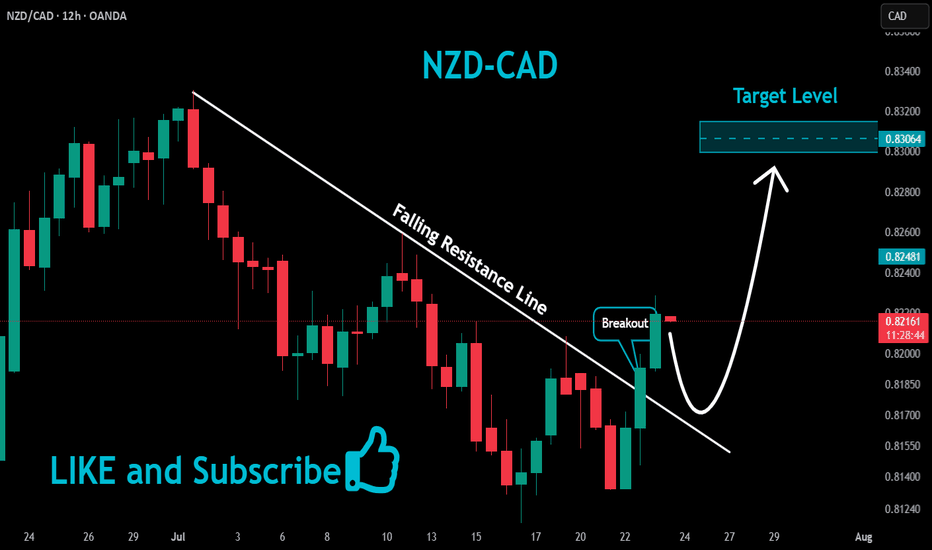
NZDCADANALYSIS
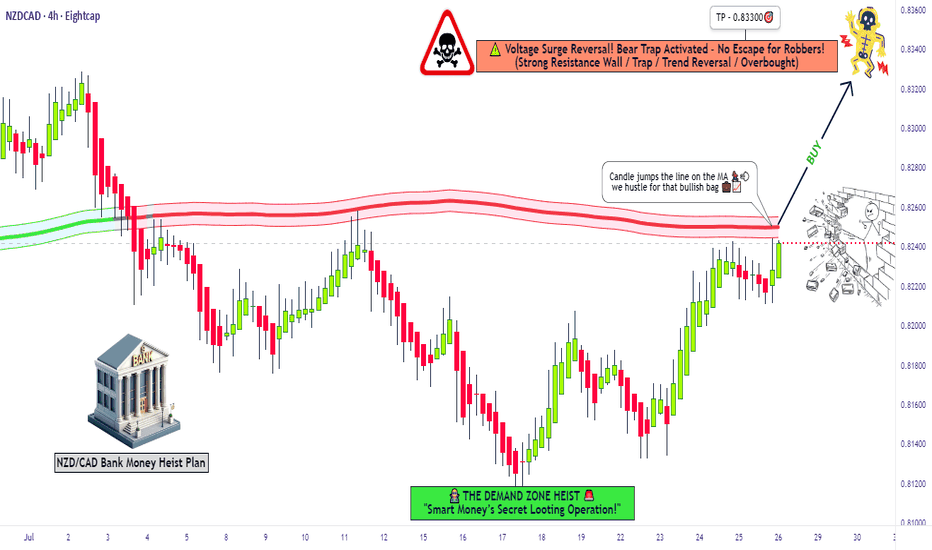
"NZD/CAD Reversal Play – Ride the Bullish Wave!🦹♂️💰 "THE KIWI-LOONIE HEIST: High-Voltage Forex Robbery Plan (NZD/CAD)" 💰🦹♂️
🌍 Attention all Market Pirates, Thieves & Profit Bandits! 🌍
🔥 Thief Trading Alert – NZD/CAD Bullish Heist Setup! 🔥
The "Kiwi vs Loonie" is setting up for a high-risk, high-reward robbery—and we’re locking in the master plan. Long entry is the play, but this ain’t for the weak hands. Overbought? Consolidation? Reversal trap? Perfect. That’s where we strike.
🎯 THE HEIST BLUEPRINT
🔑 ENTRY ZONE (Breakout & Retest Strategy)
"Wait for the 4H candle to CLOSE ABOVE 0.82600 (MA Breakout + Retest)."
Option 1: Place a BUY STOP above the MA (momentum confirmation).
Option 2: BUY LIMIT near recent swing lows (15M/30M precision).
🚨 Set an ALERT! Don’t miss the breakout—timing is everything.
🛑 STOP LOSS (Escape Route)
SL at 0.82000 (near swing low wick on 4H).
⚠️ Golden Rule: NO ORDERS BEFORE BREAKOUT! Wait for confirmation.
Adjust SL based on your risk, lot size, and multi-order strategy.
🎯 TARGETS (Profit Escape Plan)
Take Profit 1: 0.83300 (First resistance).
Or… Exit Early if the market turns shaky.
Scalpers: Long-only scalp plays! Use trailing SL to lock in gains.
⚡ THIEF TRADER PRO TIPS
✅ Fundamental Backing: Check COT reports, macro trends, intermarket signals.
✅ News Alert: Avoid new trades during high-impact news—protect open positions with trailing stops.
✅ Risk Management: Small lots, multiple entries = smarter heist.
💥 BOOST THE HEIST! (Let’s Get Rich Together) 💥
👉 Smash that 👍 LIKE button to fuel our next robbery plan!
👉 Follow for daily high-voltage setups.
👉 Comment "🚀" if you’re joining the heist!
🤑 NEXT HEIST COMING SOON… STAY TUNED, BANDITS! 🤑
🔥 WHY THIS TRADE? (Thief’s Edge)
Bullish momentum but trapped bears = perfect robbery setup.
Institutional levels + retail traps = our opportunity.
Not financial advice—just a well-planned theft. 😉
⚠️ Warning: Trading = Risk. Only play with funds you can afford to lose.
NZD/CAD THIEF TRADING ALERT: Bullish Loot Ahead – Are You In?🔥 NZD/CAD Heist: Bullish Loot Ahead! 🏴☠️💰
🌟 Greetings, Market Pirates! 🌟
Hola! Oi! Bonjour! Hallo! Marhaba! 🚀
💸 The Master Plan:
Based on Thief Trading tactics (technical + fundamental analysis), we’re plotting a bullish heist on NZD/CAD ("Kiwi vs Loonie"). The vault is open—time to swipe the loot!
📈 Entry (Long Only):
Buy Limit Orders preferred (15-30min TF for pullbacks).
Aggressive? Enter anytime—just stick to the strategy!
🛑 Stop Loss (Protect Your Loot!):
Nearest swing low (4H TF) → 0.81500 (adjust based on risk & lot size).
Scalpers? Use trailing SL to lock profits!
🎯 Take Profit (Escape Before Cops Arrive!):
Primary Target: 0.83800 (or exit earlier if momentum fades).
⚠️ Warning (High Risk!):
Overbought? Yes. Bear traps? Likely.
Consolidation zone → trend reversal risk!
News releases? Avoid new trades—hedge or trail stops!
📊 Market Context:
Neutral trend (bullish bias forming 🐂).
Check: COT reports, macro trends, sentiment & intermarket signals BEFORE executing! 🔍 (go ahead to read 🔗🌏).
💥 Boost This Idea!
Hit 👍 LIKE & 🔔 FOLLOW to support the Thief Trading crew! More heists coming soon—stay tuned! 🚀
🚨 Reminder: Trade responsibly. This is NOT financial advice—just a risky, high-reward play. Manage your risk or get rekt!
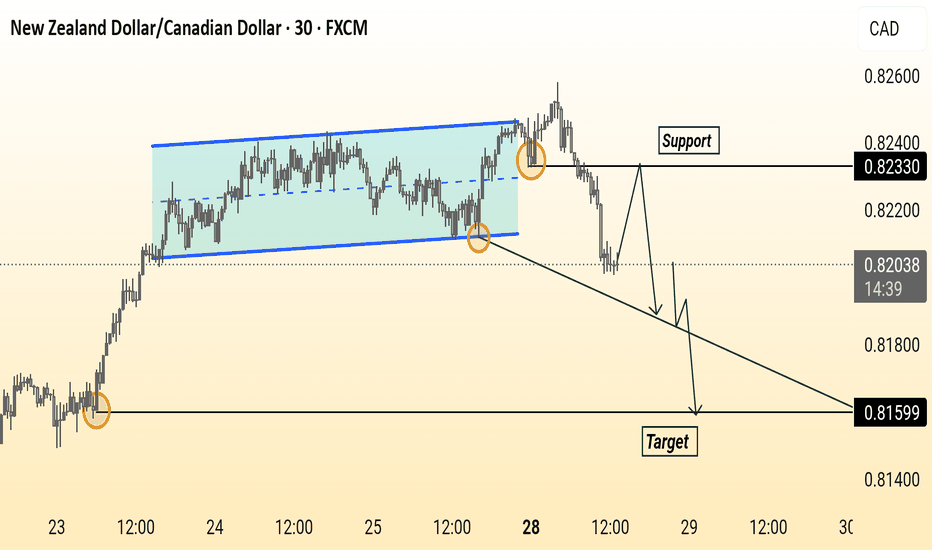
NZDCAD Selling Trading IdeaHello Traders
In This Chart nzdcad HOURLY Forex Forecast By FOREX PLANET
today NZDCAD analysis 👆
🟢This Chart includes_ (NZDCAD market update)
🟢What is The Next Opportunity on NZDCAD Market
🟢how to Enter to the Valid Entry With Assurance Profit
This CHART is For Trader's that Want to Improve Their Technical Analysis Skills and Their Trading By Understanding How To Analyze The Market Using Multiple Timeframes and Understanding The Bigger Picture on the Charts
NZDCAD - Looking To Sell Pullbacks In The Short TermM15 - Bearish divergence followed by the most recent uptrend line breakout.
No opposite signs.
Expecting pullbacks and bearish continuation until the strong resistance zone holds.
If you enjoy this idea, don’t forget to LIKE 👍, FOLLOW ✅, SHARE 🙌, and COMMENT ✍! Drop your thoughts and charts below to keep the discussion going. Your support helps keep this content free and reach more people! 🚀
--------------------------------------------------------------------------------------------------------------------
BANK JOB: NZD/CAD LOOT GRAB (Swing Heist Plan) 🏦 "Market Heist: NZD/CAD Long Before Trap Closes! 💰
🦹♂️ Attention All Market Thieves!
(Hola! Oi! Salut! Hallo! Ahlan!) 🎭💸
🔥 Thief Trading Intel Confirmed!
The NZD/CAD "Kiwi vs Loonie" vault is primed for cracking! Our bullish heist blueprint targets the red zone - but we escape before the bears set their trap!
🔓 ENTRY: CRACKING THE SAFE
"Resistance wall at 0.83150 is the vault door!"
✔ Option 1: Buy Stop above resistance (breakout play)
✔ Option 2: Buy Limit at swing low (15m/30m pullback)
🔔 Pro Tip: Set breakout alerts - don't miss the heist!
🚨 STOP LOSS: POLICE EVASION PLAN
📍 Thief SL: 0.82200 (below 4H swing low & MA)
⚠️ Warning: No SL before breakout! You'll trigger the alarms!
💎 TARGET: ESCAPE WITH THE LOOT
🎯 Primary Take: 0.84400
💰 Scalpers: Long-only! Trail your SL like a getaway car!
📊 MARKET CONDITIONS
🐂 Bullish Trend (but overbought - time it right!)
🔍 Key Intel Needed: COT reports, macro data, sentiment
🌐 Full Briefing: Check bi0 linkss 👉🔗
🚦 RISK MANAGEMENT PROTOCOLS
• ❌ Avoid news event heists
• 🔒 Always use trailing stops
• 💣 Position size = explosive potential
🦾 SUPPORT THE SYNDICATE
💥 SMASH THAT BOOST BUTTON!
💬 Comment your heist results below!
🔔 Next job coming soon - stay tuned!
🤑 Remember thieves: Book profits before the cops arrive!
Is the NZDCAD uptrend still strong?NZDCAD has broken the trendline structure and is heading towards the resistance at 0.83500
0.827 has become a confluence of support and trendline. The pair is looking for more buying momentum at the support zone.
2 zones to watch are 0.827 and 0.823
If the 0.823 zone is broken, the uptrend is broken and the market turns to a downtrend. The target of the downtrend and the market finds the bottom of last month around 0.812.
Confirm SELL signal when breaking 0.823
NZDCAD Selling Trading IdeaHello Traders
In This Chart nzdcad HOURLY Forex Forecast By FOREX PLANET
today NZDCAD analysis 👆
🟢This Chart includes_ (NZDCAD market update)
🟢What is The Next Opportunity on NZDCAD Market
🟢how to Enter to the Valid Entry With Assurance Profit
This CHART is For Trader's that Want to Improve Their Technical Analysis Skills and Their Trading By Understanding How To Analyze The Market Using Multiple Timeframes and Understanding The Bigger Picture on the Charts
NZDCAD - Short Term Sell Trade Update!!!Hi Traders, on May 7th I shared this idea "NZDCAD - Looking To Sell Pullbacks In The Short Term"
I expected to see retraces and further continuation lower. You can read the full post using the link above.
Retrace and push lower happened as per the plan!!!
If you enjoy this idea, don’t forget to LIKE 👍, FOLLOW ✅, SHARE 🙌, and COMMENT ✍! Drop your thoughts and charts below to keep the discussion going. Your support helps keep this content free and reach more people! 🚀
-------------------------------------------------------------------------------------------------------------------
Disclosure: I am part of Trade Nation's Influencer program and receive a monthly fee for using their TradingView charts in my analysis.
NZDCAD: Last Idea Running 300+ Pips, Next Big Opportunity OTW! Dear Traders,
Our last idea hit 340+ pips successfully, and we expect price to continue rising up, after touching our imbalance zone. That area remain a strong possible buying area for buyers. Once rejected at the area we can see strong rebound from our buying zone. 400-500 pips move is expected.
Good Luck and Trade Safe
**If you like our idea then please do like, comment and follow for more**
NZDCAD - Looking To Sell Pullbacks In The Short TermM15 - Bearish divergence followed by the most recent uptrend line breakout.
No opposite signs.
Currently it looks like a pullback is happening.
Expecting bearish continuation until the strong resistance zone holds.
If you enjoy this idea, don’t forget to LIKE 👍, FOLLOW ✅, SHARE 🙌, and COMMENT ✍! Drop your thoughts and charts below to keep the discussion going. Your support helps keep this content free and reach more people! 🚀
--------------------------------------------------------------------------------------------------------------------
Disclosure: I am part of Trade Nation's Influencer program and receive a monthly fee for using their TradingView charts in my analysis.
Short-Term Trade Setup: NZDCAD Eyes 0.82898–0.83110 TargetsGood day Traders,
Trust you are well.
Below is my analysis of NZDCAD.
Overview:
NZDCAD is retracing from the recent high at 0.83050, currently trading around 0.82628. Price action is approaching a key support zone between 0.82470 – 0.82285, an area that previously triggered bullish reactions. Momentum indicators are showing bearish pressure, with red histogram bars visible on the chart.
Idea:
Although bearish momentum is present, the histogram shows a slight decrease in selling pressure, hinting at a potential slowdown in the current downtrend. If the pair holds above the 0.82287 level, it could signal a potential reversal or bounce. This would open room for bullish targets at: 0.82898, 0.83039 and 0.83110.
However, a confirmed break below 0.82287 could expose the next support around 0.82100.
Conclusion:
The pair is at a critical support zone, with decreasing momentum suggesting that sellers may be losing strength. A bounce from current levels could provide a short-term buying opportunity, while a break below 0.82287 would invalidate the bullish outlook.
Cheers and happy trading!
#NZDCAD: Two Areas To Sell From! Swing SellThe NZDCAD has hit a critical level, and it might start going down from where we set our selling points. We also have two targets for when we should enter the market.
Good luck and trade safely!
Thanks for your support! 😊
If you want to help us out, here are a few things you can do:
- Like our ideas
- Comment on our ideas
- Share our ideas
Team Setupsfx_
❤️
#NZDCAD: Great Time To Swing Sell! Comment Your View! NZDCAD is at a critical selling level, and we expect a significant drop. The chart shows potential price reversals, either continuing in our direction or rising to the red circle before reversing. A risk-managed trade could benefit from this.
Good luck and trade safely!
Much Love ❤️
Team Setupsfx_
NZDCAD is in the Selling Direction after Breaking SupportHello Traders
In This Chart nzdcad HOURLY Forex Forecast By FOREX PLANET
today NZDCAD analysis 👆
🟢This Chart includes_ (NZDCAD market update)
🟢What is The Next Opportunity on NZDCAD Market
🟢how to Enter to the Valid Entry With Assurance Profit
This CHART is For Trader's that Want to Improve Their Technical Analysis Skills and Their Trading By Understanding How To Analyze The Market Using Multiple Timeframes and Understanding The Bigger Picture on the Charts
NZDCAD - Looking for bearish continuationMy chart describes exactly what I am seeing.
My own bias is to the downside.
This is not a trade recommendation, merely my own analysis. Trading carries a high level of risk, so only trade with money you can afford to lose and carefully manage your capital and risk. If you like my idea, please give a “boost” and follow me to get even more. Please comment and share your thoughts too!!
It’s not whether you are right or wrong, but how much money you make when you are right and how much you lose when you are wrong – George Soros


