NZDCAD Idea H1Here is my view for NZDCAD on H1. The price could go up, you can put a pending order on the Order block or find an entry on LTF within OB Zone. Trade Safe!
NZDCADANALYSIS

NZDCAD - Long from bullish orderblock ✅Hello traders!
‼️ This is my analysis on NZDCAD .
Here we are bullish from H4 timeframe perspective, so I am looking for longs. I expect price to retrace a little bit to fill the imbalance below and then to reject from bullish orderblock.
Like, comment and subscribe to be in touch with my content!

NZDCADPrice gave us an impulse to the upside and has Brocken our supply level, we expect price to continue bullish after accumulation

NZDCAD - Sell-off continuation ✅Hello traders!
‼️ This is my analysis on NZDCAD .
Here we are in a bearish market structure, so I am looking only for shorts. We can see that price started the sell-off, I will look for a short if price retraces a little bit.
Like, comment and subscribe to be in touch with my content!

NZDCAD SELL IDEAHello Traders!!!!
NZDCAD has been on a really long term downtrend for some weeks now and we have remained bearish with our overall bias and of recent we have not seen a change in direction yet.
So that being said we spotted a Supply zone from which price should fall from to create a lower low in suppport of our overall trend which I just marked up.
Happy New Trading Week!!
Cheers!!!
Under Cover Trading
Swing Trading Simplified!!

NZDCAD Breakout Long!NZD-CAD broke a falling Resistance
lines which make me think
That after the pullback and reteste
of the broken falling resistance
The price will go up !

NZD/CAD Multi-Timeframe & Order Flow Analysis Hello Traders, here is the full analysis for this pair, let me know in the comment section below if you have any questions, the entry will be taken only if all rules of the strategies will be satisfied. I suggest you keep this pair on your watchlist and see if the rules of your strategy are satisfied. Please also refer to the Important Risk Notice linked below.

NZDCAD Next Possible MoveTechnical Analysis Chart Update
NZD / CAD ( New Zealand Dollar / Canadian Dollar )
Time Frame - H2
BEARISH CHANNEL in Long Time Frame #LTF
If Reject from the Upper Trend Line #UTL then Sell
BULLISH CHANNEL in Short Time Frame #STF
If Rejects from the Upper Trend Line #UTL then Sell
Impulse Correction Impulse - If rejects the Fibonacci Level - 78.60% then Sell otherwise Buy after Retest

NZDCAD H1 GARTLEY PATTERNHi traders, NZDCAD is setting up for a downside move i am expecting from price to come around our mentioned area and looking price action on our mentioned area for a downside move. The area that i mentioned in chart is a very intresting level because it is a 78 fib retracement level and also a gartley pattern completion level and the upper trendline third touch. I am waiting for price to come around our mentioned area and looking for a short position opportunity remember price can also drop from the current area in this case our setup will be invalidate GOOD LUCK.

NZDCAD - Short from resistance ✅Hello traders!
⁉️This is my analysis on NZDCAD .
Here we are in a bearish market structure, so I am looking only for shorts. I expect price to continue the retracement to fill the imbalance above and then to reject from resistance.
Like, comment and subscribe to be in touch with my content!

NZDCAD : Lower Support Near 0.7600 Could Push Price Up AgainNZDCAD : Lower Support Near 0.7600 Could Push Price Up Again
Since February 21, the price is in a clear downtrend.
What's really interesting is that the lower support line is
pushing the price up whenever it's there.
We may see the price rise again this time as well.
A breakout of the minor wedge will push it higher
creating a new trend in the price direction
Thank you and Good Luck!

NZD/CAD :: Long is not the right position. For now ...NZD/CAD :::
it is rising in the green channel and its ceiling is in the range of strong resistance. And there is a possibility that the price will continue its movement after hitting the ceiling of the green channel towards the red lines that push the support range .

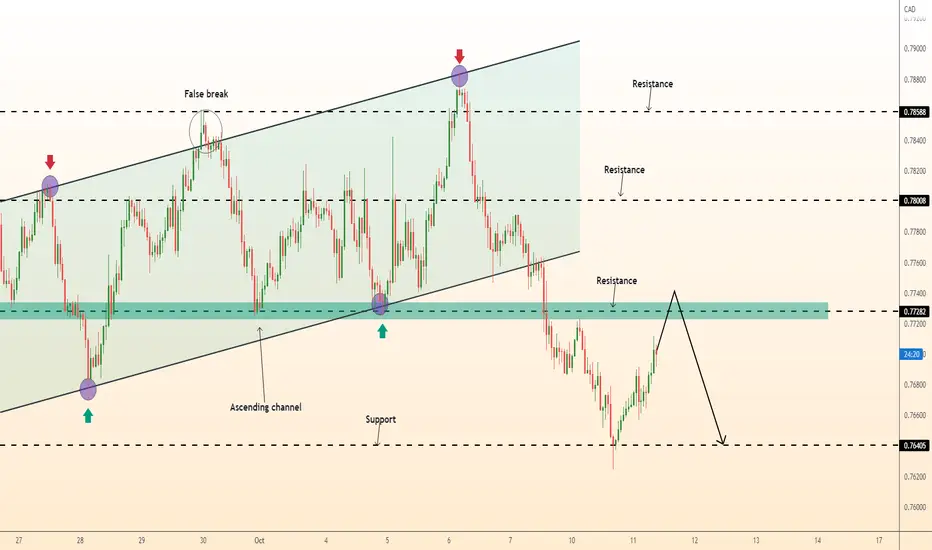
DeGRAM | NZDCAD bearish opportunityNZDCAD moved out of the ascending channel, and it made lower lows.
The market broke and closed below the support level, which became a resistance that was respected before.
The market is heavily bearish on the higher timeframes.
If the resistance level rejects the price, then we can look for selling opportunities.
-------------------
Share your opinion in the comments and support the idea with like. Thanks for your support!
NZDCAD - Short from bearish orderblock ✅Hello traders!
⁉️This is my analysis on NZDCAD .
Here we are in a strong bearish market structure, I expect price to take out sell side liquidity and then to retrace and reject from bearish orderblock + institutional mid figure 0.78500.
Like, comment and subscribe to be in touch with my content!

🌟BUY NZDCAD; it's time to buy 🔥❗🔰You can see the analysis of the New Zealand dollar to Canadian dollar currency pair in the 30-minute time frame (NZDCAD_ 30min) 🔍🧨
💥The price is moving in a Bullish parallel channel💜 If the price can break the Down trend line🖤 and then pullback❗ to the area where the intersection of the DEMAND zone and the bottom line of the Bullish parallel channel💜 (dynamic support) and the support caused by the broken Down trend line🖤, it can experience an upward🔺 trend until Resistance🧡🚀
Do you think this analysis can be profitable❓
I hope the analysis was useful for you🤍🌹
📌Please introduce the channel to your friends 🙏🏻
______📈TRADER STREET📉______

NZD/CAD Full Analysis ,When Can Buy,Rules For That In This VideoThis Is An Educational + Analytic Content That Will Teach Why And How To Enter A Trade
Make Sure You Watch The Price Action Closely In Each Analysis As This Is A Very Important Part Of Our Method
Disclaimer : This Analysis Can Change At Anytime Without Notice And It Is Only For The Purpose Of Assisting Traders To Make Independent Investments Decisions.

NZDCAD and AUDCAD top-down analysisHello traders, this is a complete multiple timeframe analysis of this pair. We see could find a significant trading opportunities as per analysis upon price action confirmation we may take this trade. Smash the like button if you find value in this analysis and drop a comment if you have any questions or let me know which pair to cover in my next analysis.

NZD/CAD Fully Closed +450 Pips 0Drawdown , New Entry Added This Is An Educational + Analytic Content That Will Teach Why And How To Enter A Trade
Make Sure You Watch The Price Action Closely In Each Analysis As This Is A Very Important Part Of Our Method
Disclaimer : This Analysis Can Change At Anytime Without Notice And It Is Only For The Purpose Of Assisting Traders To Make Independent Investments Decisions.

DeGRAM | NZDCAD bearish opportunityNZDCAD is making lower lows. The trend is bearish on higher timeframes.
Price action broke and closed below the support level, which became a resistance at 0.7800.
If price pulls back to the level and makes a false break, then we can look for sell opportunities.
-------------------
Share your opinion in the comments and support the idea with like. Thanks for your support!

NZDCAD LongThe price is following a falling flag/ channel according to higher timeframes (Weekly), it has reached the lowest trendline of the channel. It has broken out thus forming a bear trap.
According to the lower timeframe (1H, 15 minutes), an ascending triangle is formed which might be a big indicator of a bullish trend.
Let us wait for the price to break out of the resistance zone formed and now look at the long term strategy of the price.
Entry @ 0.787 Target @ 0.796, SL @ 0.784
R:R 1 : 3
Remember, risk 1 - 2 % of the account.

DeGRAM | NZDCAD bullish opportunityNZDCAD is consolidating at a support level .
Price action is moving in a descending channel and it double bottomed.
The market shows a divergence, which means we might see a retest the resistance level.
We expect bullish move.
-------------------
Share your opinion in the comments and support the idea with like. Thanks for your support!

NZD/CAD Playing Well Below Our Support , Short Setup Valid ?This Is An Educational + Analytic Content That Will Teach Why And How To Enter A Trade
Make Sure You Watch The Price Action Closely In Each Analysis As This Is A Very Important Part Of Our Method
Disclaimer : This Analysis Can Change At Anytime Without Notice And It Is Only For The Purpose Of Assisting Traders To Make Independent Investments Decisions.

AUDCAD and NZDCAD top-down analysisHello traders, this is the full breakdown of this pair. We will take this trade if all the conditions are satisfied as discussed in the analysis. Smash the like button if you find value in this analysis and drop a comment if you have any questions or let me know which pair to cover in my next analysis.
Press like button if you enjoy this content 😊
