NZDCADANALYSIS


NZDCAD uptrend setupprice direction: UPTREND
potential target price: 0.9107
**Disclaimer** the content on this analysis is subject to change at any time without notice and is provided for the sole purpose of assisting traders to make independent investment decisions.
Traders!! if you like my ideas and do take the same trade as I do, please write it in a comment so we can manage the trade together.
_____________________________________________________________________________________________________________________
Thank you for your support ;)
GWBFX

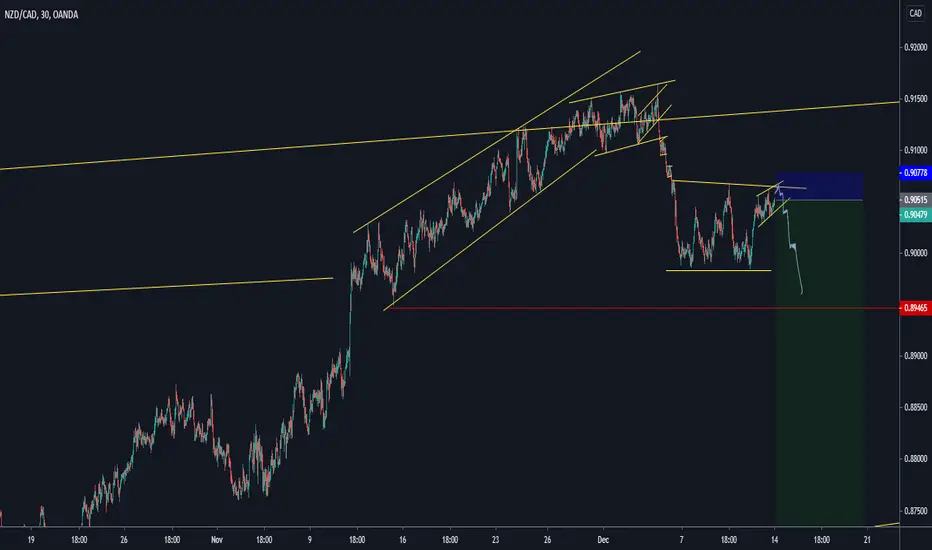
NZDCAD – Bearish continuation pattern to confirm the bearish marAs per my analysis before,.. If you follow my analysis from the beginning, maybe you know I’m a long term bear on all this NZD pairs... So Far, this still looking good. NZDCAD has make its 1st impulsive move to the downside lat week. After that,.. I see a decrease in the momentum and i exitmy position at the bottom. After that this pairs continue to move sideways in range.
Now, I’m starting to see the bigger continuation pattern that this pair form,.. The best part is,.. this structure is almost complete and I’m expecting we’re seeing the continuation of the previous bearish move soon. I’m expecting this move to be bigger than before and will be a massive one.
As for the entry trigger,.. we will access in on the way but of course, the higher probability trade is to enter after the break of any continuation pattern..
Lets see how will this pair develop,.. Good Luck
__________________________________________________________________________________________________________________________________________________________________
Here is the MOA FX technical analysis, please comment below if you have any question.
The ENTRY in the market will be taken only if the condition of the MOA Fx strategy will trigger.
Follow me on my other channel and don’t miss any updates:
__________________________________________________________________________________________________________________________________________________________________
NZDCAD Potential Momentum Shift NZDCAD has failed to break and retest above 0.90400. The recent H4 candle has broken an area of support and we can see a potential retracement towards the previously broken support or 0.90400 to give a deeper retracement towards the 0.89000 zone. This market still has the potential to continue bullish momentum and reach 0.90600 as well.


NZDCAD W2 DEC 2020 NZDCAD
Short Setup
Rising wedge pattern, weekly formed a bearish engulf. A little to no retracement will be expected.
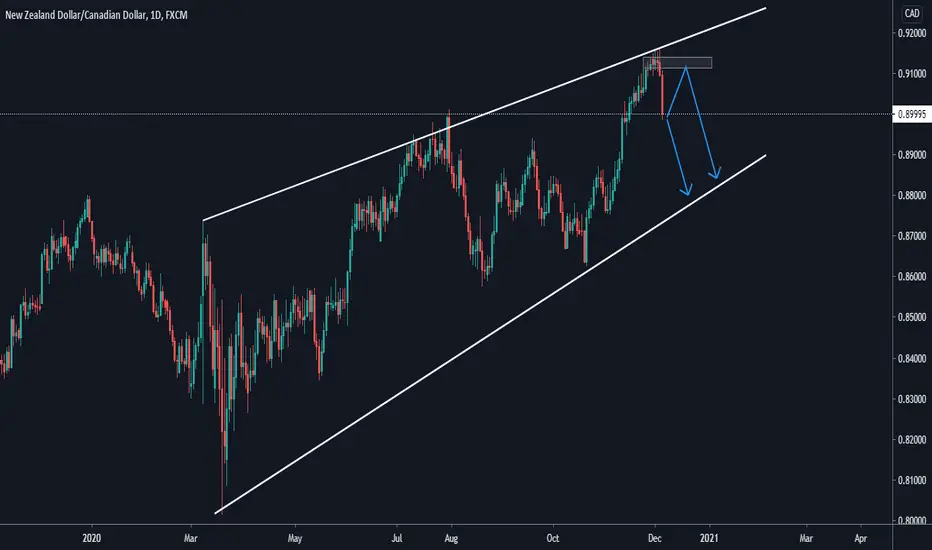
NZDCAD - Big short sell opportunity finally readyLike my forecast before, I’m still waiting for a short opportunity on NZDCAD. After waiting for a several weeks, the short opportunity haven’t present it self to us. Now,.. Looks like it finally ready.
NZDCAD is on the top area of HTF structure while forming an ascending channel while approaching this area. Now, the price has broken back below the ascending channel. In addition, it’s now breaking a small H1 bearish continuation flag to confirm this move to the downside.
I’m taking a short entry here, with SL above the flag, and target up to 0.86000 with so much more potential to be seen later.
Lets see how will this pair play out,.. Good Luck
__________________________________________________________________________________________________________________________________________________________________
Here is the MOA FX technical analysis, please comment below if you have any question.
The ENTRY in the market will be taken only if the condition of the MOA Fx strategy will trigger.
__________________________________________________________________________________________________________________________________________________________________

NZDCAD Top-Down AnalysisHello Traders,
Here is the Top-Down Analysis of NZDCAD (Monthly, Weekly, Daily for direction and 4H for entry) for
Week 49 - Dec 02
M > Market was moving in a downward channel, however price has broken channel to the upside and now testing monthly supply zone.
W > Price has formed two over extended W formations and can see loss of momentum and also bearish divergence. We expect drop in price however in its current bullish move it can continue to rise to test weekly resistance.
D > Market is in overbought state however no sign of reversal can be seen currently. In massive bullish move we must see a reversal on daily chart for a confirmed sign.
As per COT NZD further added both Long and Short bringing Long to the highest for the year, ZXY has gained strength all of November, it is now testing a major resistance level. We can expect some correction to the downside for NZD. CAD added both Long and Short positions, improving net positions though still in -ve. N-R also added both Long and Short greatly improving cumulative net positions, in +ve. CXY strengthened last week and is testing monthly resistance. We can expect correction to the downside this week.
4H > Price tested supply zone last week and after rejection has returned back to test same zone again. We can see bearish divergence but must see formation of LL for bearish reversal.
Pair Correlation > NZDCAD has positive correlation with NZDCHF, NZDUSD, NZDJPY, GBPCHF and GBPCAD and negative correlation with EURNZD and GBPNZD.
This was my Idea and I hope you find it useful. If you find the analysis of help please leave a LIKE and FOLLOW for receiving all updates during the week. In the comment section share your view or ask questions.
Thank You
AP17FX


NZDCAD short trade ideaPlan: trendline and support level breakout --> wait for the price to bounce off from resistance level --> wait for the rejection candle pattern to form e.g. bearish engulfing, pinbar, etc --> SELL
**Disclaimer** the content on this analysis is subject to change at any time without notice, and is provided for the sole purpose of assisting traders to make independent investment decisions.
Traders!! if you like my ideas and do take the same trade as I do, please write it in a comment so we can manage the trade together.
_____________________________________________________________________________________________________________________
Thank you for your support ;)
GWBFX

NZDCAD BUYThis is NZDCAD 15 minutes timeframe analysis, i'm expecting this pair to go up for 50 PIPs as my final TP.

NZDCAD Overbought ConditionsNZDCAD has been in an overbought market condition but it still managing to create HH's and HL's. Shorts will only be valid once we get a daily close below support and if the most recent HL is broken. Once there's a structure shift, I'm going to wait for a pullback before placing shorts. A break above current HH will invalidate potential short setup.

NZDCAD Top-Down AnalysisHello Traders,
Here is the Top-Down Analysis of NZDCAD (Monthly, Weekly, Daily for direction and 4H for entry) for
Week 48 - Nov 23
M > Market was moving in a downward channel, however price has broken channel to the upside and now testing monthly supply zone.
W > Price has formed two over extended W formations and can see loss of momentum and also bearish divergence. We can expect drop in price.
D > In bullish impulse we can see bearish candles at two key levels that will now act as demand zones. Market is in oversold zone and can expect a drop soon.
As per COT NZD further added both Long and Short improving net positions to max for the year, ZXY has been gaining strength for past 3 weeks, it is now testing a major resistance level. CAD further added Long but closed few Short positions. CXY lost its gained strength during the said period.
CAD currently has balanced Long and Short open positions and NZD has +ve net position. Hence in current situation we do not see any reason of price turning bearish unless either NZD weakens or CAD strengthens, which can be monitored closely with other NZD and CAD pairs.
4H > Price is moving in a bearish flag and a breakout to the downside can be expected.
Pair Correlation > NZDCAD has positive correlation with NZDCHF, NZDUSD and NZDJPY and negative correlation with EURNZD.
This was my Idea and I hope you find it useful. If you find the analysis of help please leave a LIKE and FOLLOW for receiving all updates during the week. In the comment section share your view or ask questions.
Thank You
AP17FX

NZDCAD: BEARISH Retracement Occurring...38.2 FIb Level!!We managed to see a BEARISH engulfing candle today which may signal to us that the movement above 1.618 fib level could be a potential fakeout and that a BEARISH retracement is about the occur. I will be looking for a 38.2 fib level retracement which is also the support level @0.8940. As of now, I will target this level before any further any update.
Kindly hit the LIKE Button if you agree with my analysis and feel free to COMMENT your idea below. As for those who are keen to get daily updates and analysis from me feel free to FOLLOW me. Cheers and Happy Trading!!

NZDCAD Roadmapcurrently, we are seeing price testing the resistance level and we need to wait for price rejection to occur before placing any sell order, ideal downside target price at the 0.8870 support level. good luck traders!
**Disclaimer** the content on this analysis is subject to change at any time without notice, and is provided for the sole purpose of assisting traders to make independent investment decisions.
Traders!! if you like my ideas and do take the same trade as I do, please write it in a comment so we can manage the trade together.
_____________________________________________________________________________________________________________________
Thank you for your support ;)
GWBFX

NZDCAD - INDECISION.DAILY ANALYSIS :
-Around a resistance zone from the past
-Will close as doji if price doesn't move much anymore.
---------------------------------------------------------------------
BI/QUAD HOURLY ANALYSIS :
-slight divergence forming
-price rejecting resistance zone
----------------------------------------------------------------------
It is possible to see potential shorts in the near future if this pair continues to flow the way it is right now, for the rest of the day.
-Please remember I am not a financial advisor & this is just my opinion. Follow me for more education and setups.

After 35 Days - Should I close or should I hold ?, 5 pips awayThe original analysis was made 35 days ago, the pair nzdczd did its thing and triggered our entry. 35 days later it ju is just few pips away from hitting tp.

Short Position on NZDCAD-4HHello Traders!
-------------------------------------------------------------
🚀Sell Execution according to the market.


NZD/CAD Sell opportunityYou can see Major Resistance in D1 Chart, Sell from here :)
Give feedback in comments please.

NZDCAD - Big short sell opportunity almost readyNZDCAD is in a very high value aea right now. It has now complete the 3rd touch of ascending channel structure in cmmbination with double top areaa (inflection point) in higher TF structure. This is a very igh value area to sell.
Nevertheless, with we must pay attention to how the price approaching this area with impulsive leg. Because of that, I cant take any trade here blindly.
We need first to wait for a little bit of confirmation before executing any trade. One thing for sure is I will only look for sell setup in this area. All we need now is an impulsive rejection from this area to the downside, continued by a break of bearish continuation structure (ie: bearish flag, rising wedge, pennant, etc).
In this area, if I get this bearish continuation structure, any break from this continuation patttern even on small 15m TF will do and will trigger my short sell entry with sl above the continuation structure.
Good Luck..

Intraday: NZDCAD BEARISH RetracementWhat we should be looking at for now is a rejection off this strong resistance level @0.8898 price level. We managed to see a rejection off this level previously with price retesting the level once more. However, BULLISH strength is weakening from an H1 timeframe and what I will be hoping to see is a nice rejection off here retesting the trend support before making further BULLISH movement (or a BEARISH breakout). I will update further movement after we see a BEARISH fall from here to the trend support level. Cheers!!!
Kindly hit the LIKE Button if you agree with my analysis and feel free to COMMENT your idea below. As for those who are keen to get daily updates and analysis from me feel free to FOLLOW me. Cheers and Happy Trading!!
