NZDCADANALYSIS


NZDCAD Long Trade.In the name of Allah, the Most Gracious, the Most Merciful
NZDCAD Long Trade.
Note: This is only for Educational Purpose this is not Investment advice.
Thanks
Adil Khan.

NZDCAD reversed from resistance, potential drop!
NZDCAD reversed off its resistance at 0.841 where it could potentially drop further to 0.838.
*Disclaimer.*
Trading leveraged products carries a high level of risk and may result in you losing substantially more than your initial investment. Pepperstone Group Limited is licensed and regulated by the Australian Securities and Investments Commission (AFSL 414530). Pepperstone Limited is authorised and regulated by the United Kingdom Financial Conduct Authority (FRN 684312). This information is not intended for distribution to, or use by, any person in any country or jurisdiction where such distribution or use would be contrary to local law or regulation.

NZDCAD potential reversal!
NZDCAD expected to rise up to 1st resistance at 0.84203 where it could potentially react off and drop down to 1st support at 0.83814.
Trading CFDs on margin carries high risk.
Losses can exceed the initial investment so please ensure you fully
understand the risks.

My Idea on NZDCAD for a couple of days Im seeing a bearish trend on NZDCAD but we got a bullish momentum so until I see confirmation of a reversal Ill be entering sales ( Feel free to leave a comment )

NZDCAD AB=CD DAILY 4BUY POSITIONSPrice after AB=CD
We are buying every 100 pips drop
Take profit is 200 pips for any buy ( so 1 up move of 200 pips from any level and we make profit)
Take profit 2 on the daily SMA200 (300 and 400 also there)
Trade same amount size for any entry.

NZDCAD reversed from resistance, potential drop!
NZDCAD reversed off its resistance at 0.84860 where it could potentially drop further to 0.83642.
Trading CFDs on margin carries high risk.
Losses can exceed the initial investment so please ensure you fully
understand the risks.

NZDCAD DOWN DOWNTarget 0.83000.
Reasons why NZDCAD will fall : Daily shooting star, 4h not a single candle that can be trend changer.
An entry now would be perfect, the sencond entry after it breaks and retest 0.8400

NZDCAD reversed from resistance, potential drop!
NZDCAD reversed off its resistance at 0.84860 where it could potentially drop further to 0.83642.
Trading CFDs on margin carries high risk.
Losses can exceed the initial investment so please ensure you fully
understand the risks.

FREE ANALYSIS ON NZDCADFREE ANALYSIS ON NZDCAD
Welcome to SiriusTrading, Check out my Free #analysis on Forex and Crypto. Follow me for regular Analysis and don't forget to LIKE :)
-
4HR CHART
Bearish Divergence
also watch top for Sell down
Watch break of trend line for sell

NZDCAD reversed from resistance, potential drop!
NZDCAD reversed off its resistance at 0.84860 where it could potentially drop further to 0.83642.
Trading CFDs on margin carries high risk.
Losses can exceed the initial investment so please ensure you fully
understand the risks.


NZDCAD potential reversal!
NZDCAD expected to rise up to 1st resistance at 0.84860 where it could potentially react off and drop down to 1st support at 0.83850.
Trading CFDs on margin carries high risk.
Losses can exceed the initial investment so please ensure you fully
understand the risks.

NZD/CAD Bottom Alert!!NZD/CAD after finding the bottom in OCT-2018 it did 918 pips within 63 Days.
As it was also the same bottom back there in Sep-2015 and with 459 Days it did above 1600 pips.
Now it is testing the same area which can also be considered as the triple bottom
At least expecting 500 Pips in the long term from here.
Note- Wait for a bullish crossover, Rsi showing uptrend!


NZDCAD long long longAfter a few days of indecision where the pair was forming a base at a very important area of support, it has finally broken out of the range and I expect it to continue that bullish move.
Let's look at 4H chart:
It is a very simple setup. The pair has broken out of the rectangle and it is being capped by MA50 that I will expect to act as a minor resistance giving us a bit of a pullback where we will look to enter long with a much better R:R. Profit target will be the next area of resistance at 08665 where the Daily MA50 will also come into play.
Trade safe!


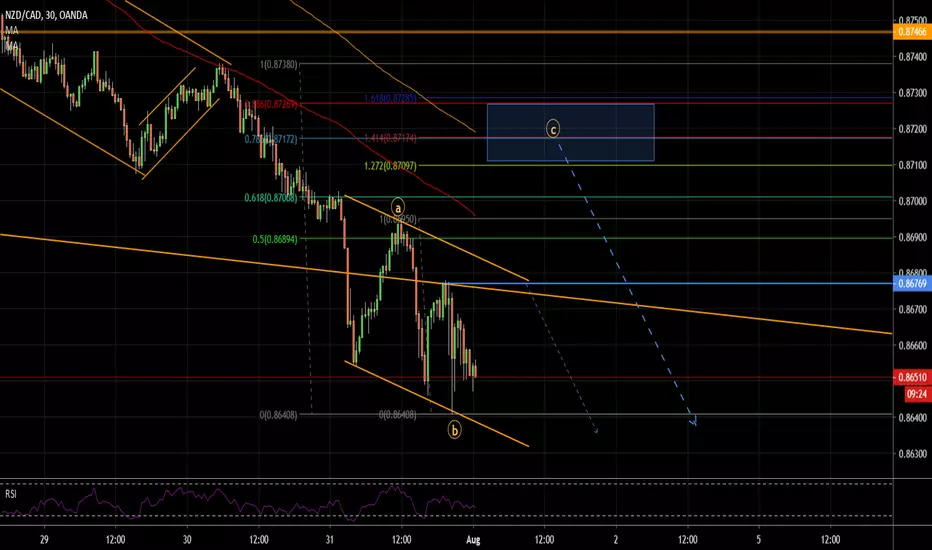
nzdcadok folks since we get precise that nice move down as on previous chart, now im expecting so see some more deeper correction before rushing down again. its early to say whats gonna be but here on this chart im showing my expectations for running flat and expanding. for those who understand patterns there is a gartley taken from the top and butterfly taken from A of the correction. show some love for more updates!
NZDCAD Potential S&D Zone Break with 200 MA BlockGive an inspirational like :)
ArrowPips: Under 200 MA, there is a short potential for NZDCAD.
