NZDCAD reversed from resistance, potential drop!
NZDCAD reversed off its resistance at 0.88695 where it could potentially drop further to 0.87992.
Trading CFDs on margin carries high risk.
Losses can exceed the initial investment so please ensure you fully
understand the risks.
Nzdcadforecast


NZDCAD bounced from support, potential for a further rise!
NZDCAD bounced off 0.88972 where it could potentially rise further to 0.89335.
Trading CFDs on margin carries high risk.
Losses can exceed the initial investment so please ensure you fully
understand the risks.

NZD/CAD bears are going to break ascending channel💡Hello traders,
Hope you all have a fantastic day !
I would appreciate any likes and follows from this idea, that would encourage me to publish more ideas and analysis.
NZD/CAD has been inside ascending channel now for a while, but now price faces first major obstacle - weekly resistance line. We will wait for price to be outside of this channel before opening short positions.
Let us know what you think about this idea.
Trade safe !

NZDCAD SHORT TERM BUY I can see price has made a retest of the broken trendline while also looking to be bouncing from a support level too. As I have a SELL LIMIT in place on this pair at the 0.78 fib level it makes sense for me to be placing buys.

NZDCAD ShortHello, traders, nzdcad is approaching weekly trend line and we could short it is losing momentum also macd is in favor of sell.
If you liked the idea please like and follow for more.

NZD/CAD Possible Short soon? await price actionhey traders,
As we can see nzdusd has been in a uptrend since 23/24th March - we can see it is now approaching a key resistance zone. It last tested this region is June 2019 in which it dropped. If it fails to break this area again in 2020, retraces then retests the resistance but the buyers fail to push price higher..We could see a nice sell opportunity as this would also create a double top confluence as well as being at a key resistance zone.
If this set up plays out, i expect a pull back to the 0.5 fib region which also is around a good support area which is another confluence
However, if price breaks the resistance thus making it support, we could then look for buy opportunities - await price action

Short for NDZCAD on D1 TFAs observed from the resistant trendline, the chart is currently retesting and expected to drop back to the 0.83430 level and complete the inverted H&S.

NZDCAD Short idea planHello traders, here is the trade plan for NZDCAD. For trade entry details please refer to the chart. If you guys like my analysis please hit like. Thanks.

NZDCAD/ Sell Wyckoff & Institutional BiasNZDCAD has reached its D1 Mitigation zone on the body, looks like it could push up to the mitigation on the 50% of the Institutional candle.
I've already made my first entries on that first green line and I'm looking to enter my other entries on the black line above. Another thing that confirms my sell is the wyckoff schematic . Price has reached its UTAD area which signals a major reversal and long time sell. The risk to reward ratio used here is very good (5:92)
Use proper risk management and safe trading.

NZDCAD ready to bearishNZDCAD reached the strong resistant , it can be bearish to next support on Fibonacci.


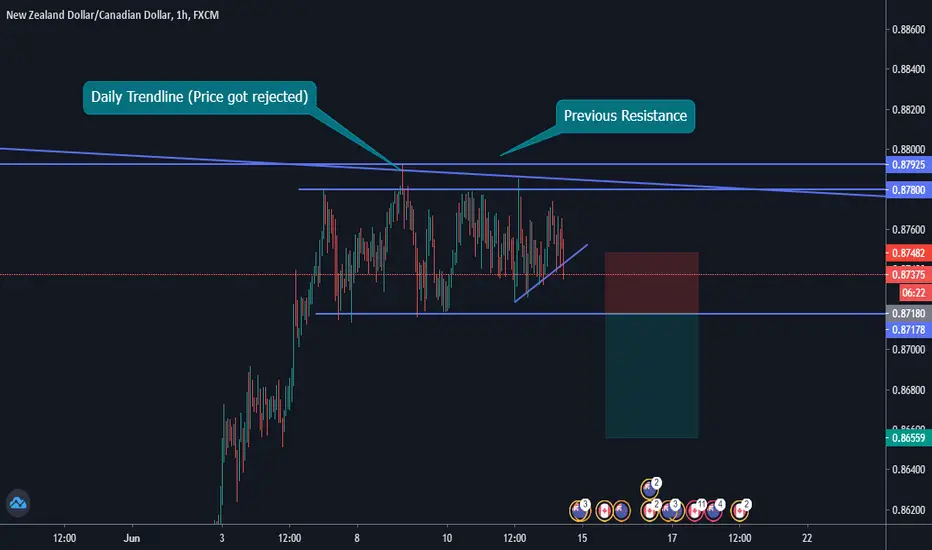
NZD/CAD: Sell after the price breaks the rangeThe price is ranging after reaching a previous strong resistance line and a strong daily trendline. Wait for the price to break the range to the downside and then enter a short position.
NZDCAD SELL IDEA FROM 0.87313 Price has reached a very strong resistance level at 0.87940 which lines up with the 0.61 level on the fib indicating a possible change of trend. My setup became valid when the daily candle closed strongly bearish at this important level. Therefore I am anticipating a swing low.
Entry : 0.87313
SL : 0.88370 (105Pips)
TP1: 0.84500 (270Pips)
TP2 : 0.8060 (670Pips)
1% RISK MANAGEMENT ALWAYS
EDUCATIONAL PURPOSES ONLY

NZDCAD, SHORT Possibilities..Daily,Weekly resistance level.
Retracement is much needed.
0.855 is another expected point.
Take SHORT entry of market opens
in favour.

NZDCAD H1 SHORT PRICE ACTION FORECASTWith price action trading close to a resistance level, together with the 50EMA and downward trendline, it could bring the opportunity for a short trade as a sell-limit entry setup.
When checking the intraday charts at H1, the candle forming was a clear Doji bar signaling the possible fatigue of the short correction from the more significant downtrend bias.
S/L: 30 pip with an R:R | 1:2 with the T/P right from last week's previous support level.

NZDCAD potential bounce!
NZDCAD expected to reverse up to 1st support at 0.84441 where it could potentially react and bounce to its resistance at 1st resistance at 0.85598.
Trading CFDs on margin carries high risk.
Losses can exceed the initial investment so please ensure you fully
understand the risks.


NZDCAD - Price May Grow NZDCAD is now Trading at its support level , We may see Price growing from this area to its resistance area.

NZDCAD SELL IDEADue to the facts that this pair has been trending downwards since 2017 and that it also closed extremely bearish on the weekly timeframe, this trade is aiming to catch the continuation to the downside once the pullback has finished. Also because price has broken above SUPPORT on the daily i am looking to see price reverse sharply causing the weekly candle to look bearish while we have entered at the top of the wick.
Always use 1-2% risk management per trade.

NZD/CAD beautiful example of Sideways ChannelLet's take a look at NZD/CAD 4H chart, what we can see there is a beautiful parallel channel. Price right now is rejected from strong support and now is heading back up to retest resistance line. We can enter trade now as we can see that the price has been bounced from support line on multiple timeframes.
BUY @ 0.84157
TP1 - 0.84657
TP2 - 0.85157
SL - 0.83157
Please do us a favor and leave a like to this idea and follow our channel here and on Twitter as that will help us grow and bring more profitable signals to you ! :)
Good luck !

