NZDCAD ready to take offNZDCAD is testing its major support on higher time frames, i am expecting a possible strong break of the current structure or a double bottom and then sharp rallies, so either way i am looking for longs on this market. Watch this out!
Trade Safe!
Nzdcadforecast


NZD/CAD - ~200 Pips OpoprtunityA reversal from NZD/CAD is expected as it's finding support on top of ema's that acted as resitance up to now.
We can expect it to move back up and hit the 200 ema area *if the 20 ema on the 12 hour holds as support*.
Give it 8 more hours to confirm its strength to reverse.


NZDCAD goes up for next trend line resistance zoneNZDCAD goes up for next trend line resistance zone.

NZDCAD potencial longnzdcad 0.24% making a running flat on one hour time frame use your strategy to trade it, i am just giving you the sense of direction


NZD CAD - Breakout triangle continuation , let's go up!Let's see NZD CAD , thought 0.91500 might act as strong support and let start a retracement but 3 minutes ago , 4h candle close above the previous high , so i'm looking for some long position . Would wait for a retest of the resistance with a SL below the candle. First target might be around 0.92500 , old support zone that this time could act as resistance.
That's just my analysis , my opinion , you don't have to take this post as a financial advice. Remember to always protect your capital.
Have a nice day traders , remember that this week will be a high risk week because of the meeting will occur this week.

NZDCAD - bearish trend beginsLet's the party begin.. if you are noob please don't get scared if pullback happens before continuation of the trend..the white lines are daily charts support and resistance. SL is from daily resistance...
move trail your stop 40-50 PIPS..
PS: my favorite bearish divergence .. i missed the entry earlier on this but will be adding position at pullback...
Please hit "LIKE" to support & follow for more ideas.
Vinny


Elliot Wave NZDCAD Anticipating this move. New to Elliott Wave. Correct me if i'm wrong.
Lets see if it will play out.
Elliott Wave Zig Zag

Long NZD/CAD - potential H&S (medium to long term)Weekly
8 period moving average has crossed above the 16 period moving average. Referring to a monthly chart this could be the dip in order for the long term up trend for this pair to continue.
Daily
Looking at the daily chart, a head and shoulders pattern has formed. The resulting neckline can be drawn in two ways:
1. Horizontal at 0.91 - in line with the left shoulder and a level at which the current price has been flirting with.
2. Slanted - in this case the neckline has been broken and price action over the last couple days can be viewed as pull back to the falling neckline.
In both cases the right shoulder formed a low of 0.886. which is now a key level for this play.
The second notable feature of the daily chart is the ADX crossing above 20 suggesting a trend is starting out.
4 Hour and 1 Hour
Key support lies around 0.9012. On the hourly my current entry lies 0.9013 to 0.9040. Over the last couple days price has rallied after entering this range and is therefore a key region of support. Note this also lies just above where the slanted neckline would be.
Trade Parameters
Entry: 0.9013 - 0.9040
Stop loss: 0.8850
Targets: 0.9240 (R/R: 1.29), 0.9410 (R/R: 2.29) and 0.9530 (R/R: 3.00)

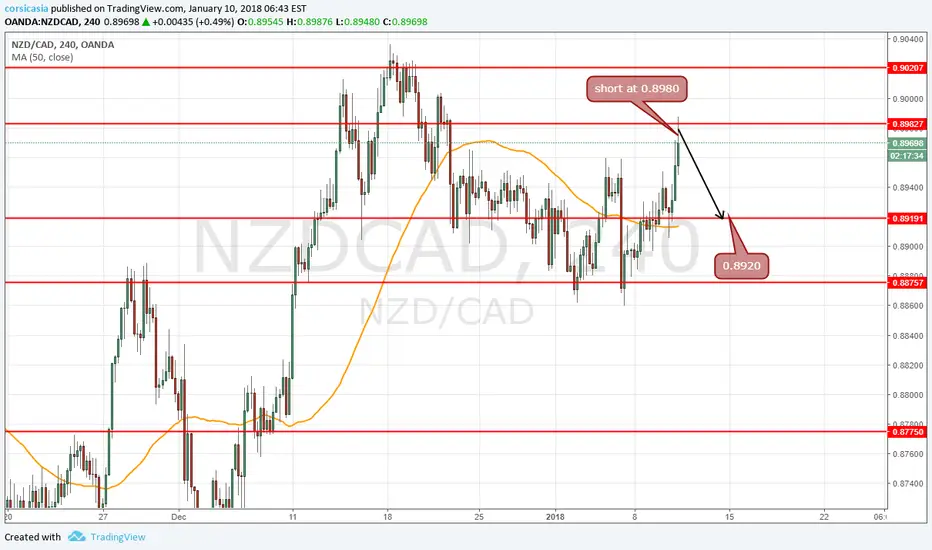
short at 0.8980 for target intraday 0.8920 (60pips)From my view NZd outperform and cad underperfom so i made this intraday trade
short at 0.8980
target 0.8920
gains 60 pips
in 2 x 1 lot when first lot reach 25 pips i cut it and make the second lot with a SL at + 15 pips
short at 0.9021 for target 0.8920i short bzd cad because i found cad very undervalued
also NZD milk price was down of more 3% since last and new Giv and member on monetary policy is still not clear for futur.
short at 0.9021
target 0.8920
Gain 101 pips
come with 2x 1lot will cut the first at +30-40 pips and make a Sl on a 2nd at +15 for securite 45-55 pips if my plan fail

NZD/CAD Short Burst PositionOANDA:NZDCAD The reward to risk ratio is almost exact. Past 5 years and max have been profitable. Past few month have been non-profitable and filled with some more downward trends or negative correlations. Past year have been bad, and past day haven't been optimal as well as past week in terms of nice results. However, I am seeing a butterfly effect with an around 3.77% yield and the potential of positive correlation for a short holding position the next few weeks, and even some swings the next few month.

NZDCAD Watch Out For Bollinger Band Spike And Support BreakHi traders,
I am hoping to see a clean Bollinger Band spike for a reversal to the downside. If it does not happen, then I will anticipate a trade once the support below breaks. Let's see how the chart develops. We will very likely see an RSI Divergence as well.
(This is not a trade recommendation!)

short at 0.9000 for target 0.8920 (80pips)i short Nzdcad for a small coreection of 80 pips
as he is much overbought in all indicator and CAd is undervalued
enter at 0.9000
target at 0.8920
gain 80 pips
open 2 x 1 lot ..when a first lot will reaach 40 pips i will cut it and let the other with a stop loss at +20 pips for secure the gains

Short Term NZDCAD Long SetupThis research is for informational purposes and should not be construed as personal advice. Trading any financial market involves risk. Trading on leverage involves risk of losses greater than deposits.
Please comment below and Like if you agree with my analysis.


NZDCAD - BUY OpportunityWe have a bullish gartley around a major support area. Looking to go long upon proper rejection and signal confirmation.
LIKE and FOLLOW to get instant notifications each time i post trade setups.
