Long NZDCADNZDCAD is rejecting from Weekly support , long on the break of 4H Resistance and retest with good risk reward
Nzdcadlong

Long NZDCAD wait for the buy signal ,first time you have to break the down channel and after retesting it

NZDCAD Long Zone entryFor more expert daily analysis, go ahead and click on the follow button!
Here we have another CAD pair.
We are now returning to KEY support zones where price has been rejected previously.
There is buying power here and we are looking to move further back towards our MA's at the current oversold price.

NZDCAD LONG IDEAHey guys, this pair bounced off from a major daily support level. I expect it to continue with the bullish momentum

NZDCAD - Support Forming?Looks like we have have some support forming keeping an eye on future support for NZDCAD.
- Gas Prices in New Zealand at an all time high $7+ per gallon.
- Economy CPI is high
- Average 3 bedroom is about $2,700 per month
- Government is going to make a correction

NZDCAD BUY TRADE IDEA - BREAK OF STRUCTURE & WEEKLY ICIHello everyone, if you like the idea, do not forget to support with a LIKE and FOLLOW for more creation of free analysis. \m/
Monthly, Weekly, & Daily is bullish. We go on the weekly where we can see that we have an ICI to the upside and a major support structure where the market has tested it multiple times before, we are expecting it to retest the support before it continues to the upside. Dropping on the 4H time frame, we are waiting for the MACD to be above the 0 and EMAs are already cut for long, our entry is at the structure and stop loss is below structure and last low, our take profit is at the impulse of the weekly.
Trade Signals
BUY
Entry: 0.88063
Take Profit: 0.90044
Stop Loss: 0.87416
Good luck!
Trade wisely, please do proper money management.
~FX_SHIFTER

NZD/CAD Is About to Reverse 💡 📈 NZD/CAD | Potential Upward Movement
💡 Buy Limit Order @ 0.88359
🎯 Target Profit 0.88820
🛑 Stop Loss 0.88128
❌ Do not risk more than 1% of your account on each trade
Description:
The price found buyers around the 61.80 % Fibonacci retracement level after managing to break the bearish channel pattern. This shows that the buyers are taking control of the market and might push to the upside which is the opposite direction of the current trend.
-------------------------------------------------------------------------------------
Please press “Like” if you appreciate the trading idea 👍
“Follow” for more trading ideas in the future 👀
“Comment” below to share your thoughts with us and other traders 👥
-------------------------------------------------------------------------------------
Risk Disclaimer: All trading ideas published by “collegeofpips” are for educational purposes only. These posts can help you to enhance your trading skills, but please do your own research before opening any trading position. ⚠️ ------------------------------------------------------------------------------------------------
🙂 Good Luck!

NZDCAD Long Term BullishCouple long term targets for NZDCAD on the Weekly
Could break to the upside from where it is now, third touch of the 38.2 fib retracement + possible end of correction cycle

NzdCad can reach 0.9After finding strong support in 0.8620 zone, NzdCad reversed and made a first leg up to 0.9 figure.
Now the pair is correcting this move and this can be a good chance for bulls to get onboard
0.8780-0.88 zone is strong support at this moment and dips to that zone should be bought for a new rally to 0.9 zone

NZDCAD Long setup | Break and retestHey traders, here is the analysis for the NZDCAD. Let me know if you guys have any questions in the comment section. If you guys like my analysis please hit like. Thanks. NOTE - Please do your own analysis before taking the trade.

Waiting for a pullback to go long NZDCAD 18 Oct, 2021When this market is trending, the relationship it has to the 20EMA is consistently good. The EMA holds the price down when bearish and provides support when bullish. When price touches the EMA it has been a good location to take a trade in line with the trend.
We seem to be at the start of a new bullish move and if this holds true, taking a buy at the next pullback could be a good trade with a large potential R/R. The support around 0.8630 has held since mid Aug. and I expect it to hold again. However, nothing is 100% in trading and what was true in the past may not be true now. Place a stop loss on the other side of the 20EMA but give it some breathing space.
If you like my analysis, please give it a “thumbs up” and follow me to get immediate notifications.
Always use sound money and risk management in all your trades.

Fri 15th Oct 2021 Daily Forex Charts : 3x New Trade SetupsLooking at the Daily Forex charts and using the High Probability & Divergence methods from my books, there were 3x new trade setups identified today. Just be careful of correlation though as the NZD is involved in all 3x trades. Enjoy the weekend all. Cheers.

NZDCAD LONG IDEAHey guys, this pair traded to a strong support zone and bounced. We see formation of a double bottom which is a bullish reversal pattern. It also broke the trendline on the right. With those confirmations, i'm looking to go long on this pair

NzdCad is approaching great support zoneFor a month now NzdCad is in a downtrend. However, the pair is approaching a great support zone and a buy trade in this zone can have a 1:3 R:R for swing traders
Buy dips under 0.87 can be a good idea and a dive under 0.86 would negate this scenario

NZDCADBullish Indicators:
1) Bounced from the upward trendline
2) Support zone
3) Followed by the three white soldiers
4) 78.6% Fib Retracement level
Bearish Indicators:
1) Descending trendline
2) Resistance at 0.87890
Plan A: On the breaking of resistance level 0.87890 and downward trendline one can buy for the target 0.88535.
Plan B: On the breaking of upward trendline one can sell for the target of 0.86666 where the major support lies.

NZDCAD LONG IDEAHey guys, This pair previously formed a double top and was bearish till it got to that lower trendline which shows lower highs forming.
I'm bullish on this pair. Incase it breaks that lower trendline, my bias will change.
Happy trading

NzdcadNzdcad start with up trend, because one hour time frame candle form of higher high formation and then day chart candle tough trend line

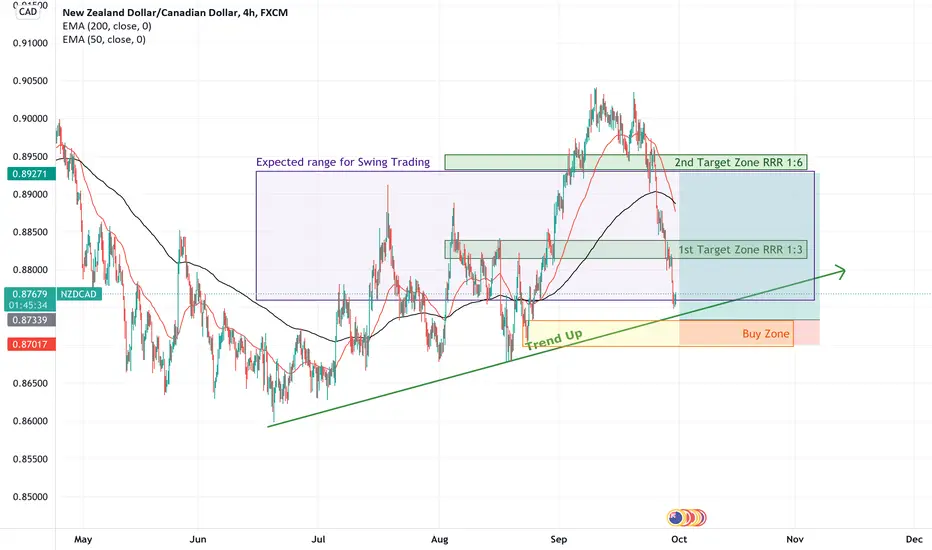
NzdCad H4 Trading Idea RRR 1:3-6Buy Zone 0.87346 - 0.86981
1st Target (RRR 1:3) 0.88170
2nd Target (RRR 1:6) 0.89307 at Top Expected Range
Move the stop loss to breakeven after 2% profit
FOREX ANALYSIS : NZDCADFX:NZDCAD
The blue and red lines mean: I think prices can return in these areas.
Green lines mean: I think the price can reach these areas. They are therefore known as transaction targets.
If you want to use this deal, please risk only one percent of your account balance.

NZDCAD Looking for Long PositionsHi Everyone,
After the rotation in the channel we arrive to the supor level & Base of the Bullish Channel with the indicator in the area of Overbuy Time Frames => M5&H1&H4.
1) First, I want to see a Breakout of the bearish Channel.
2) Second, I want to see any signal, Chartist, Candles or in the indicators to get in.
Then I trade as usual 1% Risk. 0.5% for the entry and another 0.5% to get in at the lowess, with a Stoploss ATR Daily.
Goodbye & Good Trading!!!

H1-H4 NZD/CAD LONGBASED on Daily chart NZD/CAD at strong support level. Possible pullback to 88.15 price range.
Not a trading advice.
Trade wisely.

NZDCAD: Catch The Ride DownI would expect the price to come back to the equal low liquidity before we see any signs of bulls.
I would want to enter sells on a slight pullback.
If we see a pullback with signs of rejection I will be scaling in sells for a juicy drop to the downside.
Do you agree with me?

NZDCADprice already broke the uptrend channel and already make an retest to, waiting the candle confirmation and we ready for short trade. But price maybe broke the retest and going uptrend. remember always waiting for the breakout + retest + candle confirmation + money management + psychology. GOOD LUCK
