NZDCAD SWING TRADEHigh probability trade
The analysis begins from the Daily timeframe to the 4-hour timeframe execution zone .
5 wave structure complete with multiple wave structures currently in a 3 wave pattern internal structure (3-3- ((with a possibility of 5 to follow)))
Considering where wave B has ended we should consider a high probability that wave C might only go back to the previous high in the wave structure or point A
Nzdcadlong

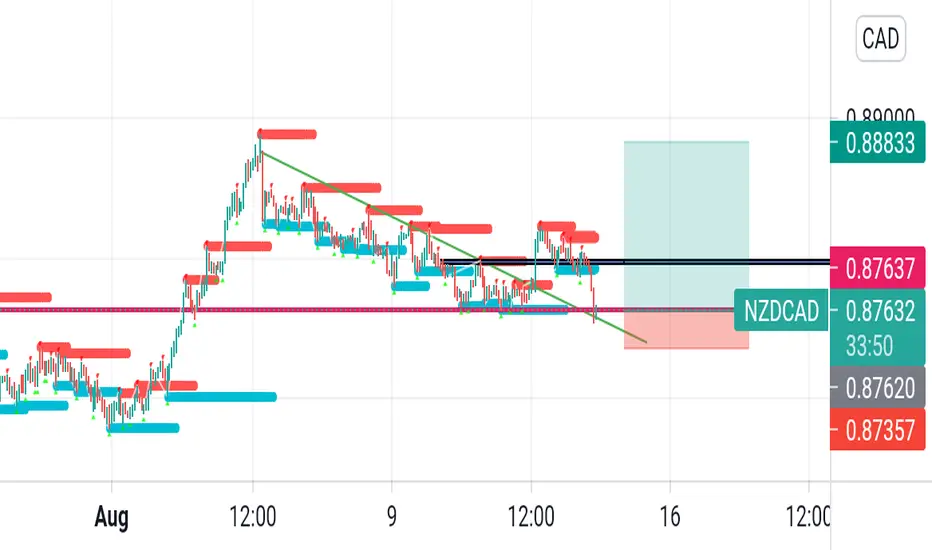
Short NZDCAD NZDCAD after touching Weekly and daily resistance is moving down , once TL and support is broken to the downside we can go short on the retest with the Stop loss previous high and take profit as indicated for good risk reward

NZD CAD LongWait for break of Key Daily Level before entry.
Key Weekly price level is the Target.
Oscillators looking strong as we approach this Daily level.

NZDCAD Looking For A Buy IdeaIn this we are looking at the Bat Pattern Harmonic as you can see we watching the trend up
Now we wait for the pull back into the logical area ready to push up from the logical area and its also a nice 50% area of this Bat pattern B area looking left
see how we have HL trend forming beautifully on its way up to the D point this is where we wait for the pull back you possibly could sell from this area but im waiting for the pattern 50% retrace then take it on the up to continue trend
What is your thoughts........?

NZDCAD Hello Friends, I am looking for great long opportunity in this pair. As price has broken Descending wedge and started bullish corrections in range. I will be looking for structure areas where I will wait for rejections or Will wait for breakout and retest. Range structure levels are both in long favor we just need to see confirmations for good risk to reward ratio.

NZDCAD BUY AND SELL SETUP The pair is expected to buy to complete the gartley pattern
at point D. buy all dips on lower time frame to point D

NZD / JPYIf you reach our support range, be ready to buy
The price has reached the bottom of the channel

NZDCAD LongIt's pure price action and easy to understand.
Disclaimer: It's not a signal it's an idea, open positions by your own responsibility.

10 August: NZDCAD could see a reversal here Hi everyone, NZDCAD is seeing limited upside before it reaches resistance at 0.88390, in line with the 61.8% retracement. A reversal below this level could see a further downside to our next support target, in line with the 127.2% extension.

Update on NZDCADgood day boys and girls. Previously on my NZDCAD analysis i state that price broke out of our descending structure and we were looking to enter on a buy if it gave us a flag on either the 1HR or 15M timeframe. Instead price failed to do that and we saw a strong impusive sell on NZDCAD .
I am still bullish on NZDCAD ,even though we did not get that correction ,price is still inside our descending channel ,our structure has evolved to a descending channel as we do not marry our analysis but evolved with the market.
I am currently looking for a strong bullish reversal from where price is now which is the third touch on the descending channel followed by a continuation correction on the 15M timeframe and a buy entry on break of correction.

Wait for confirm and buy signal with NZDCADH1 time frame.
Structure: Break downtrend.
Break Key level and downtrend - retracement.
Wait for retest at Key level 0.88000 and buy signal.
Target is next resistance at 0.88800.
-----------------------------------------------------------------------------------------------
Wish you all have a good trading day!

NZDCAD TO CONTINUE WITH THE BULLSAs we have seen, price has broken above this key level with bullish pressure.
We also see a break outside the corrective downtrend.
We could see further upside on NZDCAD after a pullback.
We'll be watching for early retracements, pullbacks at key levels, any trend continuation techniques to get us in.

NZDCAD TO KEEP PUSHING LOWER?Since the deep fall from the level of 0.88700, we have seen price continue to create lower lows and lower highs to continue the downtrend.
We just recently broke below a support level at 0.87800. Until we see a break above, we remain bearish and will look for sell opportunities.
If we find a break above then we could switch out bias from bearish to bullish. New targets on this sell would be a new low along the trend.

NZDCAD LONG Price making nice FLAG pattern & trying to brake upper trend line . entry will place after retest.

Outlook for NZDCADDon't know what to say :). Should be going to the 4Hr demand zone, before smashing supply
Picture speaks a thousand words

NZDCAD ANALYSISWe have this pair following our last update and continuing to move down.
We expect a fall to 0.87800 and a bounce from that level to the upside.
If price gets to 0.87800, it would be regarded a higher low on the 4-hour and daily timeframe.
We could see the bounce from there. As for now, we remain patient, riding with the current profit on this pair.

NZDCAD ANALYSISAfter the bullish rally on this pair, we see price reacting to and rejecting the key level of 0.88700.
We could see some short term retracements before any bullish rally would continue.
We would look for short term sells on the lower timeframes once the opportunity presents itself.

nzdcad sellnzdcad sell :
Reasons :
1)there is a nice pattern trend formed in 1h,4h,1d timeframes
2)a bullish pin candle is formed as marked in the previous days which indicates perfect entry for sell
3)bearish naked candle confirmation in 1h,4h time frames
take profit : green line
stop loss : red line
wait for my confirmation to place trade

Wait for confirm and buy signal with NZDCADH4 time frame.
Structure: Uptrend, Price hit trendline and move up.
Downtrend - retracement has been broken.
Wait for the confirmation and buy signal.
Target is next resistance at 0.89000.
-----------------------------------------------------------------------------------------------
Wish you all have a good trading day!

NZDCAD#NZDCAD
The market is currently moving in the bearish channel and will pull back and change trends from strong support.

NZDCAD TO CONTINUE TO THE DOWNSIDEWith the current bearish momentum and downtrend, it would be wise to flow along.
We're waiting patiently to see how price pulls back into some of these key levels before taking sells.
Patience is required so that we do not jump into absurd trades.

NZDCAD LONGAs we can see, the pair is moving in an ascending channel on the H4, and it has bounce from bottom trend line and a minor support Level 0.87413.
We expecting a bullish continuation, this trade is based on Technical analysis.
Please use proper risk management depending on your account size, Use lot sizes based on these calculations.
Here is a break down of your pip value in ZAR and Dollars
0, 01 = R1,43 / $0,10c
0. 05 = R 7,15 / $ 0.50
0.10 = R 14,3 / $1.00
1 Lot size = R 14,26
How to calculate Margin = (Lot Size * Contract Size)/Leverage, Lets say your broker gives you 1:500, and you open 0,2 size, How much are you exposing ? calculations : (0.2 * 10 000) / 500 = $4 (R58)
Remember, These are long term trades, It is advisable to have enough margin to handle the fluctuation of the markets.
Please like and share for more useful content:
