NZDCADReversed at turncoat area, heading down now with a broken trend line. we may or may not have a pull back to retest the trend line, SL should be in Turncoat area, TP not given, you should monitor and watch for price action.
Nzdcadlong


(1h) Vanished opportunity or a second chance? // IF=THEN ®FX:NZDCAD
Let's see if the opportunity does not fade between fingers...
With a cluster/projection below the expected entry point, i'm expecting the price to pullback;
I'm waiting for the structure to show me what this pair have prepared;
If that does not happen, I am out.
We'll see... patience.
Safe Trades;
www.tradingview.com

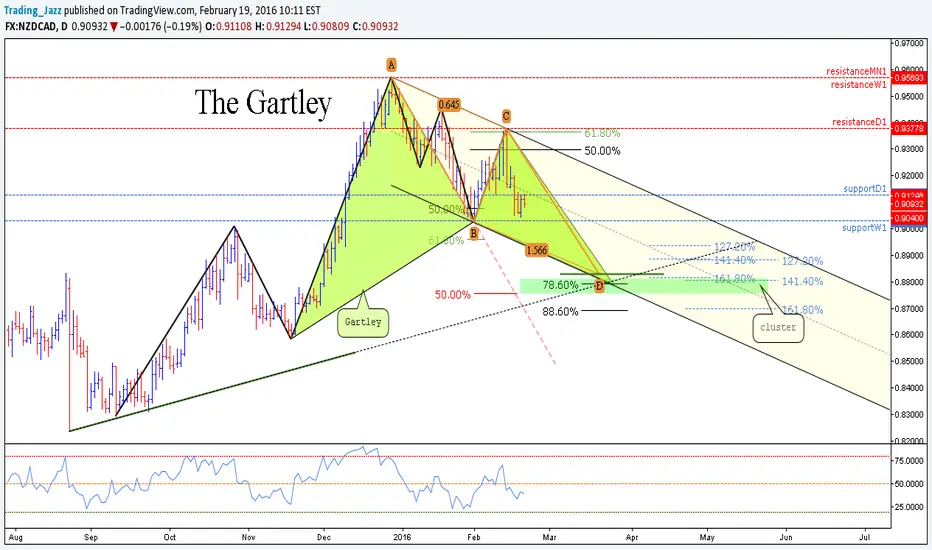
(Daily) Bullish Gartley // Keeping Bearish momentum // IF=THEN ®FX:NZDCAD
GARTLEY
Point B:
61.8% can not touch 78.6% XA
Point C:
38.2% to 88.6% AB
Point D:
78.6% XA
127% ext AB
Target:
TP1 38.2% AD
TP2 61.8% AD
Safe trades;
open.spotify.com
(D) Completed Gartley & AB=CD // Major Bat & Shark // IF=THEN ®FX:NZDCAD
BAT:
Point B:
38.2% to 50% XA
Point C:
38.2% to 88.6% AB
Point D:
88.6% XA
Targets:
TP1 38.2% AD
TP2 61.8% AD
SHARK:
Point B:
61.8% XA
Point C:
113% to 161% AB
Point D:
161% to 224% BC
88.6% to 113% XC
Target:
38.2% to 100% CD
GARTLEY
Point B:
61.8% can not touch 78.6% XA
Point C:
38.2% to 88.6% AB
Point D:
78.6% XA
127% ext AB
Target:
TP1 38.2% AD
TP2 61.8% AD
Safe Trades;
open.spotify.com

Bears&Bulls // Bearish Harmonic & Bullish iMpulse // IF=THEN ® FX:NZDCAD
Bulls Mode:
. Expecting Bearish RSI Divergence and a pull back (wave 2);
. Wave 3 targeting the 161% extension of wave 1;
. New pull back that can not cross wave 1 top;
. Wave 5=wave 1 target @0.9250$
Bears Mode
@61.8% from previous move (A to B);
AB=CD target @0.8735$
Safe trades;
open.spotify.com

NZDCAD SHORT and LONGWaves within Waves, Short the 5th wave of the 4th Corrective move trading within the channel up till 61.8% Fibo level at price 0.8965, then Go LONG from this level to breakout the channel resistance 5th wave (impulse) on the Weekly chart.
Apply due diligence.


Bullish Bat // IF=THEN ®FX:NZDCAD
A copy of my previous published idea on FX:NZDUSD :
BAT:
Point B:
38.2% to 50% XA
Point C:
38.2% to 88.6% AB
Point D:
88.6% XA
Targets:
TP1 38.2% AD
TP2 61.8% AD
Safe Trades;
open.spotify.com

Long NZDCAD: Bat + Crab + S/R + MA SupportNZDCAD is nearing the completion of two confluent harmonic patterns within a tight PRZ. A heavy S/R zone sits below the PRZ for added support. 200 EMA and SMA lines may add support as well. To add to bullish bias, RSI is oversold at current levels. Entry is placed at the bottom of the PRZ with target at .382CD and SL below the S/R zone.
R/R = 1.44
Confluence in the PRZ:
Bullish bat pattern completion
Bullish crab pattern completion
3BC projection
2AB=CD
200 SMA Support
200 EMA Support
RSI Oversold
