NZDCAD Top-Down AnalysisHello Traders,
Here is the Top-Down Analysis of NZDCAD (Monthly, Weekly, Daily for direction and 4H for entry) for
Week 41 - 06 Oct
M > Market is moving in a downward channel, price dropped from resistance level of the channel completing the W formation.
W > Price dropped to test monthly support, faced rejection and moved to test weekly resistance. Price also has support of rising trendline.
D > We can see formation of H & S pattern, hence we can expect bearish movement.
As per COT NZD saw addition of few Long and more Short reducing net positions, confirming weakness of NZD for the said week. ZXY improved its position last week. CAD saw closure of both Long and Short positions, N-R saw addition of Long and Short positions and Commercials saw closure of both Long and Short, confirming weakness of CAD for the said week. CXY gained strength last week.
4H > Price is creating LH and LL in its bearish trend, price needs to break 4H support level to confirm bearish trend. We expect drop till support trendline.
Pair Correlation > NZDCAD has positive correlation with NZDCHF and AUDCAD and negative correlation with EURNZD and GBPNZD.
This was my Idea and I hope you find it useful. If you find the analysis of help please leave a LIKE and FOLLOW for receiving all updates during the week. In the comment section you can share your view and ask questions.
Thank You
AP17FX
NZDCADSETUP

NZD/CAD New Setup To Catch More Than 150 Pips As We See We Have This Head And Shoulders Pattern And The Price Close Below Neckline And Now We Can Enter A Sell Trade After Retest For Neckline And Have Any Bearish Price Action To Confirm .
This is an educational + analytic content that will teach why and how to enter a trade
Make sure you watch the price action closely in each analysis as this is a very important part of our method
Disclaimer : this analysis can change at anytime without notice and it is only for the purpose of assisting traders to make independent investments decisions

Short Position on NZDCAD 4HHello Traders!
-------------------------------------------------------------
🚀SELL Execution according to the market.
------------------------👇🏻👇🏻Look the running swing trades below👇🏻👇🏻
-----------------------------------------------------------------------------------------------------

NZD/CAD and where to SELLHey tradomaniacs,
previous fakeout the the downside hasbeen a strong Stop-Loss-Fishing-Move and resulted in a strong upmove.
Currently NZD/CAD is testing a strong resistance but still shows a lot of buy-pressure there which makes it more likely to see a break until the next resistance which would complete the A-B-C Pattern close the the 50% - 61,8% Retracement.
Up there we would probably get a nice chance to sell as soon as we see bearish confluence.
LEAVE A LIKE AND A COMMENT - I appreciate every support! =)
Peace and good trades
Irasor
Wanna see more? Don`t forget to follow me.
Any questions? PM me. :-)


Short for NDZCAD on D1 TFAs observed from the resistant trendline, the chart is currently retesting and expected to drop back to the 0.83430 level and complete the inverted H&S.

NZDCAD MULTIFRAME IDEA ** JUST AN IDEA. NOT A SIGNAL **
We can clearly see momentum has been lost within the 4 hour graph.
A range has been formed, once the trade shows us a breakout we could buy or sell.
We know the volume of buyers or sellers will be strong once the range has been broken.
Interesting pair to watch.
Thanks for viewing!
Please support this idea by liking and leave any comments you wish ✨
Feel free to support us with a follow or join us for free on telegram SnapForexFreeChannel✨
SnapForexOfficial.


NZD/CAD, Breakout of the Key Level would offer long opportunityNZD/CAD struggles to break the key level. If the price will break it, we would take long entry with our members with awesome risk to reward and probabilities for a nice push to the upside.

NZD/CAD, Wait for confirmation before entering BuyThis pair has a good chance to break this horizontal key level while staying in this ascending triangle. If it happens, our students will be taking a long position with a nice risk to reward and probabilities for a nice push to the upside.

Short NZDCAD Move For Short-term/Intraday Trading SetupA short term downward move can be expected in NZDCAD, especially after the big rally because of falling crude oil prices (CAD is heavily reliant on crude oil prices). I feel that some government intervention will happen to cool off such dropping prices, leading to crude oil prices increasing a bit in the short term, thus giving some strength to CAD, which will cause NZDCAD to fall (expected target is 0.85100).

NZDCAD--Weekly Market Outlook from 06 to 10 April 2020
Follow me for more update and Analysis.
What You Get:
- Weekly Market Analysis using my strategy.
- Results of our tried, tested and proven Strategies
- Latest and greatest news and content from the Forex World
Never Trade alone
we really hope you enjoy the All analysis
thank you


NZDCAD LONG! 4HRPurpose of idea is to complement your research.
Check comments section for future updates on idea.
Like this idea?
Like, Share, Follow, and Support channel for future content.
Thank you and happy trading.


Trading Pathways Analysis of NZDCAD H4 Chart
The outlined white arrow pathway is the predicted pathway that the NZDCAD will follow in the coming days or weeks. Using my unique charting methods, I have been able to arrive at HIGH PROBABILITY turning points where NZDCAD will turn.
PLEASE NOTE THE ABOVE ANALYSIS IS FOR EDUCATIONAL PURPOSES ONLY. THEY ARE NOT DIRECT INSTRUCTIONS TO TRADE AND ANY LOSS INCURRED BY FOLLOWING THIS ANALYSIS IS AT YOUR OWN RISK.
Eiseprod of Trading Pathways


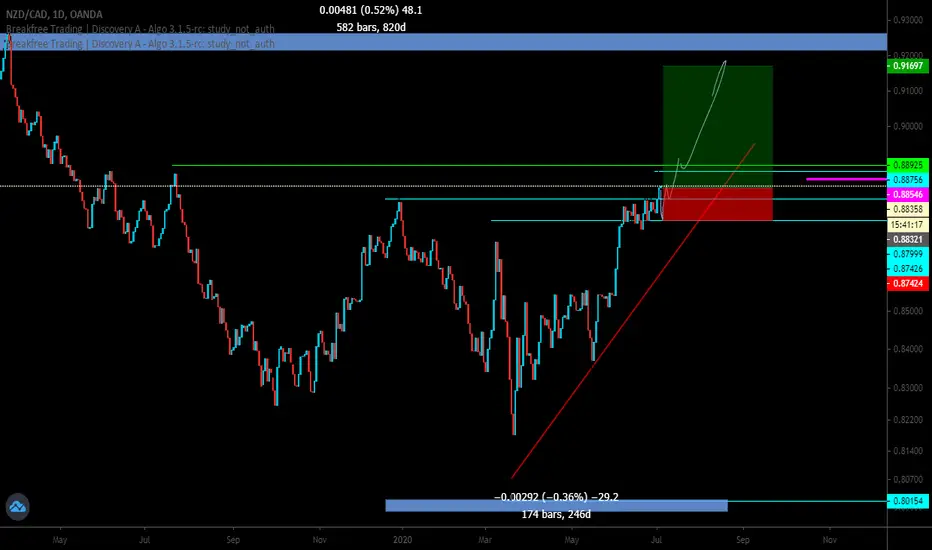
NZDCAD Bulls are Ready to Take OverNZDCAD's current chart pattern is unfolding as a bullish Elliot Wave impulse structure. Price seems to have completed wave (iv) of 3 which set a stage for another rally in wave (v) of 3.
Price has also rejected a weekly support area that lined up with a moving average. The potential price target is within the blue zone on the chart.

NZD/CAD SHORTNZD/CAD SELL LIMIT
ENTRY 1 .86660
ENTRY 2 .86750
Sl .86877
Tp.1 .86410
Tp.2 .86200
Tp.3 .86920

NZDCAD 30MHello Traders!
This is in case the short doesn't work out,
this is the long trade consideration.
Best,
Jay
