NZDCAD - NEXT LEGANALYSIS ON NZDCAD
Welcome to my analysis
-
30MIN CHart
-
Interesting Point of interest In the NZDCAD pair.
- Price above 200 day EMA.
- look for sell signals.
- Expecting some more downward movement.
- Watch 0.85000/0.84320 for take profit.
- MACD showing bearish divergence
Stay Tuned
NZDCADSETUP

NZDCAD - BULLS TO CONTINUE PUSH UPANALYSIS ON NZDCAD
Welcome to my analysis
-
30Min CHart
-
Interesting Point of interest In the NZDCAD pair.
- Price flirting with the 200 day EMA.
- Buy reversal.
- Expecting more Upward momentum.
- Watch 0.84500 for take profit or around 0.84800.
- MACD showing bullish divergence
Stay Tuned


NZDCAD Analysis: Price following a triangle patternHi traders. As we can clearly see, the price is following a triangle pattern.
I see I a very high likelihood of the price rising higher towards the resistance line of the triangle.


My Idea on NZDCAD for a couple of days Im seeing a bearish trend on NZDCAD but we got a bullish momentum so until I see confirmation of a reversal Ill be entering sales ( Feel free to leave a comment )

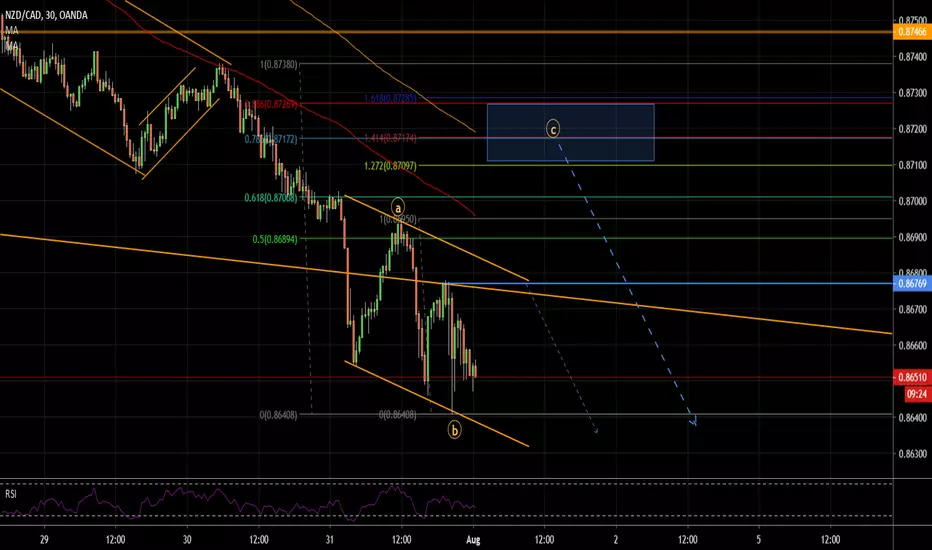
nzdcadok folks since we get precise that nice move down as on previous chart, now im expecting so see some more deeper correction before rushing down again. its early to say whats gonna be but here on this chart im showing my expectations for running flat and expanding. for those who understand patterns there is a gartley taken from the top and butterfly taken from A of the correction. show some love for more updates!
Downtrend volume - sellOn balance volume is in downward channel and below its 200 EMA. Price rejected from monthly pivot and closed below 100 SMA of BB. TP1 - previous monthly S1 level. TP2 - monthly pivot Support 1.


COULD NZDCAD OFFER SIGNIFICANT LONG TERM UPSIDE MOVE?Hi Traders,
The 4-hour chart of NZDCAD shows a bullish move from October 2018 as a classic five-wave impulse in wave (A) "black."
According to the Elliott Wave theory, a three-wave correction in the opposite direction follows every impulse pattern. And indeed, the rest of the chart reveals an A-B-C zigzag correction in wave (B) that rejected the 38.2 Fib ratio and support level so far.
.
If this count is correct, there is a complete 5-3 cycle to the upside, and this means another five-wave bullish impulse can be expected in wave (C) from now on.
.
Given that the bulls already made the first impulse in wave 1 of (C), and we have a three-wave a-b-c regular flat pattern in wave 2 of (C) that reversed from 78.6 Fib ratio, a bullish continuation is expected in 3 of (C) whose potential target lies between 1.618 - 2.618 as planned on the chart.
.
The Friday's bullish engulfing candle on the Daily chart further confirm the completion of wave 2 correction and could be used as a signal to enter the bullish setup.
Safe Trading!
Veejahbee.

NZD CAD SHORT! GREAT SET UP NZD CAD, presenting us a great opportunity for a short.
A clear 4h break of 0.90476 and a retest on 1h would be a great entry for this pair. For a nice 120 pips!
I will updating you guys.
All of the best
TRADING PROTECTION


NZDCAD heading down!!!NZDCAD moved to the descending trendline where i personally got short entry at 0.9241 right at the lower timeframe double top and it moved down nicely. Of course there will be another trading opportunities on the lower timeframes. Targets are set and now wait for pullbacks to resistance levels.

Short Term NZDCAD Long SetupThis research is for informational purposes and should not be construed as personal advice. Trading any financial market involves risk. Trading on leverage involves risk of losses greater than deposits.
Please comment below and Like if you agree with my analysis.
