NZDCADHello everyone This is just a simple observation. If you like the idea, do not forget to support with a like and follow.
Nzdcadshort

NZDCAD Looking For Sell SetupNZD - Weak Bearish
1️⃣ A negative market environment can depress high-beta currencies such as the NZD.
2️⃣ The NZD was also weighed down by weak economic data from China on Wednesday.
CAD - Weak Bullish
1️⃣ Rising crude oil prices can support the strength of CAD.
2️⃣ The annual inflation rate in Canada accelerated to 4.1% in August of 2021 from 3.7% in July and compared to market forecasts of 3.9%.
=====
Technical
=====
We are looking to sell NZDCAD if the price breaks the support area.
=====
Risk to this trade
=====
Any change in sentiment could turn the pair's direction.
Don't forget to like, comment, and subscribe for more ideas.

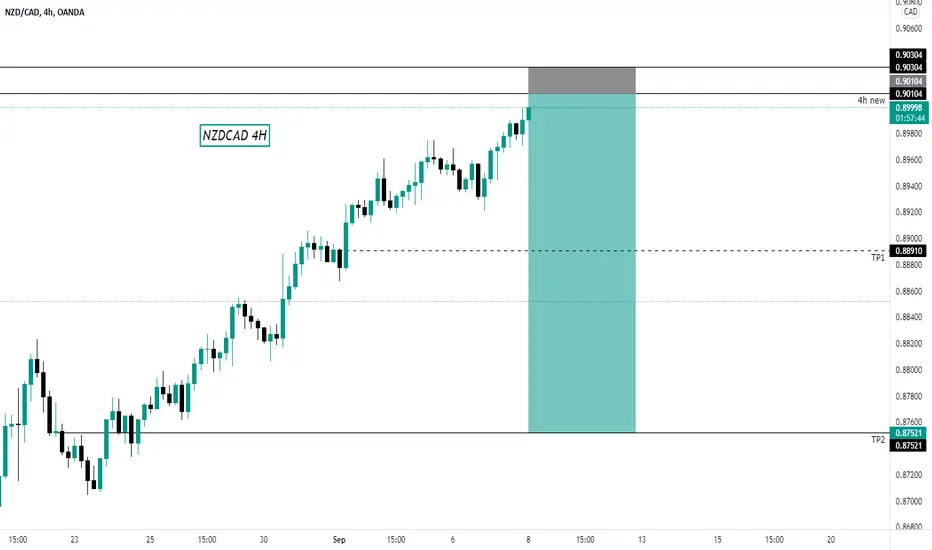
NZDCAD high potential trade ideaClose to RSI 70% level (oversold). Can't break the 0.903 resistance level. Forming tweezer top candlestick pattern in a daily chart. Brokedown ascending channel and forming a descending triangle. It might be Bearish Reversal. If it broke down 0.8996 to descending triangle possible to drop down to 0.8838 or more.
It will be a good confirmation for entry break down 0.8996 and retest back.

NZDCAD ANALYSISOn this pair we see a potential sell, if this uptrend break is confirmed and we break this support we can enter on a sell with really great chance to see the 0.5 levels on this impulse, we could see further correction to 618 but we need to check the strenght of the correction. If this support resist we can see this uptrend being continued and testing the 0.91 resistance. Wait for the market and react! Good Luck on the market!

NZDCAD Bearish Idea (H4 Timeframe)CAD seem to gather some strength today, as far as NZDCAD goes any price close below 0.8990 is going to be a clear indication of bearish movement!

NZDCAD: SELL SIGNAL ENTRYLooking for 40-60 PIPS Opportunity
do your own risk.
If you like this idea, Give thumbs up and leave comment below
Appreciate it!!!

Nzd/cad
We will start dumping soon, this movement will be slow and slow and it will take some time
what is your opinion?

NZD/CAD SHORT TRADE IDEANZD/CAD Signal
Market Sell: 0.90000
Stop-Loss: 0.90600
Target 1: 0.89300
Target 2: 0.88200
Stop-Loss: 60 pips
Risk: 0,5%
Risk-Reward: 3.0

NZDCAD { WITH SNIPER ENTRY}Starting from the daily the price has broken the structure to the downside meaning we are bearish ,
NZDCAD SHORT STOP 0.88975don't trade before SELL stop, if you get 20 to 30 pips kindly close, its good for investment 2% risks.
if you wanna more pips fully risks for yours.
we are only try to hit baby pips if you like this analysis, please support our idea by hitting the like button and share to your frnz. we will support start to end trading
have a great trading!

NDZCAD H4 SHORT ANALYSIS NZDCAD Is at the resistance zone with RSI at over sold I'm currently expecting bears to come in and push the price lower . Watchout and trade with confirmation. Kindly like and follow for more chart setup updates.

NZDCAD SELL This pair has been on this range since the start of July and now we are looking to once more test it’s resistance, the resistance between 0.88600 and 0.88800 its pretty strong and as soon as we have a candle try and break the resistance but close back inside we can short it for a good trade, we can look for 180 pips. If the 4hr candle does close above the resistance we don’t enter a trade since it might run for the upside, in that situation of a close above resistance we might want to test a sell stop at 0.88500.

Strong Resistance for NZD/CADAfter getting rejected by the strong resistance at 0.88500 we can expect the price to go in a downward direction to touch the bullish trendline as drawn by me or the targets shown by the Fibonacci retracement only if today's candle ends up closing in the red.
And don't forget to apply a stop loss while trading, so keep an eye on the economic calendar because any unfavorable news related to NZD/CAD will lose a trade.
DYOR/FOMO
HAPPY TRADING!


NZDCAD [H4] Price is still Swing H/L Sideway 🔥🔥NZDCAD Price is still Swing H/L Sideway, so think when price goes up to test resistance.
will have a comeback Resistance is about 0.886 - 0.888.
When the price touches this zone, it is recommended to sell in that area.
SL above resistance
Goodluck Trader
TonTrader | TamjaiTrader
😎😎😎😎😎😎


💡 NZD/CAD potential short opportunityHi traders. This pair is looking bearish, It has respected the downtrend and created a double top. If we can break below i'll be waiting for a retest of the structure to go short.
NZDCAD - STRONG DUMP BACK TO LOWS!In this video I explain the reasons why I expect to see a potential move back down to lows and two potential opportunities to get involved with this move and trade it successfully.
Thanks for watching :)
Comment below what you think!

NZDCAD SELL Selling this pair as the moving averages have crossed.
This trade is long term minimum 1 week.
Most probably will go negative without hiting SL and confident tp will be hit

NZD / JPYIf you reach our support range, be ready to buy
The price has reached the bottom of the channel

NZDCAD FISCAL OR MONETARY POLICY TECHNIQUEPlease hit the like button and
🎁Leave a comment to support our team!
--Breakout-----
(1) Wait for a clear Descending triangle to form.
(2) Sell when price breaks the triangle low.
(3) Stop Abouve the previous High.
(4) Target 1 Is the Distance Between The Mouth Of The Triangle Added To The Breakout.
(5) Target 2 is a 100% extension of the first impulse move.
-----PullBack-----
(1) Wait for a clear Descending triangle to form.
(2) Wait for price to break and close below triangles low.
(3) Sell pullback at the broken lows.
(4) Stop Abouve previous High.
(5) Target 1 Is the Distance Between The Mouth Of The Triangle Added To The Breakout.
(6) Target 2 is a 100% extension of the first impulse move.
RISK DISCLAIMER:
Trading Futures , Forex, CFDs and Stocks involves a risk of loss.
Please consider carefully if such trading is appropriate for you.
Past performance is not indicative of future results.
Always limit your leverage and use tight stop loss.

10 August: NZDCAD could see a reversal here Hi everyone, NZDCAD is seeing limited upside before it reaches resistance at 0.88390, in line with the 61.8% retracement. A reversal below this level could see a further downside to our next support target, in line with the 127.2% extension.

NZDCAD ShortGoing up a little and then goes down, sorry not in the mood to say much about it I'm so tired but this is my analysis.
