Bullish bounce off?The NZD/CHF is falling towards the support level, which serves as a pullback support that aligns with the 38.2% Fibonacci retracement and could potentially rise from this level to our take-profit target.
Entry: 0.47911
Why we like it:
There is a pullback support that aligns with the 38.2% Fibonacci retracement.
Stop loss: 0.47375
Why we like it:
There is a multi-swing low support.
Take profi: 0.48872
Why we like it:
There is a pullback resistance that is slightly below the 78.6% Fibonacci retracement.
Enjoying your TradingView experience? Review us!
Please be advised that the information presented on TradingView is provided to Vantage (‘Vantage Global Limited’, ‘we’) by a third-party provider (‘Everest Fortune Group’). Please be reminded that you are solely responsible for the trading decisions on your account. There is a very high degree of risk involved in trading. Any information and/or content is intended entirely for research, educational and informational purposes only and does not constitute investment or consultation advice or investment strategy. The information is not tailored to the investment needs of any specific person and therefore does not involve a consideration of any of the investment objectives, financial situation or needs of any viewer that may receive it. Kindly also note that past performance is not a reliable indicator of future results. Actual results may differ materially from those anticipated in forward-looking or past performance statements. We assume no liability as to the accuracy or completeness of any of the information and/or content provided herein and the Company cannot be held responsible for any omission, mistake nor for any loss or damage including without limitation to any loss of profit which may arise from reliance on any information supplied by Everest Fortune Group.
NZDCHF

NZDCHF is in the Bearish Side due to Bearish TrendHello Traders
In This Chart NZDCHF HOURLY Forex Forecast By FOREX PLANET
today NZDCHF analysis 👆
🟢This Chart includes_ (NZDCHF market update)
🟢What is The Next Opportunity on NZDCHF Market
🟢how to Enter to the Valid Entry With Assurance Profit
This CHART is For Trader's that Want to Improve Their Technical Analysis Skills and Their Trading By Understanding How To Analyze The Market Using Multiple Timeframes and Understanding The Bigger Picture on the Chart

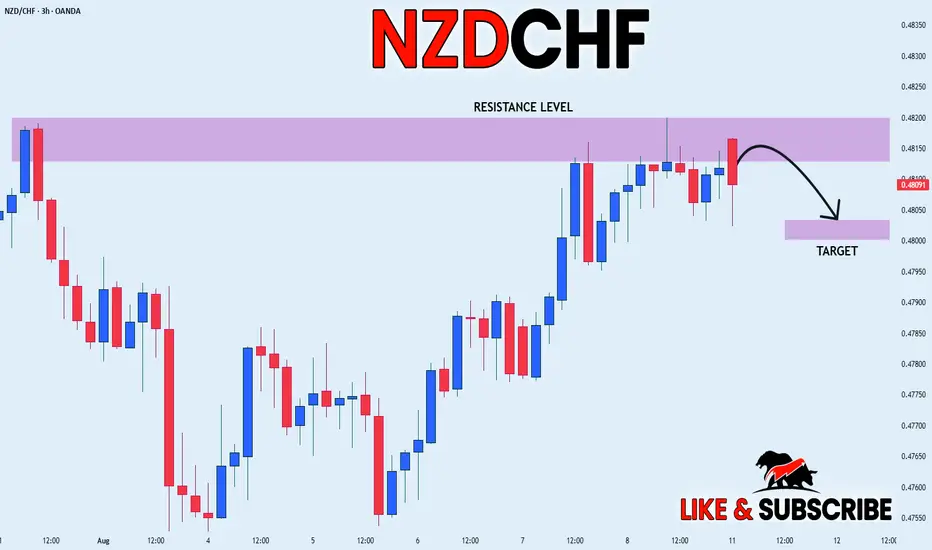
NZD_CHF WILL FALL|SHORT|
✅NZD_CHF price went up sharply
But a strong resistance level was hit at 0.4820
Thus, as a pullback is already happening
And a move down towards the target of 0.4803 shall follow
SHORT🔥
✅Like and subscribe to never miss a new idea!✅
NZD-CHF Short From Resistance! Sell!
Hello,Traders!
NZD-CHF is trading in a
Strong uptrend and the pair
Made a retest of the horizontal
Resistance level of 0.4820
From where we are already
Seeing a pullback so a further
Correction is to be expected
Sell!
Comment and subscribe to help us grow!
Check out other forecasts below too!
Disclosure: I am part of Trade Nation's Influencer program and receive a monthly fee for using their TradingView charts in my analysis.

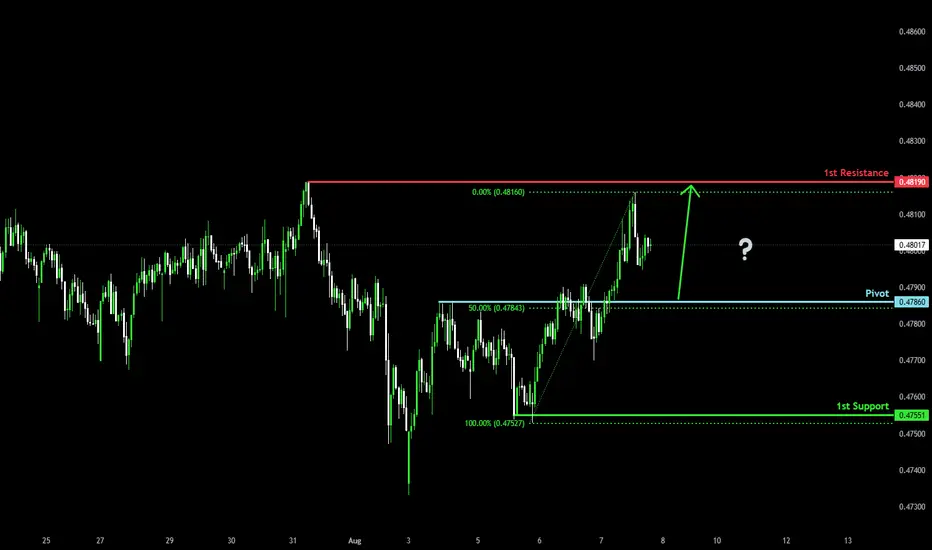
Bullish bounce offNZD/CHF is falling towards the pivot which acts as a pullback support that lines up with the 50% Fibonacci retracement and could bounce to the 1st resistance, which has been identified as a swing high resistance.
Pivot: 0.47860
1st Support: 0.47551
1st Resistance: 0.48190
Risk Warning:
Trading Forex and CFDs carries a high level of risk to your capital and you should only trade with money you can afford to lose. Trading Forex and CFDs may not be suitable for all investors, so please ensure that you fully understand the risks involved and seek independent advice if necessary.
Disclaimer:
The above opinions given constitute general market commentary, and do not constitute the opinion or advice of IC Markets or any form of personal or investment advice.
Any opinions, news, research, analyses, prices, other information, or links to third-party sites contained on this website are provided on an "as-is" basis, are intended only to be informative, is not an advice nor a recommendation, nor research, or a record of our trading prices, or an offer of, or solicitation for a transaction in any financial instrument and thus should not be treated as such. The information provided does not involve any specific investment objectives, financial situation and needs of any specific person who may receive it. Please be aware, that past performance is not a reliable indicator of future performance and/or results. Past Performance or Forward-looking scenarios based upon the reasonable beliefs of the third-party provider are not a guarantee of future performance. Actual results may differ materially from those anticipated in forward-looking or past performance statements. IC Markets makes no representation or warranty and assumes no liability as to the accuracy or completeness of the information provided, nor any loss arising from any investment based on a recommendation, forecast or any information supplied by any third-party.
NZDCHF; Heikin Ashi Trade Idea📈 Hey Traders!
Here’s a fresh outlook from my trading desk. If you’ve been following me for a while, you already know my approach:
🧩 I trade Supply & Demand zones using Heikin Ashi chart on the 4H timeframe.
🧠 I keep it mechanical and clean — no messy charts, no guessing games.
❌ No trendlines, no fixed sessions, no patterns, no indicator overload.
❌ No overanalyzing market structure or imbalances.
❌ No scalping, and no need to be glued to the screen.
✅ I trade exclusively with limit orders, so it’s more of a set-and-forget style.
✅ This means more freedom, less screen time, and a focus on quality setups.
✅ Just a simplified, structured plan and a calm mindset.
💬 Let’s Talk:
💡 Do you trade supply & demand too ?
💡What’s your go-to timeframe ?
💡Ever tried Heikin Ashi ?
📩 Got questions about my strategy or setup? Drop them below — ask me anything, I’m here to share.
Let’s grow together and keep it simple. 👊
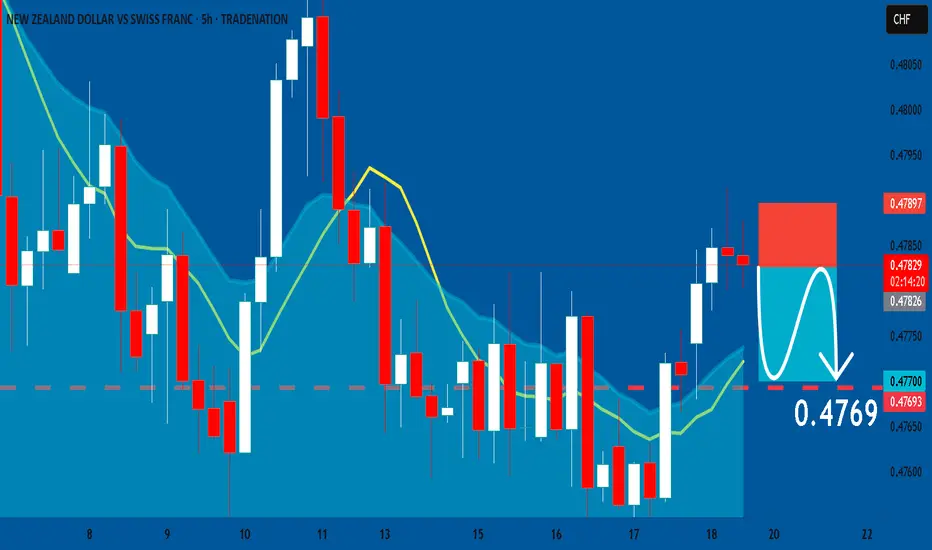
NZD/CHF BEST PLACE TO SELL FROM|SHORT
NZD/CHF SIGNAL
Trade Direction: short
Entry Level: 0.479
Target Level: 0.477
Stop Loss: 0.481
RISK PROFILE
Risk level: medium
Suggested risk: 1%
Timeframe: 6h
Disclosure: I am part of Trade Nation's Influencer program and receive a monthly fee for using their TradingView charts in my analysis.
✅LIKE AND COMMENT MY IDEAS✅

NZDCHF Forming Bullish ContinuationNZDCHF has been consolidating above a well-defined support zone near the 0.4720–0.4750 region, as seen clearly on the 12H chart. Price has reacted multiple times to this demand area, forming a potential accumulation base. Recent candlestick structure is signaling rejection of lower prices, with buyers stepping in and building pressure for a potential breakout to the upside.
From a macro perspective, the New Zealand dollar is showing signs of resilience despite softening economic data, while the Swiss franc remains fundamentally strong due to its safe-haven status. However, as risk sentiment improves globally and commodity currencies gain traction, NZD is finding support. The Reserve Bank of New Zealand is expected to maintain a cautious but neutral stance in upcoming meetings, while the Swiss National Bank has surprised markets recently by signaling a more dovish outlook, which could weigh on CHF in the short term.
The chart setup provides a clean risk-to-reward ratio with a tight invalidation below the demand zone. If price sustains above 0.4780, a breakout toward 0.4910–0.4950 is on the table, offering a high-probability bullish continuation setup. The market structure shift with higher lows and rejection wicks is giving early signs of reversal momentum. This makes NZDCHF a compelling candidate for buyers looking to position ahead of a potential breakout.
In the current market environment, where central bank tone shifts and risk-on sentiment are reshaping currency flows, pairs like NZDCHF are key to watch. This setup is not only technically clean but also aligns with the broader narrative of CHF softening and NZD stabilization. Patience and confirmation will be critical, but this pair is shaping up to deliver a solid upside opportunity.

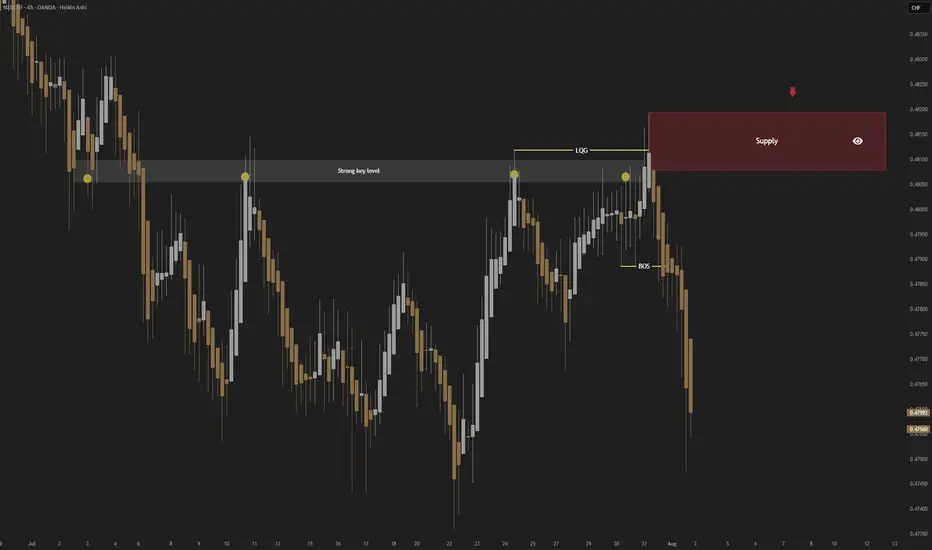
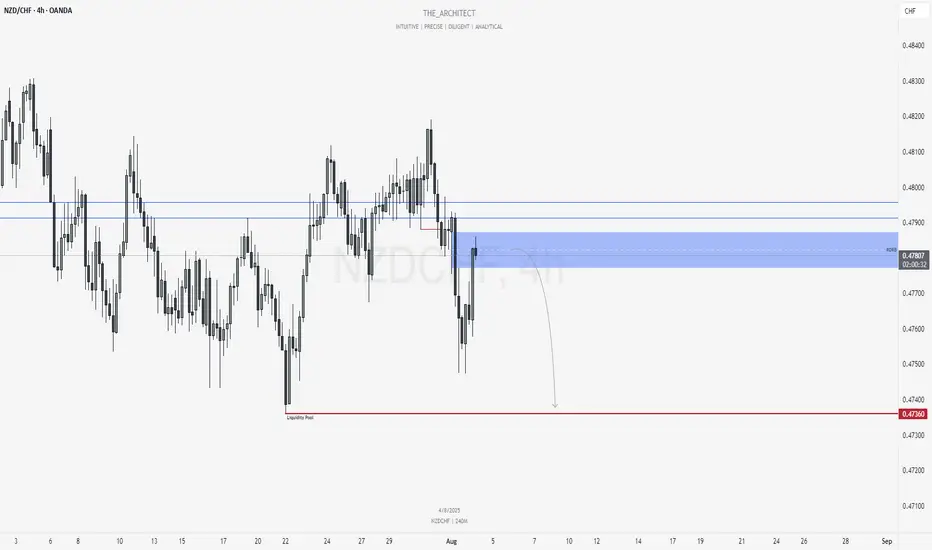
NZDCHF: Selling Within Bearish Order Flow & Order BlockGreetings Traders,
In today’s analysis of NZDCHF, recent price action confirms the presence of bearish institutional order flow. As a result, we aim to align ourselves with this directional bias by identifying strategic selling opportunities.
🔍 Key Observations on H4:
Bearish Market Structure Shift
The H4 timeframe has confirmed a bearish shift in market structure, giving us a solid framework to seek short setups aligned with institutional momentum.
Bearish Order Block
Price has recently reached a bearish order block, expected to act as a strong resistance zone for potential downside continuation.
Liquidity Engineering
Buy stops on H4 have been taken out—this sweep may be used to order the pair against liquidity, favoring bearish continuation.
📈 Trading Plan:
Entry Strategy
Monitor lower timeframes (e.g., M15 and below) for bearish confirmation setups within or near the bearish order block.
Target Objective
Our draw on liquidity remains the liquidity pool located at deeper discount levels, in alignment with the prevailing short bias.
For a detailed market walkthrough and in-depth execution zones, be sure to watch this week’s Forex Market Breakdown:
Stay disciplined, trust your confirmations, and manage your risk wisely.
Kind regards,
The Architect 🏛️📉
NZDCHF: Bullish Continuation is Highly Probable! Here is Why:
Remember that we can not, and should not impose our will on the market but rather listen to its whims and make profit by following it. And thus shall be done today on the NZDCHF pair which is likely to be pushed up by the bulls so we will buy!
Disclosure: I am part of Trade Nation's Influencer program and receive a monthly fee for using their TradingView charts in my analysis.
❤️ Please, support our work with like & comment! ❤️

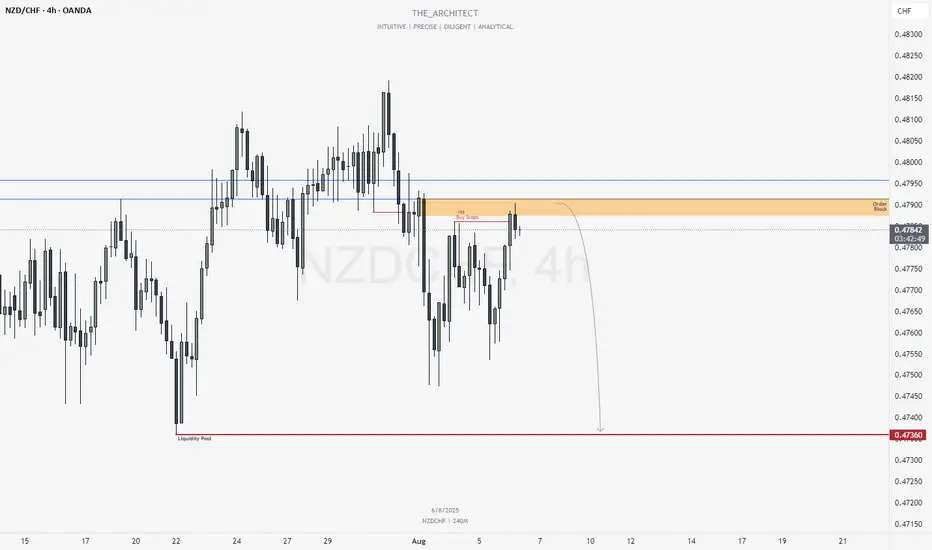
NZDCHF: Bearish Continuation from Re-Delivered Re-Balanced ArrayGreetings Traders,
In today’s analysis of NZDCHF, recent price action confirms the presence of bearish institutional order flow. As a result, we aim to align ourselves with this directional bias by identifying strategic selling opportunities.
Key Observations on H4:
Bearish Market Structure Shift: The H4 timeframe has recently confirmed a bearish shift in market structure, providing us with a clear framework to seek short setups in line with institutional momentum.
RDRB Resistance Zone: Price has retraced into a Re-Delivered Re-Balanced (RDRB) array—an area where prior institutional selling took place and has now been re-engaged. This region is expected to serve as resistance, offering a high-probability zone for confirmation entries to the downside.
Trading Plan:
Entry Strategy: Monitor lower timeframes (M15 and below) for bearish confirmation setups within the RDRB array.
Target Objective: The current draw on liquidity remains the liquidity pool residing at deeper discount levels, which aligns with our short bias.
For a detailed market walkthrough and in-depth execution zones, be sure to watch this week’s Forex Market Breakdown:
As always, stay disciplined, wait for clear confirmations, and manage your risk responsibly.
Kind regards,
The Architect 🏛️📉
NZD-CHF Risky Long! Buy!
Hello,Traders!
NZD-CHF keeps falling and
Will hit the horizontal support
Of 0.4738 on Monday from
Where we will be expecting
A local rebound and a
Bullish move up
Buy!
Comment and subscribe to help us grow!
Check out other forecasts below too!
Disclosure: I am part of Trade Nation's Influencer program and receive a monthly fee for using their TradingView charts in my analysis.

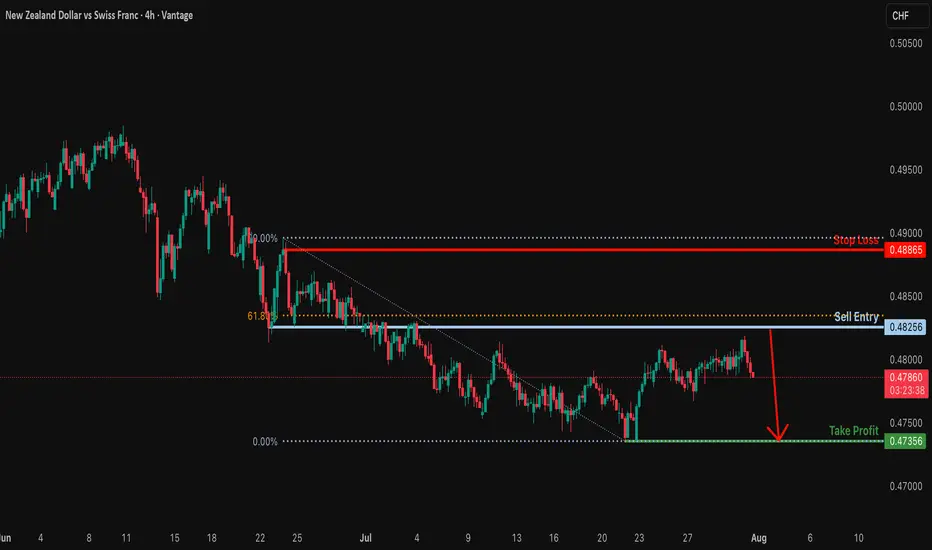
Bearish drop?The NZD/CHF is rising towards the resistance level, which is a pullback resistance that is slightly below the 61.8% Fibonacci retracement. It could drop from this level to our take-profit.
Entry: 0.48256
Why we like it:
There is a pullback resistance that is slightly below the 61.8% Fibonacci retracement.
Stop loss: 0.48865
Why we like it:
There is a pullback resistance.
Take profit: 0.47356
Why we like it:
There is a swing low support.
Enjoying your TradingView experience? Review us!
Please be advised that the information presented on TradingView is provided to Vantage (‘Vantage Global Limited’, ‘we’) by a third-party provider (‘Everest Fortune Group’). Please be reminded that you are solely responsible for the trading decisions on your account. There is a very high degree of risk involved in trading. Any information and/or content is intended entirely for research, educational and informational purposes only and does not constitute investment or consultation advice or investment strategy. The information is not tailored to the investment needs of any specific person and therefore does not involve a consideration of any of the investment objectives, financial situation or needs of any viewer that may receive it. Kindly also note that past performance is not a reliable indicator of future results. Actual results may differ materially from those anticipated in forward-looking or past performance statements. We assume no liability as to the accuracy or completeness of any of the information and/or content provided herein and the Company cannot be held responsible for any omission, mistake nor for any loss or damage including without limitation to any loss of profit which may arise from reliance on any information supplied by Everest Fortune Group.
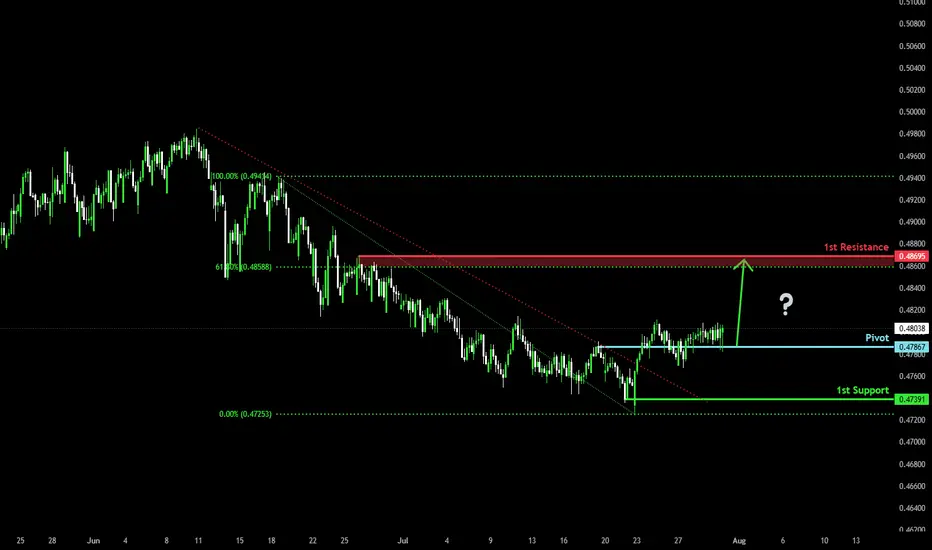
Bullish bounce?NZD/CHF is reacting off the pivot, which is a pullback support and could rise to the 1st resistance.
Pivot: 0.47867
1st Support: 0.47391
1st Resistance: 0.48695
Risk Warning:
Trading Forex and CFDs carries a high level of risk to your capital and you should only trade with money you can afford to lose. Trading Forex and CFDs may not be suitable for all investors, so please ensure that you fully understand the risks involved and seek independent advice if necessary.
Disclaimer:
The above opinions given constitute general market commentary, and do not constitute the opinion or advice of IC Markets or any form of personal or investment advice.
Any opinions, news, research, analyses, prices, other information, or links to third-party sites contained on this website are provided on an "as-is" basis, are intended only to be informative, is not an advice nor a recommendation, nor research, or a record of our trading prices, or an offer of, or solicitation for a transaction in any financial instrument and thus should not be treated as such. The information provided does not involve any specific investment objectives, financial situation and needs of any specific person who may receive it. Please be aware, that past performance is not a reliable indicator of future performance and/or results. Past Performance or Forward-looking scenarios based upon the reasonable beliefs of the third-party provider are not a guarantee of future performance. Actual results may differ materially from those anticipated in forward-looking or past performance statements. IC Markets makes no representation or warranty and assumes no liability as to the accuracy or completeness of the information provided, nor any loss arising from any investment based on a recommendation, forecast or any information supplied by any third-party.
NZDCHF is in the Bearish Side due to Bearish TrendHello Traders
In This Chart NZDCHF HOURLY Forex Forecast By FOREX PLANET
today NZDCHF analysis 👆
🟢This Chart includes_ (NZDCHF market update)
🟢What is The Next Opportunity on NZDCHF Market
🟢how to Enter to the Valid Entry With Assurance Profit
This CHART is For Trader's that Want to Improve Their Technical Analysis Skills and Their Trading By Understanding How To Analyze The Market Using Multiple Timeframes and Understanding The Bigger Picture on the Chart

NZD/CHF SHORT FROM RESISTANCE
Hello, Friends!
NZD/CHF pair is trading in a local uptrend which we know by looking at the previous 1W candle which is green. On the 12H timeframe the pair is going up too. The pair is overbought because the price is close to the upper band of the BB indicator. So we are looking to sell the pair with the upper BB line acting as resistance. The next target is 0.473 area.
Disclosure: I am part of Trade Nation's Influencer program and receive a monthly fee for using their TradingView charts in my analysis.
✅LIKE AND COMMENT MY IDEAS✅

NZDCHF – Bullish Breakout Sets Stage for ReversalNZDCHF has broken decisively out of a long-term descending channel, signaling a potential trend reversal. Price action confirmed multiple bullish flags within the falling structure, followed by a clean breakout and higher low retest, supporting a bullish continuation bias.
Currently, the pair is stabilizing just above prior resistance turned support around 0.4760–0.4780, forming a potential launchpad for the next leg higher.
Upside Targets:
TP1: 0.48336
TP2: 0.48844
TP3: 0.49319
Invalidation Zone:
A drop below 0.4720 would invalidate the breakout structure and expose the downside.
Fundamental Drivers:
🇳🇿 NZD Strength: RBNZ remains relatively hawkish compared to other central banks, and the Kiwi may gain from improving risk sentiment and easing global recession fears.
🇨🇭 CHF Weakness: Swiss Franc is under mild pressure as safe-haven flows weaken amid improving tone on US-China-EU trade headlines and fading ECB rate cut bets.
🗓️ Macro Flow: Upcoming risk events (Fed comments, trade updates, and NZ economic prints) could inject momentum into the pair, especially if risk appetite improves.
Bias: ✅ Bullish (Buy)
Confidence: ★★★★☆
Watch for: Clean hold above 0.4770 zone + bullish momentum continuation.

NZDCHF is in the Bearish Side due to Bearish TrendHello Traders
In This Chart NZDCHF HOURLY Forex Forecast By FOREX PLANET
today NZDCHF analysis 👆
🟢This Chart includes_ (NZDCHF market update)
🟢What is The Next Opportunity on NZDCHF Market
🟢how to Enter to the Valid Entry With Assurance Profit
This CHART is For Trader's that Want to Improve Their Technical Analysis Skills and Their Trading By Understanding How To Analyze The Market Using Multiple Timeframes and Understanding The Bigger Picture on the Chart

NZD-CHF Local Bearish Bias! Sell!
Hello,Traders!
NZD-CHF made a retest of
The horizontal resistance
of 0.4810 so we are locally
Bearish biased and we
Will be expecting a
Further bearish move down
Sell!
Comment and subscribe to help us grow!
Check out other forecasts below too!
Disclosure: I am part of Trade Nation's Influencer program and receive a monthly fee for using their TradingView charts in my analysis.

NZDCHF - Follow the Bears!Hello TradingView Family / Fellow Traders. This is Richard, also known as theSignalyst.
📈NZDCHF has been overall bearish , trading within the falling orange channel and it is currently retesting the upper bound of the channel.
Moreover, it is rejecting a structure marked in blue.
📚 As per my trading style:
As #NZDCHF is around the red circle zone, I will be looking for trend-following sell setups on lower timeframes. (like a double top pattern, trendline break , and so on...)
📚 Always follow your trading plan regarding entry, risk management, and trade management.
Good luck!
All Strategies Are Good; If Managed Properly!
~Rich
Disclosure: I am part of Trade Nation's Influencer program and receive a monthly fee for using their TradingView charts in my analysis.

NZDCHF: Will Keep Falling! Here is Why:
The recent price action on the NZDCHF pair was keeping me on the fence, however, my bias is slowly but surely changing into the bearish one and I think we will see the price go down.
Disclosure: I am part of Trade Nation's Influencer program and receive a monthly fee for using their TradingView charts in my analysis.
❤️ Please, support our work with like & comment! ❤️
NZDCHF Will Move Lower! Sell!
Please, check our technical outlook for NZDCHF.
Time Frame: 4h
Current Trend: Bearish
Sentiment: Overbought (based on 7-period RSI)
Forecast: Bearish
The market is approaching a key horizontal level 0.475.
Considering the today's price action, probabilities will be high to see a movement to 0.472.
P.S
The term oversold refers to a condition where an asset has traded lower in price and has the potential for a price bounce.
Overbought refers to market scenarios where the instrument is traded considerably higher than its fair value. Overvaluation is caused by market sentiments when there is positive news.
Disclosure: I am part of Trade Nation's Influencer program and receive a monthly fee for using their TradingView charts in my analysis.
Like and subscribe and comment my ideas if you enjoy them!

NZD_CHF RISKY LONG|
✅NZD_CHF has retested a key support level of 0.4760
And as the pair is already making a bullish rebound
A move up to retest the supply level above at 0.4776 is likely
LONG🚀
✅Like and subscribe to never miss a new idea!✅
Disclosure: I am part of Trade Nation's Influencer program and receive a monthly fee for using their TradingView charts in my analysis.
