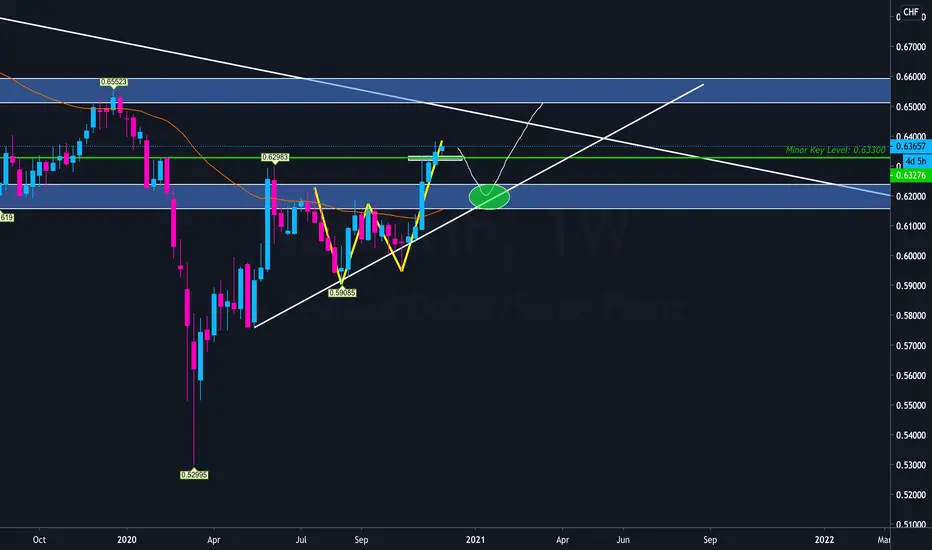
NZDCHF | Perspective for the new weekTwo Bullish engulfing candles saw price broke out of a key level @ Fr0.62950 on Wednesday to set the stage for an opportunity to go long as price settles back into this level for momentum.
Tendency: Uptrend ( Bullish )
Structure: Breakout | Supply & Demand
Observation: i. Bullish Trendline: A visual representation of support level as the line is drawn under pivot lows showing the prevailing direction of price.
ii. Decline in price that began in Nov. 2020 found bottom @ Fr0.62330 to initiate a reversal structure that led to Breakout of Fr0.62950.
iii. the expectation of an "AB = CD pattern" shall be a guide in the coming week.
iv. ABCD pattern parameters explained below;
a. Impulse A-to-B is expected to be in harmony with the potential C-to-D leg.
b. The B- to-C leg is at 61.8% currently (with a possible 78.6% in the future) Fibonacci retracement of the A-to-B leg.
c. The C-to-D leg is expected to fall within 127.2 - 1.414% Fib. ext. of the A-to-B move.
Trading plan: BUY confirmation with a minimum potential profit of 80 pips.
Risk/Reward : 1:4
Potential Duration: 1 to 4 days
NB: This speculation can be considered to make decisions on lower timeframes.
Watch this space for updates as price action is been monitored.
Risk Disclaimer:
Margin trading in the foreign exchange market (including foreign exchange trading, CFDs, etc.) has a high risk and is not suitable for all investors. The content of this speculation (including all data) is organized and published by me for the sole purpose of education and assistance in making independent investment decisions. All information herein is for your reference only and I take no responsibility.
You are hereby advised to carefully consider your investment experience, financial situation, investment objective, risk tolerance level, and consult your independent financial adviser as to the suitability of your situation prior to making any investment.
I do not guarantee its accuracy and is not liable for any loss or damage which may result directly or indirectly from such content or the receipt of any instruction or notification therewith.
Past performance is not necessarily indicative of future results.
Nzdchfanalysis


NZDCHF uptrend setupprice direction: UPTREND
potential target price: 0.6309
**Disclaimer** the content on this analysis is subject to change at any time without notice, and is provided for the sole purpose of assisting traders to make independent investment decisions.
Traders!! if you like my ideas and do take the same trade as I do, please write it in a comment so we can manage the trade together.
_____________________________________________________________________________________________________________________
Thank you for your support ;)
GWBFX


NZDCHF Buy Limit NZDCHF has created a new high after consolidating so far this week. Buy limit has been placed at previous resistance (0.62643). If this level can hold has support, I'll look to continue buying this market until it approaches 0.63300 area.

NZDCHF - short entry on the breakout of the bearish flagThis pair is at the top of H4 TF Rising Wedge Structure. While reaching this top area, it form another corrective rising wedge structure in H1 TF.
Its now breaking below the Risin wedge in H1, and forming bearich continuation flag pattern. I enter short entry on this pair on the break of the flag, with sl above tha flag, targetting to at least to the bottom area of h4 rising wedge structure at 0.60500.
Lets see how will this one play out. Good luck


POTENTIAL SHORT ON NZDCHF AFTER PULLBACKNZDCHF is showing further bearish potential. It’s moving to a somewhat solid point of support from which we may see price pullback to the marked region.
We may see price move bullish retest and then further move bearish.

NZDCHF Top-Down AnalysisHello Traders,
Here is the Top-Down Analysis of NZDCHF (Monthly, Weekly, Daily for direction and 4H for entry) for
Week 49 - Dec 02
M > Market is respecting downward resistance trend-line, price is approaching to test the trend-line. From there we can expect a rejection to the downside.
W > We can see two W patterns and their neck will be Short targets. Price is currently testing weekly supply zone.
D > Price has decelerated and rejection to downside is building up. Bearish divergence can be seen suggesting correction to the downside.
As per COT NZD further added both Long and Short bringing Long to the highest for the year, ZXY has gained strength all of November, it is now testing a major resistance level. We can expect some correction to the downside for NZD. CHF saw addition of both Long and Short. SXY recovered slightly during the said period and it further strengthened last week.
4H > Price has been consolidating at current level for over a week, price can move up for a last final attempt to break the consolidation before making a downward move.
Pair Correlation > NZDCHF has positive correlation with NZDCAD, NZDUSD, NZDJPY and GBPCHF negative correlation with EURNZD and GBPNZD.
This was my Idea and I hope you find it useful. If you find the analysis of help please leave a LIKE and FOLLOW for receiving all updates during the week. In the comment section share your view or ask questions.
Thank You
AP17FX

NZDCHF Potential Short IdeaNZDCHF has broken above previous resistance and created a new HH, I'll be waiting for this market to show evidence of a switch bullish momentum to take shorts on the retracement move. My first target will be 0.61900, 2nd target will be 0.61100. This market still has the potential to push up to the 0.65000 from this current level and if that happens, we can expect price to potentially reject this area to create a larger retracement.
📢NZD/CHF Short opportunity This pair is looking bearish, hoping to jump in on the continuation soon 👍


NZDCHF sellPlease like, comment and follow.
Waiting for price to break the support level and ascending trend line to confirm the sell

NZDCHFNZDCHF formed an ascending triangle formation and broke the previous structure high to create a higher high. A rejection of the previous high as support may increase buying in this market to create another higher high. However, if we get a daily close back below previously broken resistance and break the previous H4 HL, shorts will come into play. This market is also showing an extreme RSI overbought condition based on the daily timeframe.

NZDCHF long trade ideaPlan: wait for the price to bounce off from trendline or support level --> wait for the rejection candle pattern to form e.g. bullish engulfing, pinbar, etc --> BUY
**Disclaimer** the content on this analysis is subject to change at any time without notice, and is provided for the sole purpose of assisting traders to make independent investment decisions.
Traders!! if you like my ideas and do take the same trade as I do, please write it in a comment so we can manage the trade together.
_____________________________________________________________________________________________________________________
Thank you for your support ;)
GWBFX

NZDCHF SELLThis is NZDCHF 4H timeframe analysis, i'm expecting the market to start selling from where it is at a moment.

NzdChf- to "see"0.65?Since the March low, NzdChf traded upwards and now is trading above 0.63 resistance
More important is that the pair seems to press on short term resistance and a break looks imminent.
In this case, the pair have a clear road to 0.65 zone
The medium-term trend is clearly bullish now and only a drop and close under 0.62 would alter this

NZDCHF SellConfirmations:
1. HTF showing signs of bullish exhaustion
2. Counter Trend break (H1)
3. Break of Support
4. Strong Bearish Candle after counter trendline and support break

NZDCHF Sell TRADE IDEA. Please manage your risk. Use Stop loss. And do not take blind entries.
If you have a question let me know. If you want to analyze any pair let me know.
This is just an idea. What we see.
The Market can go in the opposite direction, what we analyze. So we have to manage our risk and adopt the situation accordingly.


📢NZD/CHF Possible long setup formingWe have a nice clean break here. As long as the candle can close above we can expect a continuation 0.64500

NzdChf- 0.61+ tells a storyThe long-term trend for NzdChf is bearish and after recovering from this spring lows the pair is ready to resume its downwards trajectory.
Last week NzdChf tried to reconquer 0.61 but without success and we have 4 longtailed candles in this zone (2 being clear pin bars)
I favor short positions with a SL above 0.6160, as for target 0.5950 support could be a good place for TP
