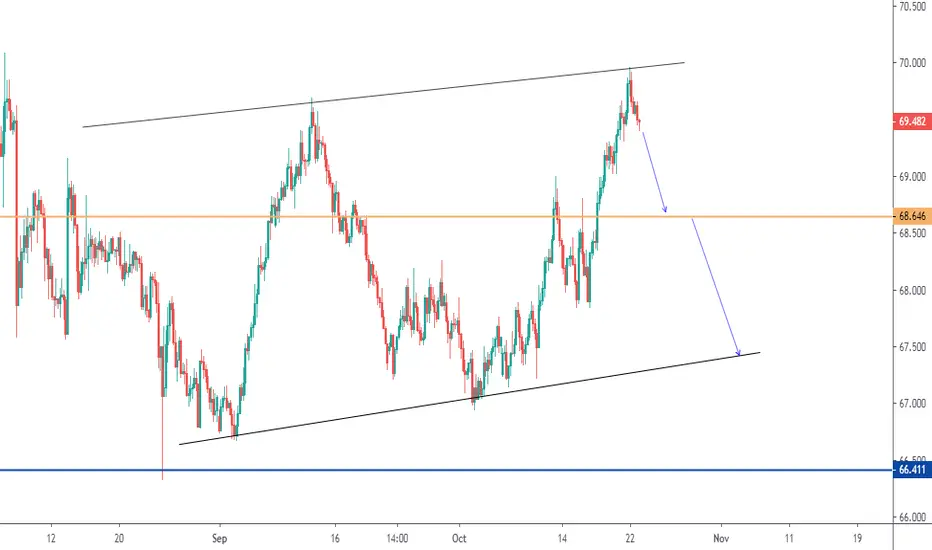
NZDJPY Analysis: Price bounced from falling channel resistanceIt now looks clear that a falling channel is forming.
Price may drop further towards the support line of the structure.
Nzdjpyanalysis

NZDJPY Analysis: Price may fallThe pair formed a triangle structure which is nearly coming to an end.
I see a high possibility of the triangle breaking from the lower side.
You can wait for the structure to break and go short if it manage to break it from below.

NZDJPY Analysis: Price may fallHi traders,
This pair is following a falling channel and price has come to test the resistance line.
You may wait for more confirmations and sell if the price doesn't manage to break out.

NZDJPY 240MHello traders,
this long trade is for 40 pips, stop at -20.
Looking for a continuation of daily momentum.
Best,
Jay

NZDJPY SellNZDJPY Sell
**Disclaimer**
the content on this analysis is subject to change at any time without notice, and is provided for the sole purpose of assisting traders to make independent investment decisions.
_________________________________________________________________________________________________________________________________________
Thank you for your support!
Tradewithsam


NZDJPY 1H SellNZDJPY 1H Sell
**Disclaimer**
the content on this analysis is subject to change at any time without notice, and is provided for the sole purpose of assisting traders to make independent investment decisions.
_________________________________________________________________________________________________________________________________________
Thank you for your support!
Tradewithsam

NZDJPY 15MHello traders!
This is a Tag&Go setup short, a sell stop order,
set and forget style is right on the red line at
69.415
The red circle is the stop and 1st and 2nd
targets are in green below.
Best,
Jay

NZDJPY 15MHello traders!
This is a Tag&Go setup short, a sell stop order,
set and forget style is right on the red line at
69.580
The red circle is the stop and 1st and 2nd
targets are in green below.
Best,
Jay


NZD/JPY SHORTNZD/JPY SELL limit
ENTRY 1 69.863
ENTRY 2 69.924
sl 70.039
TP.1 69.620
TP.2 69.340
TP.3 69.024

NZDJPY Analysis> Chart: H4
> Trendency: Up
> TrendLine broken
> Price stuck in an area.
> Waiting fot break the Support Line.


ANALYSIS ON NZDJPYANALYSIS ON NZDJPY
Welcome to my analysis
-
30Min CHart
-
Interesting Point of interest In the NZDJPY pair.
- Price above 200 day EMA.
- Buy reversal.
- Expecting more Upward momentum.
- Watch 70.100 for take profit.
Stay Tuned


NZDJPY approaching support, potential for a bounce!
NZDJPY is expected to drop to 1st support at 69.059 where it could potentially react off and up to 1st resistance at 69.675.
*Disclaimer.*
Trading leveraged products carries a high level of risk and may result in you losing substantially more than your initial investment. Pepperstone Group Limited is licensed and regulated by the Australian Securities and Investments Commission (AFSL 414530). Pepperstone Limited is authorised and regulated by the United Kingdom Financial Conduct Authority (FRN 684312). This information is not intended for distribution to, or use by, any person in any country or jurisdiction where such distribution or use would be contrary to local law or regulation.

NZD/JPY SHORT NZD/JPY SHORT (sell)
Sell NZD/JPY
Entry 68.800
Entry 2 68.920
Sl 69.120
Tp.1 68.460
Tp.2 68.210
Tp.3 67.900
ROUND 3 lets get it

NZD/JPY SHORT Round 2NZD/JPY Should do a bounce back to test Resistance one more time, where we are looking to short it once again
We will be using the same parameters as previous call yesterday
This time both are sell limits
NZD/JPY SELL LIMIT
Entry 68.650
Entry 2 68.800
sl 69.100
tp.1 68.350
tp.2 68.100
tp.3 67.900
Risk management please .01 or .02 for every 100

Counter Trend defined... NZDJPY Long trade setupPrice found support @67.5 making a Higher Low on the daily chart. I expect a Higher High from this point forward at least to the next historic Support/Resistance level @70.4 and maybe Price will flourish even higher close to 72.0 hitting the long term Down trend line.


