Nzdjpyidea


NZFJPY - LONG; BUY it up!!Like the title says.
Equities are likely to go for one, final, "blow off" Top, here. (but then, that's it!! Believe it.)
The Weekly;


NZD/JPY Bullish Wave LTFHi Traders
NZD/JPY Signal (H4 Timeframe)
A high probability, entry to go LONG has formed @ 76.186 after the market found support @ 75.781. Only the downward break of 75.781 would cancel this bullish scenario.
Trade details
Entry: 76.186
Stop loss: 75.781
Take profit 1: 77.260
Take profit 2: 78.190
Take profit 3: 79.706
Score: 10
Strategy: Bullish Wave - LTF

NZD/JPY Trading in Upward Channel.Hello traders, NZD/JPY is trading at 76.24. The price is trading in upward resistance and support channel and rebounding back from its resistance level. As the price has already rebound back from its resistance level, if it breaks 76.21 price level it can touch support level. So, the entry price for short will be 76.21 first target will be at 75.81 and second target at 75.20.
Follow proper risk management strategy to avoid unnecessary losses and to increase profitability, don't risk more than 2% of your capital on each trade.
Do follow us for future Forex trend analysis and Ideas.
Thank you,
Rishikesh Lilawat


NZDJPY, Approaching strong support zone, longNZDJPY, Approaching strong support zone that respected many times!


NZDJPY, Break out Significant Support, longNZDJPY, Break out Significant Support and has bullish Momentum!

Bearish Crab PatternNZDJPY BEARISH CRAB PATTERN
Hello Trader, This is a long term trade with a good risk to reward ratio on a daily timeframe.
Market Sell Order Set Up.
Sell Entry: (75.675)
Min Take-Profit: (73.087)
Max Take-Profit: (71.367)
Stop-Loss: (77.359)
Max Risk-Reward: (2.56)
Smash a Like button and leave a Comment, I appreciate every support. Goodluck.

NZDJPY long trade ideaPlan: wait for the price to bounce off from trendline or support level --> wait for the rejection candle pattern to form e.g. bullish engulfing, pinbar, etc --> BUY
**Disclaimer** the content on this analysis is subject to change at any time without notice, and is provided for the sole purpose of assisting traders to make independent investment decisions.
Traders!! if you like my ideas and do take the same trade as I do, please write it in a comment so we can manage the trade together.
_____________________________________________________________________________________________________________________
Thank you for your support ;)
GWBFX

Bearish Alt Bat Pattern
NZDJPY BEARISH ALT BAT PATTERN
Market Sell Order Set Up.
Sell Entry: (75.350)
Min Take-Profit: (74.694)
Max Take-Profit: (74.294)
Stop-Loss: (76.052)
Max Risk-Reward: (1.50)
Smash a Like button and leave a Comment, I appreciate every support. Goodluck.

Bearish Bat PatternNZDJPY BEARISH BAT PATTERN
Market Sell Order Set Up.
Sell Entry: (74.983)
Min Take-Profit: (74.490)
Max Take-Profit: (74.169)
Stop-Loss: (75.425)
Max Risk-Reward: (1.84)
Smash a Like button and leave a Comment, I appreciate every support. Goodluck.

NZDJPY Short (Sell) Trade Setup IdeaNZD has been showing great strength today and has raced into a fairly strong sell zone. Mind, there is a sell zone much stronger than this at around 75.4 but price has stalled and is reacting at this level. We're looking at price action for opportunities to short .

NZDJPY Short (Sell) Trade Setup IdeaNZDJPY is approaching a strong sell zone. We can see price previously reacted from this level quite dramatically. We're looking for potential shorts from here back to the support zone.

NZDJPY Short (Sell) Trade SetupNZDJPY has formed some really nice structure levels and is currently trending lower. We look for a pullback to the recent resistance level for an entry to short this pair back to support.

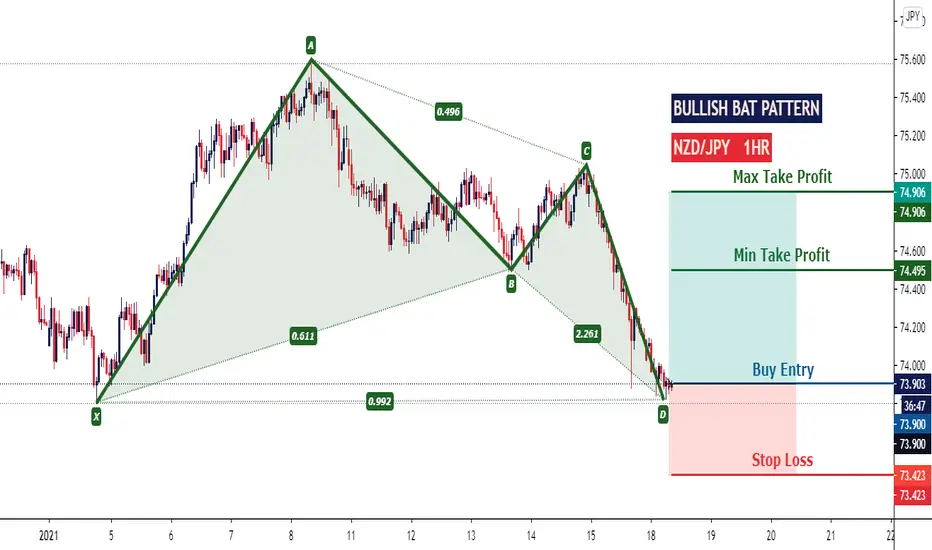
Bullish Bat PatternNZDJPY BULLISH BAT PATTERN
Market Buy Order Set Up.
Buy Entry: (73.900)
Min Take-Profit: (74.495)
Max Take-Profit: (74.906)
Stop-Loss: (73.423)
Max Risk-Reward: (2.11)
Smash a Like button and leave a Comment, I appreciate every support. Goodluck.
NZDJPY, Breakout Ascending Channel, LongNZDJPY, Breakout Ascending Channel and has a very good Support! Watch out Friends!

NZDJPY waiting for shortHi Traders,
This is our view on this cross for the next days.
#NZDJPY
SELL 74.7
SL 74.85
TP 74.27
We remind you that this is only a forecast based on what current data are.
Therefore the following signal will be activated only if the rules of our strategy are strictly respected.
Any updates will be given in the comment section below
———————————
Trading Kitchen

NZDJPY / LongI dont believe we are going to continue seeing a bullish move in the XXXJPY pairs.. Looking for rejections in this area
