NZDJPY Break and retest cycle will it reach 2020 high ?NZDJPY
*********
⏳Day chart
🎲 Detailed analysis
⛳️Bullish entry
—————-❇️——————-
Detailed analysis 💬
1️⃣ Notable break and retest happens twice
2️⃣ 71.630 Multi month highs strong support
3️⃣ Positive risk sentiment, Vaccine news
4️⃣ 72.00 Dynamic support and resistance
5️⃣73.600 acted as strong resistance-Key trend reversal area
6️⃣ 70.110 50% Fibonacci will Acted as strong support/Point of control coincidence
7️⃣ Technical support - Bullish
8️⃣ 73.600 will acted as key reversal-bearish
9️⃣ 2020 High will act as alternative bearish entry-Double top formation
🔟 Possible swing target-73.600
#️⃣ Overall long-term trend- Bullish
—————-❇️——————-
📉 Technical bias-Day-Bullish
Price is above 50,100,200 Exponential moving average
50,100 Exponential moving average will act as support-Bullish
Relative strength index - well above 60 - Bullish trend
MACD -Histogram is slowly fading towards red, Oscillators about to cross soon
Stochastic - Reached around 75- overbought condition will give a short term fall back expected
Ichimoku cloud -cloud is still green-Price is well above the cloud
Bollinger band- Price reached around the upper side of the band-Short term bearish correction towards middle band was expected
—————-✳️——————-
Key reversal area's
70.000 psychological level
70.110Point of control area Volume analysis
71.670 June,July,August month highs
69.000 Lower side of the recent consolidation phase
73.000 Major psychological level
73.660 Possible entry- Bear
73.660 Trendline resistance/Alternative Bearish entry
—————-✳️——————-
Bearish entry #yen #kiwi #nzdjpy
Entry price - 72.150
Take profit 01 - 72.800
Take profit 02 - 73.600
🚫 Stop lose 71.200
⬆️ 2.00 Growth expected
⤴️ Account growth 1: 2
✅ Risk reward ratio 1 : 2
—————-⚜️——————-
Push the like button , And cheer up if you found useful
Nzdjpysignal


NZDJPY SELL IDEAWhats sup traders I hope your having a great trading week, Currently looking at nzdjpy for a Sell as i think that the yen will get stronger than the nzd overtime Please let me know what you think about this pair.

NZDJPY Corrective SELL We spot a divergence at the last high of NZDJPY which gives us an opportunity to short the pair for the main time combined with our Elliot wave count.

NZDJPY - False level retestThe price is returned for retest level - the previous touch of the level more than 1 month ago. moreover, a strict namber of false breakdowns.
Thank you very much and thank you to the responsive commentators for their understanding.
I spend my personal time tracking the market situation and share my opinion openly with you.
Push like and write your comments. We will catch the best trades together!

NZDJPY Sell TRADE IDEA. Please manage your risk. Use Stop loss. And do not take blind entries.
If you have a question let me know. If you want to analyze any pair let me know.
This is just an idea. What we see.
The Market can go in the opposite direction, what we analyze. So we have to manage our risk and adopt the situation accordingly.


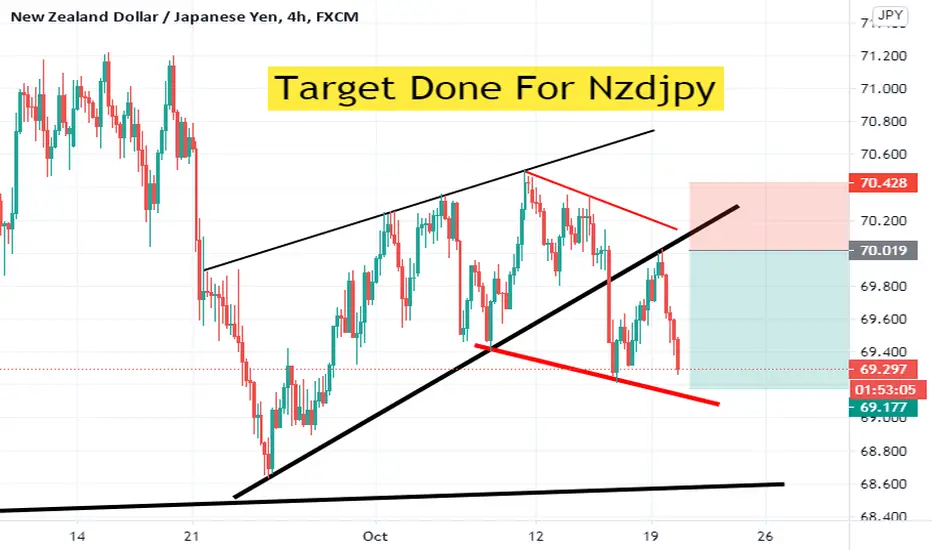
SellSell zone 70.02 - 70.60 region, first TP shown by the orange lines
Feel free to like and leave comments


NzdJpy to resume its long term downtrendNzdJpy is in a clear downtrend for 7 years now, with the pair dropping from 93 high to 60 low in spring.
After a normal correction/medium-term uptrend and a high around 72, the pair is in consolidation/distribution from the beginning of June.
Clear support is marked by 69 figure and a drop under this support would signal resumption of long term downtrend and a high probability short trade with a target of 66


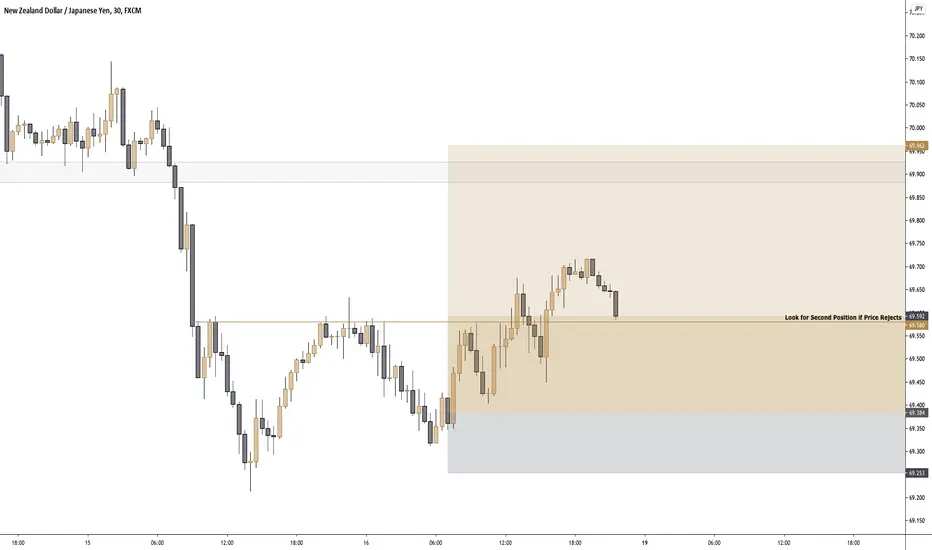
NZDJPY - Follow the StructureI and the Alkaline team got involved in an early buy position on this pair which has been extremely rewarding. I will be looking for a second buy position into the significant structure marked if we manage to see rejections from the horizontal ray, let's see how price develops on Monday. Have a great trading week everyone!
COT Data - 50/50
NZD/JPY SELL 📉👋 Hello and welcome traders to another trade idea with Fobian
☝️ Firstly, if you like what you see, please support our work by writing a comment and SMASH that like button! 👍 Let's catch these moves together! ✅
👉 WE have sell conformation:
- Trend was broken.
- EMA's give us SELL signal.
- Candle close below ASIAN session.
- Elliot Wave give us signal for down.
💡 Why should you follow our profile on TradingView?
Consistent chart updates
Clean charts
Short and long-term perspectives
Visually teaches you valuable lessons
High probability setups
Analysis on a wide range of major markets
SMASH that follow button! 👍
💡 Leave a comment and/or message us on how we can improve and provide better content, we are open to suggestions to create a better experience for you!
Keep in mind that the analysis provided is not 100% accurate and that you can never be certain with the markets. This information given is not financial advice, always do your own research.

NZDJPY SWING TRADE SETUP 15-OCT-2020NZDJPY-Technical analysis
The price was closed below the 70.000 key psychological level leaving a doji candle. And currently ZNDPY has retested the 70.000 level and its unable to break firmly
We can sell this pair now and the swing target would be 68.900 and stop lose may placed above the 70.500 level
SWING TRADE-NZDPY
Entry point @ 69.900
Take profit @ 68.900
Stop lose @ 70.520
R:R 1:2
💌 Leave your valuable comments and suggestions related to this idea in the comment section.
Thanks for your time. Good day guys 💝


NZDJPY is in uptrend and approaching Price action levelNZDJPY
After peaking the September month high around 72.00 which is a key psychological level its felled towards 68.640 which is a low volume area and find some buyers and making series of Higher high higher low patterns.
From Sep-09 to Sep-18 it was trading in a range and felled below the range. I have marked some levels are acting as accumulation and distribution phases after some consolidation phase its moved in a massive way.
The price is currently in a consolidation range at around 70.00 key psychological level. From this level we can expect bullish run towards 71.200 which is price action level where we can see a series of upper side rejection.This level is coordinated with 78.6% Fibonacci level
The price is currently trading within a.50 and .618 Fibonacci levels.As its reached the upper side of the .50 Fibonacci we can expect a minor correction towards .382 Fibonacci and from this level it will go bullish.
The 03 Exponential moving averages which is 50,100,200 are holding as support for the bull.
In Elliot wave theory the 4th impulse wave is completed and the 5th wave is underway. relative strength index has reached the 60 level and MACD histogram showing a starting of the bullish trend.
Ichimoku cloud is acting as support for the bull as its managed to float above the cloud.Buying NZDJPY around 69.900 with the target of 71.150 will give a nice risk reward ratio. Stop lose may placed below the 4th Elliot wave end point which is 69.600
Give us a like if you found useful. And tell your opinion in the comment section


NZDJPY Tripple top patternVery very clear tripple top pattern there. We might be going for a long crash ride. Any thoughts leave in the comment section
