NZDJPY H4 Bullish In this video, we will be discussing the bullish forecast for the NZDJPY currency pair. We will analyze the current market conditions and trends to provide insights on why we believe NZDJPY is likely to see a bullish movement in the near future. Stay tuned to learn more about potential trading opportunities and strategies for NZDJPY.
If you are interested in forex trading and want to stay ahead of the market, this video is a must-watch for you. Don't miss out on valuable information that could help you make informed trading decisions.
Subscribe to our channel for more updates on forex trading and market analysis.
Remember, trading involves risk and it's important to do your own research before making any investment decisions.
Nzdjpysignal

NZDJPY bullish NZDJPY analysis today look for buy opportunities..It has been on bullish for long time

NZDJPY Uptrend still our friendOn higher time frames we can identify which direction we're currently in. I'm entering due to market structure shift and change of character on our lower time frame (5 min). Around 90.577 there is liquidity which will be a target at some point and a supply zone. My entry @90.220, TP @90.577. Good luck!

NZDJPY : Long Trade , 4hHello traders, we want to check the NZDJPY chart. The general trend of the market is bullish and the price is making a correction to the specified support level and the bottom of the ascending channel. We see a divergence in the RSI indicator, so we expect the specified level to maintain the upward trend of the price and the price will grow to around 91.800. Good luck.

NZDJPY - Wait for the retracement ✅Hello traders!
‼️ This is my perspective on NZDJPY.
Technical analysis: Here we are in a bearish market structure from 4H timeframe perspective, so I look for a short. I want price to make a retracement to fill the imbalance and then to reject from bearish order block.
Like, comment and subscribe to be in touch with my content!

NZDJPY M30 / Long Trade Idea Intraday✅ Hello Traders!
This is my idea related to NZDJPY M30. I expect to see a bullish move until the price of 91.600. The JPY Basket is still bearish and I consider this argument an opportunity to look for a long entry on NZDJPY. Mos probable the price will hit the OB level.
Traders, if my proposal resonates with you or if you hold a divergent viewpoint regarding this trade, feel free to share your thoughts in the comments. I welcome the opportunity to hear your perspectives.
____________________________________
Follow, like, and comment to see my content:
www.tradingview.com

NZDJPY - Upside move ✅Hello traders!
‼️ This is my perspective on NZDJPY.
Technical analysis: Here we are in a bullish market structure from 4H timeframe perspective, so I am looking for a long. I expect bullish price action from here as price rejected from support zone. My target is buy side liquidity.
Like, comment and subscribe to be in touch with my content!

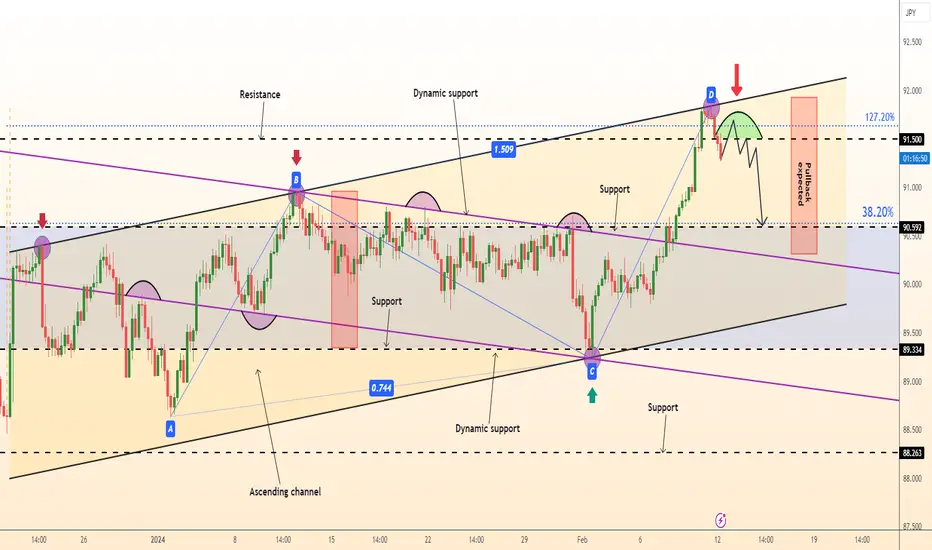
DeGRAM | NZDJPY AB=CD pattern completionNZDJPY has been in a bullish trend in an ascending channel. The market completed the AB=CD pattern.
It might be time for retracement. Usually, the price makes a 1/3 pullback following the completion of the AB=CD pattern.
We expect a sharp move down to retest the support 38.2% fibo level.
---------------
Share your opinion in the comments and support the idea with like. Thanks for your support!
NZDJPYThe analysis of the pair signals an approaching correction around 800 points. In this connection my recommendations look as follows.
Recommendations.
1. Close all medium-term long positions right now and start short positions.
2. Pay attention to the swap on short positions at your broker.
3. Get into a short position from the following levels: 92,28; 92,60
4. Target 800 pips.

DeGRAM | NZDJPY a trend continuationNZDJPY made a pullback to the kill zone, where we have 61.8% fibo level and psychological level 90.000.
Price is testing the lower border of the ascending channel, and if it rejects the level, then we might see a trend continuation from the kill zone.
We expect a rebound from the level and go up since the major trend is bullish.
---------------
Share your opinion in the comments and support the idea with like. Thanks for your support!

DeGRAM | NZDJPY continuation of trendNZDJPY broke and closed above the resistance level that became the support level.
The market is trading in the ascending channel, indicating that the bulls are in control.
We anticipate the continuation of this current trend: a breakout pullback and contunuation.
-------------------
Share your opinion in the comments and support the idea with a like. Thanks for your support!

set pending order. buy limit. dont take risk more then 1%yesterday NZDJPY made strong bull candle so tody i will take entry based on it.

DeGRAM | NZDJPY price decelerationNZDJPY decelerated and dropped from the resistance in the ascending channel.
Price broke and closed below the 90.000 psychological level. The market pulled back to retest it.
We expect a bearish move since the price has already dropped from this level several times.
---------------
Share your opinion in the comments and support the idea with like. Thanks for your support!

NZDJPY H4 / SHORT TRADE OPPORTUNITY ✅ Hello Traders!
This is my idea related to NZDJPY H4. We can see a new Weekly High (WH) and now I expect a retracement until the resistance level, considering this move a good opportunity to execute a short trade.
Traders, if you liked my idea or if you have a different vision related to this trade, write in the comments. I will be glad to see your perspective.
____________________________________
Follow, like, and comment to see my content:
www.tradingview.com

NzdJpy a Short term Bullish RunExpecting NZDJPY to provide a short term rally for the upside towards a target of 90.40 level with a defined stoploss and entry level in the charts
over all a bearish mode will develop once we swept 90.40 buystops and resume the market maker sell model.
Regards
Rizwan Ali
Accel Equity( Mark of Core Research )

DeGRAM | NZDJPY false breakout of the channelNZDJPY has been creating lower lows and lower closes in the descending channel.
The market pulled back from its support level following AB=CD completion.
The market created a pullback trading opportunity at resistance and the 50% fibo level.
We expect the price to drop from the kill zone and go down from there.
---------------
Share your opinion in the comments and support the idea with like. Thanks for your support!

DeGRAM | NZDJPY potential sellNZDJPY broke and closed below the psychological level of 90.000.
Price pulled back to resistance level and 61.8% fibo retracement following the bearish move.
If the price action broke out of the trendline, as you can see, the price made a sharp bearish move.
Price action is likely to go further down to retest the support.
-------------------
Share your opinion in the comments and support the idea with like. Thanks for your support!

NZDJPY - Long active ✅Hello traders!
‼️ This is my perspective on NZDJPY.
Technical analysis: Here we are in a bullish market structure from daily perspective, so I am looking for longs. I expect bullish price action from here as price rejected from bullish order block + institutional big figure 88.000.
Like, comment and subscribe to be in touch with my content!

NZDJPY: Asian session market update: NZD decreased during the seNZD fell during the session, a report from Westpac cut its expectations for Q4 CPI to 3%. If inflation falls rapidly, it would mean the Reserve Bank of New Zealand does not need to keep interest rates 'higher for longer' and would therefore cut support for the NZD.
In addition, the Tankan Q4 report includes a survey of thousands of Japanese companies of all sizes, in many industries conducted by the Bank of Japan. Shows that the Japanese economy continues to improve, albeit slowly, and also shows that business inflation expectations remain above 2% (BOJ target) for 5 years!
USD recovered, EUR, GBP, CAD, AUD all decreased slightly. The market is now mainly waiting for the Federal Open Market Committee (FOMC).
Oil prices remain high, a draft global declaration at COP28 called for the world to transition away from fossil fuels by 2050.

NZDJPY Technical Analysis And Trade IdeaThe NZDJPY has been trending bullish recently, reflecting robustness in the New Zealand dollar juxtaposed with weakness in the Japanese yen. This video delves into a possible trade opportunity, exploring scenarios within both the 4H and 1H timelines. It offers insights into price action, market structure, trend analysis, and crucial technical aspects. It's imperative to note that the content presented is solely for educational purposes and should not be interpreted as financial advice.

NZDJPY Idea H1Here is my analysis for NZDJPY on H1 using Order Block. The price could go bullish, you can put a pending order on the Order block or find an entry on LTF within OB Zone. Trade Safe!

NZDJPY Long Term selling Trading IdeaHello Traders
In This Chart NZDJPY HOURLY Forex Forecast By FOREX PLANET
today NZDJPY analysis 👆
🟢This Chart includes_ (NZDJPY market update)
🟢What is The Next Opportunity on NZDJPY Market
🟢how to Enter to the Valid Entry With Assurance Profit
This CHART is For Trader's that Want to Improve Their Technical Analysis Skills and Their Trading By Understanding How To Analyze The Market Using Multiple Timeframes and Understanding The Bigger Picture on the Charts

DeGRAM | NZDJPY continuation of trendNZDJPY reached resistance, and it's pulling back from it.
The market is trading in the ascending channel, indicating that the bulls are in control.
We anticipate the continuation of this current trend.
-------------------
Share your opinion in the comments and support the idea with a like. Thanks for your support!
