NZD/USD "Kiwi" Forex Vault Heist Plan!🌟 Yo, what's good? Salaam! Ciao! Konnichiwa! 🌟
Dear Cash Snatchers & Market Bandits, 🤑💰💸😎
Get ready to raid the NZD/USD "Kiwi" Forex Vault with the slickest 🔥Thief Trading Style🔥 Our tech-fueled, fundamental-backed heist plan is locked and loaded for a long-entry score. Stick to the chart’s sneaky blueprint and aim to slip out near the Red Zone—a high-stakes trap where overbought vibes, consolidation, and bearish bandits lurk. 🏆💸 Grab your loot and treat yourself, you sly foxes! 💪🎉
- 📈 Entry Point: The heist’s ON! 🕵️♂️ Lay low for the MA pullback at Institutional Buy Zone 1 (0.57700) or Buy Zone 2 (0.56000), then pounce for juicy bullish profits! 🚀
- 🛑 Stop Loss: Yo, ears up! 🗣️ If you’re setting a buy stop order, don’t touch that stop loss ‘til the breakout pops off. 📍 Stash it at the closest swing low on the 4H: Buy Zone 1 SL at 0.56500, Buy Zone 2 SL at 0.54500. Size it to your risk, lot, and multi-order game plan. Mess around, and you’re toast! 🔥
- 🎯 Target: Shoot for 0.62500 or ghost out early with the goods. 💰
- 👀 Scalper Crew: Long-side scalping only! Got deep pockets? Dive in. Tight budget? Roll with swing traders and slap on a trailing SL to shield your stash. 🧲
- 📊 Why It’s Lit: The Kiwi’s bullish run is powered by fundamentals, macro trends, COT reports, quant analysis, market vibes, and intermarket signals. Scope the full scoop from legit sources! 🌍🔗
⚠️ Heads-Up: News drops can flip the game! 📰 Stay sharp:
- Dodge new trades when news hits.
- Slap trailing stop-losses on to lock profits and cover your back.
💖 Fuel the heist! 💥 Smash that Boost Button to power up our Thief Trading Style squad. Swipe profits daily like a pro and roll with the slickest crew! 🏆🤝🚀 Catch you on the next big score, bandits! 🤑🐱👤😎
NZDUSD

Falling towards Fibonacci confluence?NZD/USD is falling towards the support level which is a pullback support that lines up with hte 161.8% and the 145% Fibonacci extension, slightly above the 38.2% Fibonacci retracement and the 78.6% Fibonacci projection, and could bounce from this level to our take profit.
Entry: 0.5831
Why we like it:
There is a pullback support level that lines up with the 161.8% and the 145% Fibonacci extension, slightly above the 38.2% Fibonacci retracement and the 78.6% Fibonacci projection
Stop loss: 0.5796
Why we like it:
There is a pullback support level that lines up with the 100% Fibonacci projection.
Take profit: 0.5893
Why we like it:
There is a pullback resistance level.
Enjoying your TradingView experience? Review us!
Please be advised that the information presented on TradingView is provided to Vantage (‘Vantage Global Limited’, ‘we’) by a third-party provider (‘Everest Fortune Group’). Please be reminded that you are solely responsible for the trading decisions on your account. There is a very high degree of risk involved in trading. Any information and/or content is intended entirely for research, educational and informational purposes only and does not constitute investment or consultation advice or investment strategy. The information is not tailored to the investment needs of any specific person and therefore does not involve a consideration of any of the investment objectives, financial situation or needs of any viewer that may receive it. Kindly also note that past performance is not a reliable indicator of future results. Actual results may differ materially from those anticipated in forward-looking or past performance statements. We assume no liability as to the accuracy or completeness of any of the information and/or content provided herein and the Company cannot be held responsible for any omission, mistake nor for any loss or damage including without limitation to any loss of profit which may arise from reliance on any information supplied by Everest Fortune Group.

NzdUsd is near to Bearish ZoneNzdUsd is very close to reversal (Bearish Zone) at 0.58827. It is expected to drop to 0.57761 and stop loss is 0.59468

Market Analysis: NZD/USD Ready to Climb AgainMarket Analysis: NZD/USD Ready to Climb Again
NZD/USD is also rising and could aim for a move above the 0.5945 resistance.
Important Takeaways for NZD/USD Analysis Today
- NZD/USD is consolidating above the 0.5915 support.
- There was a break above a connecting bearish trend line with resistance at 0.5910 on the hourly chart of NZD/USD at FXOpen.
NZD/USD Technical Analysis
On the hourly chart of NZD/USD on FXOpen, the pair also followed AUD/USD. The New Zealand Dollar formed a base above the 0.5900 level and started a decent increase against the US Dollar.
The pair climbed above the 0.5980 resistance. It tested the 0.6020 resistance before there was a pullback. The recent low was formed at 0.58704 and the pair is again rising above the 50-hour simple moving average.
There was a break above a connecting bearish trend line with resistance at 0.5910. The pair cleared the 0.5915 resistance and the 23.6% Fib retracement level of the downward move from the 0.6022 swing high to the 0.5870 low.
The NZD/USD chart suggests that the RSI is back above 50 signaling a positive bias. On the upside, the pair is facing resistance near the 50% Fib retracement level of the downward move from the 0.6022 swing high to the 0.5870 low at 0.5945.
The next major resistance is near the 0.5985 level. A clear move above the 0.5985 level might even push the pair toward the 0.6020 level. Any more gains might clear the path for a move toward the 0.6050 resistance zone in the coming days.
On the downside, there is a support forming near the 0.5915 zone. If there is a downside break below the 0.5915 support, the pair might slide toward 0.5870. Any more losses could lead NZD/USD in a bearish zone to 0.5810.
This article represents the opinion of the Companies operating under the FXOpen brand only. It is not to be construed as an offer, solicitation, or recommendation with respect to products and services provided by the Companies operating under the FXOpen brand, nor is it to be considered financial advice.

GBPUSD…inverse FVGGood day traders I have a lot of great setups but I believe this one can be a big mover going into the new week.
1D- Before going into more details I hope the inverse FVG is visible because that’s the area of interest, for the most part of last week was bearish indicating that US dollar for the upcoming week might continue with the strength shown last week. Price has broken structure lower but the way it broke price is not in a convincing way so keep an open mind to manipulation but overall the inverse is our area of interest. Monday and Tuesday we can expect price to move higher first than make a run lower since last week the move did not match the USD/XXX moves.
4H- Here we saw market shift lower to be in sync with the daily solidifying our weekly price movement bias. Here I’m not gonna say much cause the idea is based of the daily TF.

NZDUSD Will Collapse! SELL!
My dear subscribers,
This is my opinion on the NZDUSD next move:
The instrument tests an important psychological level 0.5975
Bias - Bearish
Technical Indicators: Supper Trend gives a precise Bearish signal, while Pivot Point HL predicts price changes and potential reversals in the market.
Target -0.5943
About Used Indicators:
On the subsequent day, trading above the pivot point is thought to indicate ongoing bullish sentiment, while trading below the pivot point indicates bearish sentiment.
Disclosure: I am part of Trade Nation's Influencer program and receive a monthly fee for using their TradingView charts in my analysis.
———————————
WISH YOU ALL LUCK

NZDUSD - Elliott Wave Setup: Eyes on the Buy Zone!NZDUSD - 3D Chart Elliott Wave Outlook
We've been tracking NZDUSD over the years and each move continues to align with Elliott Wave Theory.
The current structure is unfolding as a large ABC corrective pattern.
- Wave A and the complex Wave B (WXY) are now complete.
- We're now in Wave C, and we expect it to target the highs of Wave A.
Recently, NZDUSD made a clear bullish impulse but has been consolidating for the past 3 weeks. This correction is likely to resolve with a bullish breakout.
We've marked a buy zone between the 38.2% and 50% Fibonacci retracement levels, which we believe is the ideal entry area. We'll be watching this zone closely for lower timeframe bullish confirmations like a break of structure (BOS) or trendline break.
Trade Plan:
- Wait for price to enter the buy zone
- Look for bullish confirmations (BOS, trendline break)
- Enter after confirmation, with stops below the corrective lows
- Targets: 0.63 (500 pips), 0.65 (700 pips)
Goodluck and as always, Trade Safe!

NZDUSD: Is That a Liquidity Grab?! 🇳🇿🇺🇸
NZDUSD formed a bearish trap after a test of an important
intraday demand zone.
A violation of a resistance line of a wedge pattern on an hourly
confirms a strong buying interest.
The price may bounce at least to 0.5913
❤️Please, support my work with like, thank you!❤️
I am part of Trade Nation's Influencer program and receive a monthly fee for using their TradingView charts in my analysis.

Falling towards pullback support?The Kiwi (NZD/USD) is falling towards the pivot and could bounce to the 1st resistance.
Pivot: 0.5888
1st Support: 0.5830
1st Resistance: 0.5977
Risk Warning:
Trading Forex and CFDs carries a high level of risk to your capital and you should only trade with money you can afford to lose. Trading Forex and CFDs may not be suitable for all investors, so please ensure that you fully understand the risks involved and seek independent advice if necessary.
Disclaimer:
The above opinions given constitute general market commentary, and do not constitute the opinion or advice of IC Markets or any form of personal or investment advice.
Any opinions, news, research, analyses, prices, other information, or links to third-party sites contained on this website are provided on an "as-is" basis, are intended only to be informative, is not an advice nor a recommendation, nor research, or a record of our trading prices, or an offer of, or solicitation for a transaction in any financial instrument and thus should not be treated as such. The information provided does not involve any specific investment objectives, financial situation and needs of any specific person who may receive it. Please be aware, that past performance is not a reliable indicator of future performance and/or results. Past Performance or Forward-looking scenarios based upon the reasonable beliefs of the third-party provider are not a guarantee of future performance. Actual results may differ materially from those anticipated in forward-looking or past performance statements. IC Markets makes no representation or warranty and assumes no liability as to the accuracy or completeness of the information provided, nor any loss arising from any investment based on a recommendation, forecast or any information supplied by any third-party.

NZDUSD to find buyers at current market price?NZDUSD - 24h expiry
Indecisive price action has resulted in sideways congestion on the intraday chart.
Momentum is flat, highlighting the lack of clear direction.
Risk/Reward would be poor to call a buy from current levels.
A move through 0.5950 will confirm the bullish momentum.
The measured move target is 0.6025.
We look to Buy at 0.5900 (stop at 0.5850)
Our profit targets will be 0.6000 and 0.6025
Resistance: 0.5950 / 0.6000 / 0.6025
Support: 0.5900 / 0.5875 / 0.5850
Risk Disclaimer
The trade ideas beyond this page are for informational purposes only and do not constitute investment advice or a solicitation to trade. This information is provided by Signal Centre, a third-party unaffiliated with OANDA, and is intended for general circulation only. OANDA does not guarantee the accuracy of this information and assumes no responsibilities for the information provided by the third party. The information does not take into account the specific investment objectives, financial situation, or particular needs of any particular person. You should take into account your specific investment objectives, financial situation, and particular needs before making a commitment to trade, including seeking advice from an independent financial adviser regarding the suitability of the investment, under a separate engagement, as you deem fit.
You accept that you assume all risks in independently viewing the contents and selecting a chosen strategy.
Where the research is distributed in Singapore to a person who is not an Accredited Investor, Expert Investor or an Institutional Investor, Oanda Asia Pacific Pte Ltd (“OAP“) accepts legal responsibility for the contents of the report to such persons only to the extent required by law. Singapore customers should contact OAP at 6579 8289 for matters arising from, or in connection with, the information/research distributed.

Bearish drop for the Kiwi?The price has rejected off the resistance level which is an overlap resistance and could drop from this level to our take profit.
Entry: 0.5938
Why we like it:
There is an overlap resistance level.
Stop loss: 0.5968
Why we like it:
There is an overlap resistance level.
Take profit: 0.5853
Why we like it:
There is a pullback support level that lines up with the 138.2% Fibonacci extension.
Enjoying your TradingView experience? Review us!
Please be advised that the information presented on TradingView is provided to Vantage (‘Vantage Global Limited’, ‘we’) by a third-party provider (‘Everest Fortune Group’). Please be reminded that you are solely responsible for the trading decisions on your account. There is a very high degree of risk involved in trading. Any information and/or content is intended entirely for research, educational and informational purposes only and does not constitute investment or consultation advice or investment strategy. The information is not tailored to the investment needs of any specific person and therefore does not involve a consideration of any of the investment objectives, financial situation or needs of any viewer that may receive it. Kindly also note that past performance is not a reliable indicator of future results. Actual results may differ materially from those anticipated in forward-looking or past performance statements. We assume no liability as to the accuracy or completeness of any of the information and/or content provided herein and the Company cannot be held responsible for any omission, mistake nor for any loss or damage including without limitation to any loss of profit which may arise from reliance on any information supplied by Everest Fortune Group.

Kiwi H4 | Falling to an overlap supportThe Kiwi (NZD/USD) is falling towards an overlap support and could potentially bounce off this level to climb higher.
Buy entry is at 0.5890 which is an overlap support that aligns with the 23.6% Fibonacci retracement.
Stop loss is at 0.5810 which is a level that lies underneath an overlap support and the 38.2% Fibonacci retracement.
Take profit is at 0.6019 which is a multi-swing-high resistance.
High Risk Investment Warning
Trading Forex/CFDs on margin carries a high level of risk and may not be suitable for all investors. Leverage can work against you.
Stratos Markets Limited (tradu.com):
CFDs are complex instruments and come with a high risk of losing money rapidly due to leverage. 63% of retail investor accounts lose money when trading CFDs with this provider. You should consider whether you understand how CFDs work and whether you can afford to take the high risk of losing your money.
Stratos Europe Ltd (tradu.com):
CFDs are complex instruments and come with a high risk of losing money rapidly due to leverage. 63% of retail investor accounts lose money when trading CFDs with this provider. You should consider whether you understand how CFDs work and whether you can afford to take the high risk of losing your money.
Stratos Global LLC (tradu.com):
Losses can exceed deposits.
Please be advised that the information presented on TradingView is provided to Tradu (‘Company’, ‘we’) by a third-party provider (‘TFA Global Pte Ltd’). Please be reminded that you are solely responsible for the trading decisions on your account. There is a very high degree of risk involved in trading. Any information and/or content is intended entirely for research, educational and informational purposes only and does not constitute investment or consultation advice or investment strategy. The information is not tailored to the investment needs of any specific person and therefore does not involve a consideration of any of the investment objectives, financial situation or needs of any viewer that may receive it. Kindly also note that past performance is not a reliable indicator of future results. Actual results may differ materially from those anticipated in forward-looking or past performance statements. We assume no liability as to the accuracy or completeness of any of the information and/or content provided herein and the Company cannot be held responsible for any omission, mistake nor for any loss or damage including without limitation to any loss of profit which may arise from reliance on any information supplied by TFA Global Pte Ltd.
The speaker(s) is neither an employee, agent nor representative of Tradu and is therefore acting independently. The opinions given are their own, constitute general market commentary, and do not constitute the opinion or advice of Tradu or any form of personal or investment advice. Tradu neither endorses nor guarantees offerings of third-party speakers, nor is Tradu responsible for the content, veracity or opinions of third-party speakers, presenters or participants.

NZD/USD Climbs on US-China Optimism and RBNZ Rate Cut ExpectatioNZD/USD Climbs on US-China Optimism and RBNZ Rate Cut Expectations
The NZD/USD currency pair edged higher during European trading hours on Thursday, recovering from two consecutive sessions of losses. Trading near 0.5982, the pair benefited from renewed optimism surrounding potential US-China trade negotiations, a key factor given New Zealand's strong economic ties with China.
This resurgence in the Kiwi dollar (NZD) contrasts with the broader trend of recent days. The previous decline was likely fueled by concerns over global economic growth and the impending interest rate decisions from central banks across the globe. The pair's upward movement now suggests a shift in sentiment, with investors recognizing the potential positive impact of a potential trade thaw.
Crucially, expectations surrounding the Reserve Bank of New Zealand's (RBNZ) upcoming May meeting are also playing a significant role. Markets are overwhelmingly pricing in a 25 basis-point cut to the Official Cash Rate (OCR) from its current 3.5%. Furthermore, there's a growing expectation of further easing to 2.75% by the year-end. This anticipated easing of monetary policy in New Zealand is providing substantial support to the NZD, adding another bullish element to the current trading environment.
From a technical perspective, the price action around the crucial 0.5980 level highlights the interplay of fundamental and technical factors. While the price has reached a weekly supply zone, the confluence of optimistic trade sentiment and the expected OCR cut is currently outpacing any bearish technical indicators.
However, a sustained move above the significant resistance of the 0.6000 level is critical to confirming the renewed bullish momentum. A break above this psychological barrier would signal further strength in the Kiwi dollar, whereas a reversal below 0.5980 would bring the previously discussed bearish factors back into the forefront.
Looking ahead, the key to future direction for the NZD/USD will likely depend on the outcome of the US-China trade negotiations and any potential further developments regarding the RBNZ's interest rate decisions. Markets will be watching closely for any tangible progress in either area, as this will likely dictate the pair's trajectory.
✅ Please share your thoughts about NZD/USD in the comments section below and HIT LIKE if you appreciate my analysis. Don't forget to FOLLOW ME; you will help us a lot with this small contribution.

MarketBreakdown | EURUSD, USDCAD, NZDUSD, USDCHF
Here are the updates & outlook for multiple instruments in my watch list.
1️⃣ #EURUSD daily time frame 🇪🇺🇺🇸
EURUSD formed a huge head and shoulders pattern.
The price is currently testing its horizontal neckline.
Bearish breakout of that and a daily candle close below
will confirm a bearish reversal and push the prices lower.
2️⃣ #USDCAD daily time frame 🇺🇸🇨🇦
The price is breaking a solid falling trend line.
Its violation is an important bullish signal that
indicates a strength of the buyers.
We can expect even more growth.
3️⃣ #NZDUSD daily time frame 🇺🇸🇳🇿
The pair is consolidating within a horizontal range.
The price is going to reach its support soon.
I suggest looking for a pullback trade from that then.
4️⃣ #USDCHF daily time frame 🇺🇸🇨🇭
The price is stuck within a horizontal parallel channel.
I expect a bullish continuation within that and a test
of its upper boundary.
Then, look for a confirmation to see and try to catch a retracement from that.
Do you agree with my market breakdown?
❤️Please, support my work with like, thank you!❤️
I am part of Trade Nation's Influencer program and receive a monthly fee for using their TradingView charts in my analysis.

Falling towards pullback support?The Kiwi (NZD/USD) is falling towards the pivot which acts as a pullback support and could bounce to the 1st resistance.
Pivot: 0.5902
1st Support: 0.5852
1st Resistance: 0.6020
Risk Warning:
Trading Forex and CFDs carries a high level of risk to your capital and you should only trade with money you can afford to lose. Trading Forex and CFDs may not be suitable for all investors, so please ensure that you fully understand the risks involved and seek independent advice if necessary.
Disclaimer:
The above opinions given constitute general market commentary, and do not constitute the opinion or advice of IC Markets or any form of personal or investment advice.
Any opinions, news, research, analyses, prices, other information, or links to third-party sites contained on this website are provided on an "as-is" basis, are intended only to be informative, is not an advice nor a recommendation, nor research, or a record of our trading prices, or an offer of, or solicitation for a transaction in any financial instrument and thus should not be treated as such. The information provided does not involve any specific investment objectives, financial situation and needs of any specific person who may receive it. Please be aware, that past performance is not a reliable indicator of future performance and/or results. Past Performance or Forward-looking scenarios based upon the reasonable beliefs of the third-party provider are not a guarantee of future performance. Actual results may differ materially from those anticipated in forward-looking or past performance statements. IC Markets makes no representation or warranty and assumes no liability as to the accuracy or completeness of the information provided, nor any loss arising from any investment based on a recommendation, forecast or any information supplied by any third-party.

NZDUSD: Bearish Continuation & Short Trade
NZDUSD
- Classic bearish formation
- Our team expects fall
SUGGESTED TRADE:
Swing Trade
Sell NZDUSD
Entry Level - 0.5987
Sl - 0.6008
Tp - 0.5948
Our Risk - 1%
Start protection of your profits from lower levels
Disclosure: I am part of Trade Nation's Influencer program and receive a monthly fee for using their TradingView charts in my analysis.
❤️ Please, support our work with like & comment! ❤️

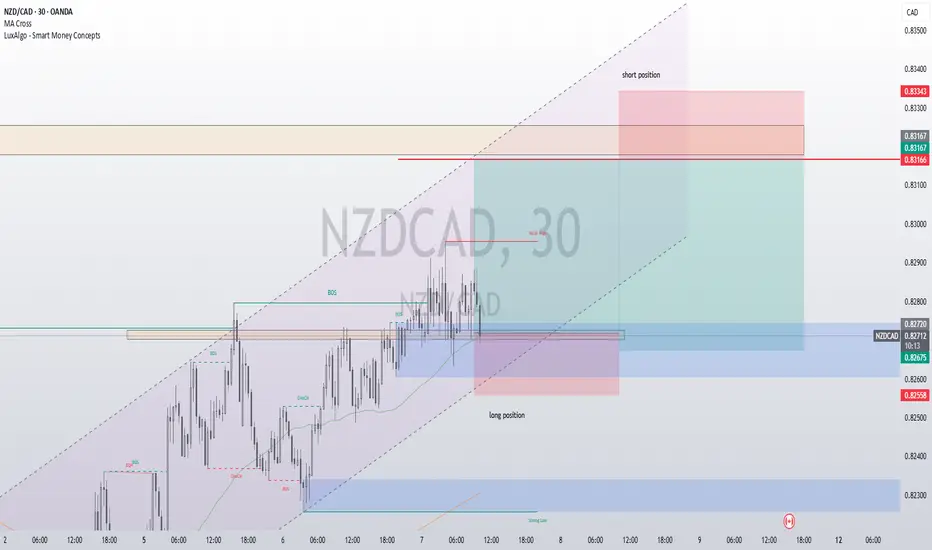
NZDCAD – Range Play, Resistance RetestNZDCAD – Consolidation Within Neutral Range as Market Eyes Fed Developments
The NZDCAD currency pair is currently exhibiting strength within the confines of a well-defined neutral trading range. This stabilization is largely underpinned by the recent corrective pullback in the U.S. dollar, which has provided short-term support for the New Zealand dollar. However, questions remain about the sustainability of this momentum, especially with significant macroeconomic events looming on the horizon — most notably, the Federal Open Market Committee (FOMC) meeting and the subsequent speech by Federal Reserve Chair Jerome Powell.
At present, NZDCAD is trading within a localized range, and price action is gravitating toward the key liquidity zone around the 0.8317 level. This area has become a focal point for market participants, as it represents a notable level of interest where prior price reactions have occurred. The pullback in the U.S. dollar has temporarily shifted sentiment in favor of the NZD, but this may prove short-lived depending on upcoming policy signals from the Federal Reserve.
From a technical standpoint, the currency pair is constrained between strong resistance at 0.83175 and a cluster of support levels located at 0.82644, 0.8235, and 0.8225. The proximity of these levels reinforces the neutral bias and increases the likelihood of short-term whipsaws or potential false breakouts. Traders should exercise caution in positioning aggressively within this zone, particularly ahead of fundamental catalysts that could swiftly reshape market dynamics.
Market sentiment is increasingly focused on the tone and direction of Fed policy. Should the FOMC or Chair Powell deliver signals that point toward a more hawkish policy trajectory — whether through immediate action or forward guidance — the U.S. dollar could regain strength rapidly. This would likely exert downward pressure on NZDCAD, potentially driving the pair back toward the lower bounds of its trading range or beyond.
Conversely, any dovish surprises or indications of policy patience could extend the current reprieve for the NZD, enabling a continued challenge of the upper resistance area. However, given prevailing expectations for a firm stance by the Fed amid ongoing inflationary concerns, the market is pricing in a scenario where dollar strength could reassert itself — possibly leading to a reversal in NZDCAD’s recent strength.
In conclusion, while NZDCAD remains technically range-bound for now, the landscape is ripe for volatility. The confluence of resistance near 0.8317 and heightened anticipation around Fed-related news points to a critical juncture for this pair. Traders should monitor price action closely, remain aware of potential false breakouts, and align short-term strategies with the broader macro narrative that will emerge following the FOMC decision and Powell’s speech.
NZDUSD D1 | Bearish Drop Based on the D1 chart, the price is approaching our sell entry level at 0.6053, a pullback resistance that aligns with the 61.8% Fibo retracement.
Our take profit is set at 0.5909, an overlap support.
The stop loss is set at 0.6200, a pullback resistance.
High Risk Investment Warning
Trading Forex/CFDs on margin carries a high level of risk and may not be suitable for all investors. Leverage can work against you.
Stratos Markets Limited (tradu.com):
CFDs are complex instruments and come with a high risk of losing money rapidly due to leverage. 63% of retail investor accounts lose money when trading CFDs with this provider. You should consider whether you understand how CFDs work and whether you can afford to take the high risk of losing your money.
Stratos Europe Ltd (tradu.com):
CFDs are complex instruments and come with a high risk of losing money rapidly due to leverage. 63% of retail investor accounts lose money when trading CFDs with this provider. You should consider whether you understand how CFDs work and whether you can afford to take the high risk of losing your money.
Stratos Global LLC (tradu.com):
Losses can exceed deposits.
Please be advised that the information presented on TradingView is provided to Tradu (‘Company’, ‘we’) by a third-party provider (‘TFA Global Pte Ltd’). Please be reminded that you are solely responsible for the trading decisions on your account. There is a very high degree of risk involved in trading. Any information and/or content is intended entirely for research, educational and informational purposes only and does not constitute investment or consultation advice or investment strategy. The information is not tailored to the investment needs of any specific person and therefore does not involve a consideration of any of the investment objectives, financial situation or needs of any viewer that may receive it. Kindly also note that past performance is not a reliable indicator of future results. Actual results may differ materially from those anticipated in forward-looking or past performance statements. We assume no liability as to the accuracy or completeness of any of the information and/or content provided herein and the Company cannot be held responsible for any omission, mistake nor for any loss or damage including without limitation to any loss of profit which may arise from reliance on any information supplied by TFA Global Pte Ltd.
The speaker(s) is neither an employee, agent nor representative of Tradu and is therefore acting independently. The opinions given are their own, constitute general market commentary, and do not constitute the opinion or advice of Tradu or any form of personal or investment advice. Tradu neither endorses nor guarantees offerings of third-party speakers, nor is Tradu responsible for the content, veracity or opinions of third-party speakers, presenters or participants.

NZD_USD LOCAL PULLBACK AHEAD|SHORT|
✅NZD_USD will soon retest a key resistance level of 0.6036
So I think that the pair will make a pullback
And go down to retest the demand level below at 0.6000
SHORT🔥
✅Like and subscribe to never miss a new idea!✅
Disclosure: I am part of Trade Nation's Influencer program and receive a monthly fee for using their TradingView charts in my analysis.

New Zealand dollar steady ahead of employment dataThe New Zealand dollar is showing limited movement on Tuesday. In the European session, NZD/USD is trading at 0.5970, up 0.05% on the day. With no key events in New Zealand or the US today, we can expect a quiet day for the New Zealand dollar.
New Zealand releases the employment report for the first quarter on Wednesday. The labor market is showing signs of weakening, with employment change posting two straight declines.
The markets are projecting a slight improvement, with an estimate of 0.1% for Q1.
The unemployment rate has accelerated for seven consecutive quarters and is expected to rise to 5.3% from 5.1% in Q4 2025. This would be the highest level since Q4 2016 and would support the case for the Reserve Bank of New Zealand to lower rates for a sixth straight time at the May 28 meeting. At the April meeting, members warned that the tariffs created downside risks for growth and inflation in New Zealand.
The RBNZ would prefer to continue lowering interest rates in increments of 25-basis points in order to boost the weak economy. Inflation is comfortably within the 1-3% target band but there are upside risks to inflation, especially with global trade tensions escalating due to US tariffs.
In the US, the Federal Reserve is virtually certain to maintain interest rates at 4.25-4.5% on Wednesday. The meeting will be interesting as Fed Chair Powell is expected to push back against pressure from President Trump to lower rates. The Fed is likely to remain on the sidelines until the uncertainty over US tariffs becomes more clear. Trump's zig-zags over tariffs has triggered wild swings in the financial markets, but Trump has said some trade agreements will be announced soon.
NZD/USD is testing support at 0.5968. Below, there is support at 0.5940
There is resistance at 0.5995 and 0.6023

NZD-USD Short From Resistance! Sell!
Hello,Traders!
NZD-USD keeps growing
In an uptrend but the pair
Will soon hit a horizontal
Resistance of 0.6029 from
Where we will be expecting
A local bearish pullback
And a further move down
Sell!
Comment and subscribe to help us grow!
Check out other forecasts below too!
Disclosure: I am part of Trade Nation's Influencer program and receive a monthly fee for using their TradingView charts in my analysis.

NZDUSDOur previous trade was on **EURUSD**, and it’s just a few pips away from hitting the **Take Profit** level — even though I shared it only 5 minutes ago! 🙂
From a **correlation perspective**, I’ve identified a similar opportunity on **NZDUSD** in the same direction. That’s why I’ve opened a **Buy** trade on NZDUSD as well.
🔍 **Criteria:**
✔️ Timeframe: 15M
✔️ Risk-to-Reward Ratio: 1:1.50
✔️ Trade Direction: Buy
✔️ Entry Price: 0.59722
✔️ Take Profit: 0.59923
✔️ Stop Loss: 0.59588
🔔 **Disclaimer:** This is not financial advice. It's a trade I’m taking based on my own system, shared purely for educational purposes.
📌 If you're also interested in systematic and data-driven trading strategies:
💡 Don’t forget to follow the page and subscribe to stay updated on future analyses.

NZDUSD to continue in the upward move?NZDUSD - 24h expiry
Indecisive price action has resulted in sideways congestion on the intraday chart.
Momentum is flat, highlighting the lack of clear direction.
Risk/Reward would be poor to call a buy from current levels.
A move through 0.6000 will confirm the bullish momentum.
The measured move target is 0.6075.
We look to Buy at 0.5950 (stop at 0.5900)
Our profit targets will be 0.6050 and 0.6075
Resistance: 0.6000 / 0.6025 / 0.6050
Support: 0.5950 / 0.5925 / 0.5900
Risk Disclaimer
The trade ideas beyond this page are for informational purposes only and do not constitute investment advice or a solicitation to trade. This information is provided by Signal Centre, a third-party unaffiliated with OANDA, and is intended for general circulation only. OANDA does not guarantee the accuracy of this information and assumes no responsibilities for the information provided by the third party. The information does not take into account the specific investment objectives, financial situation, or particular needs of any particular person. You should take into account your specific investment objectives, financial situation, and particular needs before making a commitment to trade, including seeking advice from an independent financial adviser regarding the suitability of the investment, under a separate engagement, as you deem fit.
You accept that you assume all risks in independently viewing the contents and selecting a chosen strategy.
Where the research is distributed in Singapore to a person who is not an Accredited Investor, Expert Investor or an Institutional Investor, Oanda Asia Pacific Pte Ltd (“OAP“) accepts legal responsibility for the contents of the report to such persons only to the extent required by law. Singapore customers should contact OAP at 6579 8289 for matters arising from, or in connection with, the information/research distributed.
