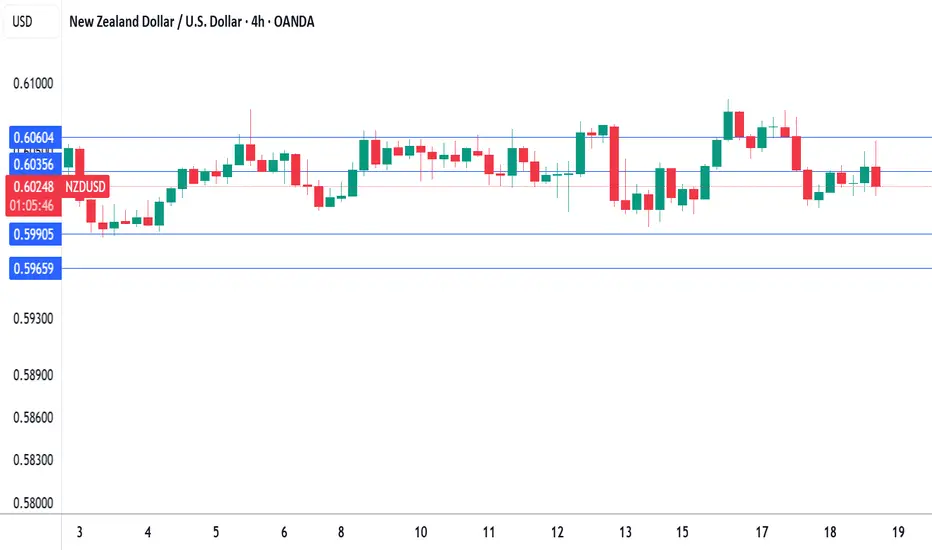
Bearish reversal?The Kiwi (NZD/USD) is rising towards the pivot and could reverse to the pullback support.
Pivot: 0.6036
1st Support: 0.5965
1st Resistance: 0.6080
Risk Warning:
Trading Forex and CFDs carries a high level of risk to your capital and you should only trade with money you can afford to lose. Trading Forex and CFDs may not be suitable for all investors, so please ensure that you fully understand the risks involved and seek independent advice if necessary.
Disclaimer:
The above opinions given constitute general market commentary, and do not constitute the opinion or advice of IC Markets or any form of personal or investment advice.
Any opinions, news, research, analyses, prices, other information, or links to third-party sites contained on this website are provided on an "as-is" basis, are intended only to be informative, is not an advice nor a recommendation, nor research, or a record of our trading prices, or an offer of, or solicitation for a transaction in any financial instrument and thus should not be treated as such. The information provided does not involve any specific investment objectives, financial situation and needs of any specific person who may receive it. Please be aware, that past performance is not a reliable indicator of future performance and/or results. Past Performance or Forward-looking scenarios based upon the reasonable beliefs of the third-party provider are not a guarantee of future performance. Actual results may differ materially from those anticipated in forward-looking or past performance statements. IC Markets makes no representation or warranty and assumes no liability as to the accuracy or completeness of the information provided, nor any loss arising from any investment based on a recommendation, forecast or any information supplied by any third-party.
NZDUSD

NZDUSD What Next? BUY!
My dear friends,
My technical analysis for NZDUSD is below:
The market is trading on 0.5974 pivot level.
Bias - Bullish
Technical Indicators: Both Super Trend & Pivot HL indicate a highly probable Bullish continuation.
Target - 0.6009
About Used Indicators:
A pivot point is a technical analysis indicator, or calculations, used to determine the overall trend of the market over different time frames.
Disclosure: I am part of Trade Nation's Influencer program and receive a monthly fee for using their TradingView charts in my analysis.
———————————
WISH YOU ALL LUCK

NZDUSD - Expecting Bearish Continuation In The Short TermH1 - Clean bearish trend with the price creating series of lower highs, lower lows.
No opposite signs.
Expecting further continuation lower until the two Fibonacci resistance zones hold.
If you enjoy this idea, don’t forget to LIKE 👍, FOLLOW ✅, SHARE 🙌, and COMMENT ✍! Drop your thoughts and charts below to keep the discussion going. Your support helps keep this content free and reach more people! 🚀
--------------------------------------------------------------------------------------------------------------------

Bullish bounce off overlap support?The Kiwi (NZD/USD) is reacting off the pivot, which has been identified as an overlap support, and could bounce to the first resistance, which is an overlap resistance.
Pivot: 0.5990
1st Support: 0.5951
1st Resistance: 0.6044
Risk Warning:
Trading Forex and CFDs carries a high level of risk to your capital and you should only trade with money you can afford to lose. Trading Forex and CFDs may not be suitable for all investors, so please ensure that you fully understand the risks involved and seek independent advice if necessary.
Disclaimer:
The above opinions given constitute general market commentary, and do not constitute the opinion or advice of IC Markets or any form of personal or investment advice.
Any opinions, news, research, analyses, prices, other information, or links to third-party sites contained on this website are provided on an "as-is" basis, are intended only to be informative, is not an advice nor a recommendation, nor research, or a record of our trading prices, or an offer of, or solicitation for a transaction in any financial instrument and thus should not be treated as such. The information provided does not involve any specific investment objectives, financial situation and needs of any specific person who may receive it. Please be aware, that past performance is not a reliable indicator of future performance and/or results. Past Performance or Forward-looking scenarios based upon the reasonable beliefs of the third-party provider are not a guarantee of future performance. Actual results may differ materially from those anticipated in forward-looking or past performance statements. IC Markets makes no representation or warranty and assumes no liability as to the accuracy or completeness of the information provided, nor any loss arising from any investment based on a recommendation, forecast or any information supplied by any third-party.

New Zealand GDP expected to contract, New Zealand dollar recoverThe New Zealand dollar has posted gains on Wednesday. In the North American session, NZD/USD is trading at 0.6042, up 0.45% on the day. The New Zealand dollar sustained sharp losses a day earlier, declining 0.75%.
The New Zealand economy is in recession and the markets are bracing for a contraction in first-quarter GDP of 0.8%. The economy declined in Q4 2024 by 1.1%.
A weak GDP report would put pressure on the Reserve Bank of New Zealand to reduce interest rates at the next meeting on July 9. The Reserve Bank has been aggressive and lowered rates for a sixth straight time in May to 3.25%, for a total of 225 basis points.
Is the resilient US consumer showing cracks?
US retail sales slumped in May, falling 0.9% m/m. This was well below the revised -0.1% reading in April and worse than the market estimate of -0.7%. Annually, retail sales fell to 3.3%, down sharply from a revised 5.0%.
The monthly retail sales is particularly concerning because it marked a second straight decline. The pre-tariff spike in consumer spending has fizzled as the tariffs have taken effect. Consumers are wary that the tariffs will boost inflation and dampen consumer spending power and concerns about hiring have risen, prompting consumers to batten down the hatches in anticipation of tougher times ahead.
If additional key US data heads lower, this will increase pressure on the Federal Reserve to lower interest rates. The markets have priced in a hold at Wednesday's meeting at practically 100%, with little chance of a rate cut before September.
NZD/USD is testing resistance at 0.6035. Above, there is resistance at 0.6060
0.5990 and 0.5965 and providing support
Possible reversal on Nzd/UsdNZD/USD is currently trading around 0.6030, and there are indications of a potential reversal. Let's break down the key points :
- Current Price: NZD/USD is trading at 0.6027, with a 0.2% increase in the last 24 hours.
- Ascending Channel: The pair is testing the lower boundary of an ascending channel near 0.6020, which could signal a bearish bias if broken.
- Relative Strength Index (RSI): The 14-day RSI remains above 50, suggesting a bullish bias is still in play.
- Resistance Levels: Initial resistance is at the nine-day EMA of 0.6028, followed by the eight-month high of 0.6081.
- *Support Levels*: A break below 0.6020 could lead to a decline toward the 50-day EMA at 0.5941.
Maybe bullish:
- Overlap Support: The pivot point at 0.5989 acts as an overlap support, which could lead to a bounce to the 1st resistance at 0.6060.
- Buying Opportunity: Traders are monitoring NZD/USD for a buying opportunity around the 0.60000 zone, citing a testing of the upward trend and liquidity zone.
Keep in mind that technical analysis is only part of investment reference, and market volatility can be unpredictable. It's essential to consider multiple factors, including economic news and geopolitical events, when making trading decisions .

Kiwi H1 | Potential bounce off an overlap supportThe Kiwi (NZD/USD) is falling towards an overlap support and could potentially bounce off this level to climb higher.
Buy entry is at 0.6051 which is an overlap support.
Stop loss is at 0.6025 which is a level that lies underneath a pullback support and the 61.8% Fibonacci retracement.
Take profit is at 0.6077 which is a swing-high resistance.
High Risk Investment Warning
Trading Forex/CFDs on margin carries a high level of risk and may not be suitable for all investors. Leverage can work against you.
Stratos Markets Limited (tradu.com ):
CFDs are complex instruments and come with a high risk of losing money rapidly due to leverage. 63% of retail investor accounts lose money when trading CFDs with this provider. You should consider whether you understand how CFDs work and whether you can afford to take the high risk of losing your money.
Stratos Europe Ltd (tradu.com ):
CFDs are complex instruments and come with a high risk of losing money rapidly due to leverage. 63% of retail investor accounts lose money when trading CFDs with this provider. You should consider whether you understand how CFDs work and whether you can afford to take the high risk of losing your money.
Stratos Global LLC (tradu.com ):
Losses can exceed deposits.
Please be advised that the information presented on TradingView is provided to Tradu (‘Company’, ‘we’) by a third-party provider (‘TFA Global Pte Ltd’). Please be reminded that you are solely responsible for the trading decisions on your account. There is a very high degree of risk involved in trading. Any information and/or content is intended entirely for research, educational and informational purposes only and does not constitute investment or consultation advice or investment strategy. The information is not tailored to the investment needs of any specific person and therefore does not involve a consideration of any of the investment objectives, financial situation or needs of any viewer that may receive it. Kindly also note that past performance is not a reliable indicator of future results. Actual results may differ materially from those anticipated in forward-looking or past performance statements. We assume no liability as to the accuracy or completeness of any of the information and/or content provided herein and the Company cannot be held responsible for any omission, mistake nor for any loss or damage including without limitation to any loss of profit which may arise from reliance on any information supplied by TFA Global Pte Ltd.
The speaker(s) is neither an employee, agent nor representative of Tradu and is therefore acting independently. The opinions given are their own, constitute general market commentary, and do not constitute the opinion or advice of Tradu or any form of personal or investment advice. Tradu neither endorses nor guarantees offerings of third-party speakers, nor is Tradu responsible for the content, veracity or opinions of third-party speakers, presenters or participants.

Bullish bounce?The Kiwi (NZD/USD) is falling towards the pivot and could bounce to the 127.2% Fibonacci resistance.
Pivot: 0.6036
1st Support: 0.6002
1st Resistance: 0.6093
Risk Warning:
Trading Forex and CFDs carries a high level of risk to your capital and you should only trade with money you can afford to lose. Trading Forex and CFDs may not be suitable for all investors, so please ensure that you fully understand the risks involved and seek independent advice if necessary.
Disclaimer:
The above opinions given constitute general market commentary, and do not constitute the opinion or advice of IC Markets or any form of personal or investment advice.
Any opinions, news, research, analyses, prices, other information, or links to third-party sites contained on this website are provided on an "as-is" basis, are intended only to be informative, is not an advice nor a recommendation, nor research, or a record of our trading prices, or an offer of, or solicitation for a transaction in any financial instrument and thus should not be treated as such. The information provided does not involve any specific investment objectives, financial situation and needs of any specific person who may receive it. Please be aware, that past performance is not a reliable indicator of future performance and/or results. Past Performance or Forward-looking scenarios based upon the reasonable beliefs of the third-party provider are not a guarantee of future performance. Actual results may differ materially from those anticipated in forward-looking or past performance statements. IC Markets makes no representation or warranty and assumes no liability as to the accuracy or completeness of the information provided, nor any loss arising from any investment based on a recommendation, forecast or any information supplied by any third-party.

NZDUSD - Trade Re-cap Take a look at the NZDUSD trade re-cap.
Here I explain exactly what I was looking for in getting this 1:10RR trade from start to finish.
Hope this helps

NZDUSD to continue in the upward move?NZDUSD - 24h expiry
There is no clear indication that the upward move is coming to an end.
Although we remain bullish overall, a correction is possible with plenty of room to move lower without impacting the trend higher.
Risk/Reward would be poor to call a buy from current levels.
A move through 0.6085 will confirm the bullish momentum.
The measured move target is 0.6125.
We look to Buy at 0.6050 (stop at 0.6025)
Our profit targets will be 0.6100 and 0.6125
Resistance: 0.6085 / 0.6100 / 0.6125
Support: 0.6060 / 0.6050 / 0.6025
Risk Disclaimer
The trade ideas beyond this page are for informational purposes only and do not constitute investment advice or a solicitation to trade. This information is provided by Signal Centre, a third-party unaffiliated with OANDA, and is intended for general circulation only. OANDA does not guarantee the accuracy of this information and assumes no responsibilities for the information provided by the third party. The information does not take into account the specific investment objectives, financial situation, or particular needs of any particular person. You should take into account your specific investment objectives, financial situation, and particular needs before making a commitment to trade, including seeking advice from an independent financial adviser regarding the suitability of the investment, under a separate engagement, as you deem fit.
You accept that you assume all risks in independently viewing the contents and selecting a chosen strategy.
Where the research is distributed in Singapore to a person who is not an Accredited Investor, Expert Investor or an Institutional Investor, Oanda Asia Pacific Pte Ltd (“OAP“) accepts legal responsibility for the contents of the report to such persons only to the extent required by law. Singapore customers should contact OAP at 6579 8289 for matters arising from, or in connection with, the information/research distributed.

NZDUSD: Market of Sellers
The analysis of the NZDUSD chart clearly shows us that the pair is finally about to tank due to the rising pressure from the sellers.
Disclosure: I am part of Trade Nation's Influencer program and receive a monthly fee for using their TradingView charts in my analysis.
❤️ Please, support our work with like & comment! ❤️

NZDUSD Bullish consolidation breakout supported at 0.6000Trend Overview:
The NZDUSD currency price remains in a bullish trend, characterised by higher highs and higher lows. The recent intraday price action is forming a continuation consolidation pattern, suggesting a potential pause before a renewed move higher.
Key Technical Levels:
Support: 0.6000 (primary pivot), followed by 0.5985 and 0.5950
Resistance: 0.6100 (initial), then 0.6140 and 0.6180
Technical Outlook:
A pullback to the 0.6000 level, which aligns with the previous consolidation zone, could act as a platform for renewed buying interest. A confirmed bounce from this support may trigger a continuation toward the next resistance levels at 0.6100, 0.6140, and ultimately 0.6180.
Conversely, a daily close below 0.6000 would suggest weakening bullish momentum. This scenario would shift the bias to bearish in the short term, potentially targeting 0.5985 and 0.5950 as downside levels.
Conclusion:
NZDUSD maintains a bullish structure while trading above the 0.6000 support. A bounce from this level would validate the consolidation as a continuation pattern, with upside potential toward the 0.6100 area. A breakdown below 0.6000, however, would invalidate this view and suggest deeper corrective risk.
This communication is for informational purposes only and should not be viewed as any form of recommendation as to a particular course of action or as investment advice. It is not intended as an offer or solicitation for the purchase or sale of any financial instrument or as an official confirmation of any transaction. Opinions, estimates and assumptions expressed herein are made as of the date of this communication and are subject to change without notice. This communication has been prepared based upon information, including market prices, data and other information, believed to be reliable; however, Trade Nation does not warrant its completeness or accuracy. All market prices and market data contained in or attached to this communication are indicative and subject to change without notice.

NZD/USD BEARS ARE STRONG HERE|SHORT
NZD/USD SIGNAL
Trade Direction: short
Entry Level: 0.605
Target Level: 0.602
Stop Loss: 0.606
RISK PROFILE
Risk level: medium
Suggested risk: 1%
Timeframe: 1h
Disclosure: I am part of Trade Nation's Influencer program and receive a monthly fee for using their TradingView charts in my analysis.
✅LIKE AND COMMENT MY IDEAS✅

NZDUSD Potential UpsidesHey Traders, in today's trading session we are monitoring NZDUSD for a buying opportunity around 0.60000 zone, NZDUSD is trading in an uptrend and currently is in a correction phase in which it is approaching the trend at 0.600000 support and resistance area.
Trade safe, Joe.

NZDUSD - LongWhen the market opens and the spreads die down. Will definitely be entering this trade to the upside.
We are still in a HTF bullish orderflow.
This is a great buy set up as we are at a very discounted price.
Lets see how It plays out

Falling towards major support level?NZD/USD is falling towards the support level which is an overlap support that aligns with the 78.6% Fibonacci projection and also slightly above the 127.2% Fibonacci extension and could bounce from this level to our take profit.
Entry: 0.5987
Why we like it:
There is an overlap support level that is slightly above the 127.2% Fibonacci extension and the also lines up with the 78.6% Fibonacci projection.
Stop loss: 0.5951
Why we like it:
There is a pullback support level.
Take profit: 0.6037
Why we like it:
There is a pullback resistance.
Enjoying your TradingView experience? Review us!
Please be advised that the information presented on TradingView is provided to Vantage (‘Vantage Global Limited’, ‘we’) by a third-party provider (‘Everest Fortune Group’). Please be reminded that you are solely responsible for the trading decisions on your account. There is a very high degree of risk involved in trading. Any information and/or content is intended entirely for research, educational and informational purposes only and does not constitute investment or consultation advice or investment strategy. The information is not tailored to the investment needs of any specific person and therefore does not involve a consideration of any of the investment objectives, financial situation or needs of any viewer that may receive it. Kindly also note that past performance is not a reliable indicator of future results. Actual results may differ materially from those anticipated in forward-looking or past performance statements. We assume no liability as to the accuracy or completeness of any of the information and/or content provided herein and the Company cannot be held responsible for any omission, mistake nor for any loss or damage including without limitation to any loss of profit which may arise from reliance on any information supplied by Everest Fortune Group.

NZDUSD Is Very Bearish! Short!
Take a look at our analysis for NZDUSD.
Time Frame: 1D
Current Trend: Bearish
Sentiment: Overbought (based on 7-period RSI)
Forecast: Bearish
The market is on a crucial zone of supply 0.601.
The above-mentioned technicals clearly indicate the dominance of sellers on the market. I recommend shorting the instrument, aiming at 0.588 level.
P.S
We determine oversold/overbought condition with RSI indicator.
When it drops below 30 - the market is considered to be oversold.
When it bounces above 70 - the market is considered to be overbought.
Disclosure: I am part of Trade Nation's Influencer program and receive a monthly fee for using their TradingView charts in my analysis.
Like and subscribe and comment my ideas if you enjoy them!

NZDUSD: Bearish Forecast & Outlook
The price of NZDUSD will most likely collapse soon enough, due to the supply beginning to exceed demand which we can see by looking at the chart of the pair.
Disclosure: I am part of Trade Nation's Influencer program and receive a monthly fee for using their TradingView charts in my analysis.
❤️ Please, support our work with like & comment! ❤️

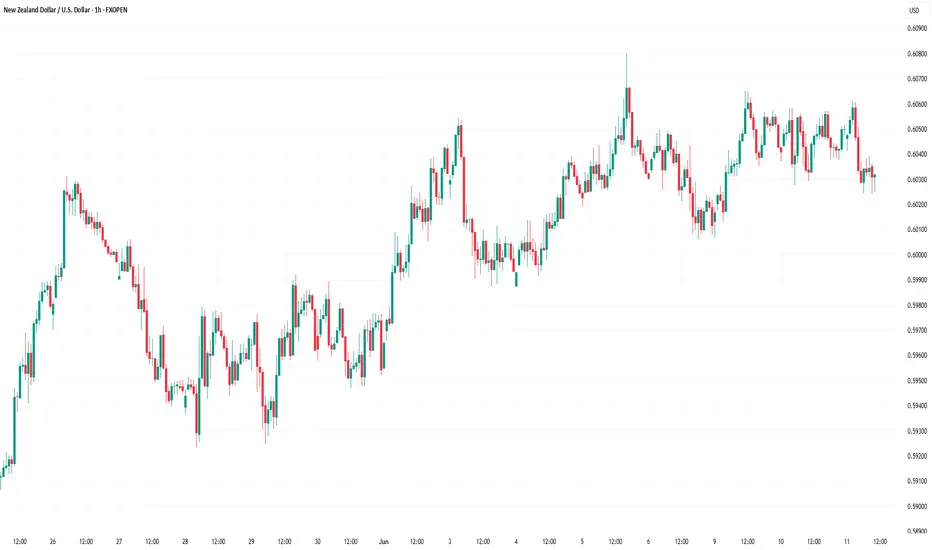
NZD/USD Aims Steady IncreaseNZD/USD Aims Steady Increase
NZD/USD is also rising and might aim for more gains above 0.6080.
Important Takeaways for NZD USD Analysis Today
- NZD/USD is consolidating gains above the 0.6030 zone.
- There is a key bullish trend line forming with support at 0.6030 on the hourly chart of NZD/USD at FXOpen.
NZD/USD Technical Analysis
On the hourly chart of NZD/USD on FXOpen, the pair started a steady increase from the 0.5990 zone. The New Zealand Dollar broke the 0.6020 resistance to start the recent increase against the US Dollar.
The pair settled above 0.6030 and the 50-hour simple moving average. It tested the 0.6065 zone and is currently consolidating gains. The pair corrected lower below the 0.6050 level and the 23.6% Fib retracement level of the upward move from the 0.6006 swing low to the 0.6064 high.
However, the bulls are active above the 0.6030 level. The NZD/USD chartsuggests that the RSI is stable near 50. On the upside, the pair might struggle near 0.6065. The next major resistance is near the 0.6080 level.
A clear move above the 0.6080 level might even push the pair toward the 0.6120 level. Any more gains might clear the path for a move toward the 0.6200 resistance zone in the coming days.
On the downside, immediate support is near the 0.6030 level. There is also a key bullish trend line forming with support at 0.6030. It is close to the 61.8% Fib retracement level of the upward move from the 0.6006 swing low to the 0.6064 high.
The first key support is near the 0.6005 level. The next major support is near the 0.5990 level. If there is a downside break below the 0.5990 support, the pair might slide toward the 0.5970 support. Any more losses could lead NZD/USD in a bearish zone to 0.5950.
This article represents the opinion of the Companies operating under the FXOpen brand only. It is not to be construed as an offer, solicitation, or recommendation with respect to products and services provided by the Companies operating under the FXOpen brand, nor is it to be considered financial advice.
Bullish bounce?The Kiwi (NZD/USD) is falling towards the pivot which acts as an overlap support and could bounce to the 1st resistance.
Pivot: 0.5989
1st Support: 0.5939
1st Resistance: 0.6060
Risk Warning:
Trading Forex and CFDs carries a high level of risk to your capital and you should only trade with money you can afford to lose. Trading Forex and CFDs may not be suitable for all investors, so please ensure that you fully understand the risks involved and seek independent advice if necessary.
Disclaimer:
The above opinions given constitute general market commentary, and do not constitute the opinion or advice of IC Markets or any form of personal or investment advice.
Any opinions, news, research, analyses, prices, other information, or links to third-party sites contained on this website are provided on an "as-is" basis, are intended only to be informative, is not an advice nor a recommendation, nor research, or a record of our trading prices, or an offer of, or solicitation for a transaction in any financial instrument and thus should not be treated as such. The information provided does not involve any specific investment objectives, financial situation and needs of any specific person who may receive it. Please be aware, that past performance is not a reliable indicator of future performance and/or results. Past Performance or Forward-looking scenarios based upon the reasonable beliefs of the third-party provider are not a guarantee of future performance. Actual results may differ materially from those anticipated in forward-looking or past performance statements. IC Markets makes no representation or warranty and assumes no liability as to the accuracy or completeness of the information provided, nor any loss arising from any investment based on a recommendation, forecast or any information supplied by any third-party.

Potential bearish drop off major resistance?NZD/USD has rejected off the resistance level which is a pullback resistance and could drop from this level to our take profit.
Entry: 0.6061
Why we like it:
There is a pullback resistance level.
Stop loss: 0.6080
Why we like it:
There is a pullback resistance level.
Take profit: 0.6010
Why we like it:
There is a pullback support level.
Enjoying your TradingView experience? Review us!
Please be advised that the information presented on TradingView is provided to Vantage (‘Vantage Global Limited’, ‘we’) by a third-party provider (‘Everest Fortune Group’). Please be reminded that you are solely responsible for the trading decisions on your account. There is a very high degree of risk involved in trading. Any information and/or content is intended entirely for research, educational and informational purposes only and does not constitute investment or consultation advice or investment strategy. The information is not tailored to the investment needs of any specific person and therefore does not involve a consideration of any of the investment objectives, financial situation or needs of any viewer that may receive it. Kindly also note that past performance is not a reliable indicator of future results. Actual results may differ materially from those anticipated in forward-looking or past performance statements. We assume no liability as to the accuracy or completeness of any of the information and/or content provided herein and the Company cannot be held responsible for any omission, mistake nor for any loss or damage including without limitation to any loss of profit which may arise from reliance on any information supplied by Everest Fortune Group.

NZDUSD Potential UpsidesHey Traders, in today's trading session we are monitoring NZDUSD for a buying opportunity around 0.60350 zone, NZDUSD is trading in an uptrend and currently is in a correction phase in which it is approaching the trend at 0.60350 support and resistance area.
Trade safe, Joe.

A Detailed Technical, Fundamental, and Macro AnalysisNZD/USD Trading Plan: A Detailed Technical, Fundamental, and Macro Analysis
1. Technical Analysis:
The 30-minute chart of NZD/USD highlights key price action within a well-defined channel between crucial support and resistance levels:
Resistance (0.60769): The price is testing significant resistance around 0.60769. If this level is broken, the price could continue higher, indicating further upward momentum.
Support (0.60271): A strong support level is found at 0.60271. If the price retraces and holds this level, a potential rebound could take place.
EMA (Exponential Moving Averages):
EMA 13 (Blue): Currently moving upwards, confirming a bullish short-term trend.
EMA 34 (Yellow) and EMA 89 (Red): These are trending sideways, suggesting that the market is in a consolidation phase, waiting for further signals.
2. Fundamental Analysis:
FED's Monetary Policy: The actions and statements of the Federal Reserve regarding interest rates have a significant impact on the USD. If the FED maintains or hikes rates, this could push the USD higher, putting downward pressure on NZD.
New Zealand Economic Indicators: The strength of New Zealand's economy, particularly export data, plays a vital role in supporting or weakening the NZD. Positive economic reports could support a bullish NZD.
3. Macroeconomic Analysis:
Global Risk Sentiment: Market sentiment is being influenced by global factors like trade tensions, economic growth projections, and political factors. A shift in risk sentiment, especially regarding the U.S. economy or geopolitical tensions, could lead to significant price movements in the NZD/USD pair.
4. Buy and Sell Zones:
BUY ZONE:
Entry: 0.60271 - 0.60300
SL (Stop Loss): 0.60200
TP (Take Profit): 0.60700 → 0.60769 → 0.60900
SELL ZONE:
Entry: 0.60750 - 0.60800
SL: 0.60900
TP: 0.60300 → 0.60200 → 0.60100
5. Strategy:
Buy Orders: If price consolidates at the support level of 0.60271 and shows confirmation with EMA indicators, consider a buy with a target at 0.60769.
Sell Orders: If price fails to break through the resistance at 0.60769, a sell order could be placed, targeting the 0.60271 support level.
6. Market Sentiment:
The market is highly sensitive to news and economic reports, and therefore, it is essential to remain alert to potential volatility. Any major economic release from New Zealand or U.S. Federal Reserve news could significantly influence the pair.
