NZD/USD BUY SIGNALHey tradomaniacs,
welcome to a free trade-setup.
Buy-Limit: 0,66870
Stop-Loss: 0,66600
Take-Profit: 0,67395
Stop-Loss: 27 pips
Risk: 0,5% - 1%
Risk-Reward: 1,90
LEAVE A LIKE AND A COMMENT - I appreciate every support! =)
Peace and good trades
Irasor
Wanna see more? Don`t forget to follow me.
Any questions? PM me. :-)
Nzdusdforecast

NZD/USD looks BULLISHHey tradomaniacs,
NZD/USD looks bullish to me as downtrendline and key-resistance-zone is violated and bulls are showing more volume after the previous breakout.
CoT-Data are currently mixed but are showing an increase of NET-LONG-POSITIONS of Hedge-Fonds and other institutional traders.
LEAVE A LIKE AND A COMMENT - I appreciate every support! =)
Peace and good trades
Irasor
Wanna see more? Don`t forget to follow me.
Any questions? PM me. :-)

NZD/USD WEEKLY FORECAST Hello Traders, here is the full analysis for this pair, let me know in the comment section below if you have any questions, the entry will be taken only if all rules of the strategies will be satisfied. I suggest you keep this pair on your watchlist and see if the rules of your strategy are satisfied

NZDUSD short set upNZDUSD is setting up for a good short soon. Will see how it reacts to the trend line for a possible triple tap to the bottom. If it breaks trend will wait for the double top, which aligns with the next key resistance level for an added confluence for my short idea. Pair will probably be ready by end of this week or next week.


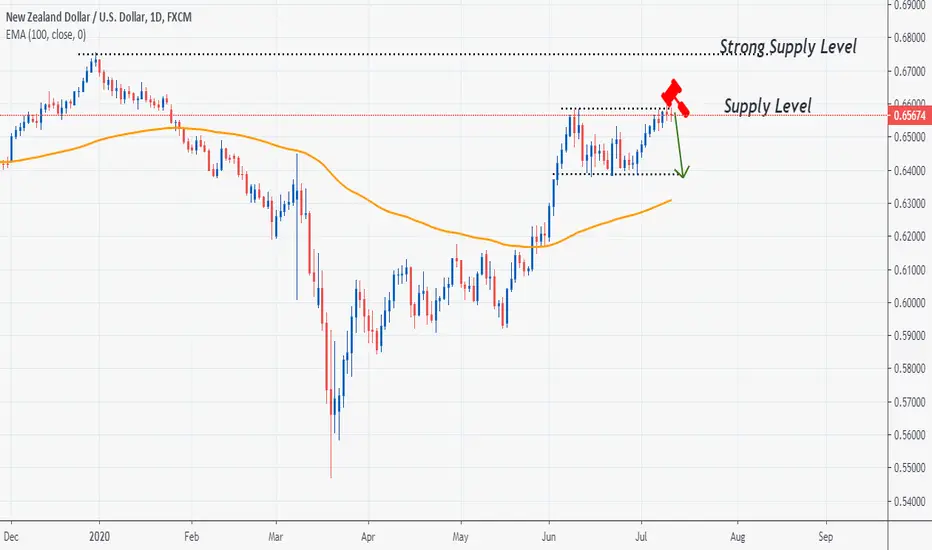
NZD/USD: Bulls fail to break the 0.66 key level againNZD/USD bulls have failed to break the 0.66 level once again. However, the bears couldn't take advantage of this. All though the chances of a drop towards 0.64 is increasing, waiting for a clear break of the 0.6550 level is important for the sellers.
How NZD/USD will move this week depends a lot on the state of the global equities. So, keep an eye on the global stock markets. If the stocks start bleeding this week, there's a high chance that NZD/USD may drop.
NZDUSD H4 SHORT PRICE ACTION FORECAST Price has gotten a rejection from a strong level by a trendline from a high timeframe, forming a double top from previous high wit a lack on any fresh HH; it allows the setup of a short entry.
The order:
Type: sell-stop
S/L: 60 pips - R:R | 1:2.3 -
T/P: aiming towards the support level
--
*** If you like the idea, don't be shy, click on like and comment. If you do not agree, just comment ;-) | Thanks for your support!!! ***

NZDUSD - ANOTHER PAIR FALLINGAgain, im waiting for price to cleanly break support then we can sell to the target area
We can see price has tested this area several times and been rejected but I anticipate the next break should be the sell signal

NZDUSDGOOD LUCK
-----------------------
Disclaimer: Forex trading and trading in other leveraged products involves a significant level of risk and is not suitable for all investors.


NZDUSD | WEEKLY FORECASTA similar situation for the Greenback we have found here as a possible Breakout off of our Bullish Rectangle @ 0.65200 for a Bullish burst becomes feasible.
Tendency: Uptrend ( Bullish )
Structure: Breakout | Bullish Rectangle | Channel
Observation: i. 0.63800 level appears to be a respected Demand zone ( 500 retracement ) since the Impulse Leg in the last days of May 2020.
ii. A Flat Channel is observed as price ranged between 0.63800 and 0.65200 throughout the month of June 2020.
iii . A rectangle pattern where supply and demand are in approximate balance for an extended period of time followed by a Breakout is a sign we are looking for to buy.
iv. Notice how Breakout of Bearish Trendline coincides with Breakout of Channel.
v. Patience is hereby required as a possible correction before the rally is very possible at this juncture.
Trading plan: BUY confirmation with a minimum potential profit of 300 pips.
Risk/Reward: 1:3
Potential Duration: 1 to 7 days
NB: This speculation can be considered to make decisions on lower timeframes.
Watch this space for updates as price action is been monitored.
Nirvana! Forex
Risk Disclaimer:
Margin trading in the foreign exchange market (including foreign exchange trading, CFDs, etc.) has a high risk and is not suitable for all investors. The content of this speculation (including all data) is organized and published by me for the sole purpose of education and assistance in making independent investment decisions. All information herein is for your reference only and NFTI takes no responsibility.
You are hereby advised to carefully consider your investment experience, financial situation, investment objective, risk tolerance level and consult your independent financial adviser as to the suitability of your situation prior to making any investment.
NFT&I does not guarantee its accuracy and is not liable for any loss or damage which may result directly or indirectly from such content or the receipt of any instruction or notification therewith.
Past performance is not necessarily indicative of future results.

BREAKOUT SELLWe are waiting for price to break through support and sell to the green area, at present it is consolidating

NZDUSD H4 SHORT PRICE ACTION FORECAST Price action has been trading within a consolidation range, finding resistance a the top level from the channel at H4. This current level is also in confluence with a descending trendline from a bigger time frame, confirming the downward pressure suffer by the price, a short entry with the following setup is placed
The order:
Type: buy-stop
S/L: 49 pips - R:R | 1:2.5 -
T/P: aiming towards the support level.
--
*** If you like the idea, don't be shy, click on like and comment. If you do not agree, just comment ;-) | Thanks for your support!!! ***


NZDUSD: Daily; Long!Note: Idea is to complement your research.
Check comments section for future updates on idea.
Like this idea? Like, Share, Follow, (...) Thank you and Happy Trading.

NZDUSD swingSo many confluences to make me go short on this, third tap on the inner structure trend line with the possibility for a retest on the outer trend line, trading at a key resistance area and at the .786 fib retracement. Will be shorting at a retest of the fib or the trend line. if it gets there corrective it will only add more confluence to go short. Will be targeting the low of the wick as wicks needs to be filled for a target of 1200 pips, then to either of the two fib extensions after that. This is a swing trade so going to be holding this trade for a while upon entry

NZDUSD H1 LONG PRICE ACTION FORECAST Price action has been trading sideways from H4 perspective, currently into a mild bullish trend, price is looking to a pullback to retest the ascending trendline in H1 to further bullish continuation.
The order:
Type: buy-limit.
S/L: 20 pips - R:R | 1:2.5 -
T/P: target next resistance level
--
*** If you like the idea, don't be shy, click on like and comment. If you do not agree, just comment ;-) | Thanks for your support!!! ***

NZDUSD - SELL (K.I.S.S - Keep It Simple Stupid!)As you can see most pairs follow the same patterns.. this is no different
The USD is going to fall as we can see from GBPUSD - This pair is showing the same setup!
Once support is broken use the signal below
NZDUSD - SELL
SL - 0.65103
TP - 0.62006

Short $NZDUSD against .6500 for a test of .6200Hello Sophisticated Trader,
The $NZDUSD has a similar setup with the $AUDUSD, coupled with the renewed dollar strength that could potentially make this pair an attractive sell for a test of .6200. Any retest of .6500 would support a short and only a break and close above recent high would negate the potential test.
Remember to buy on support and sell on resistance.
Minimize your risk and Maximize your profits.
Like, Comment, and Follow.
Let's Make Money Together!
Happy Trading!
Dr. Lydia Smith
As a Sophisticated trader, we teach you what you need to know about trading.

NZDUSD Sell SetupEnjoy a free signal before the week gets started
Feedback, Likes, comments, and shares would be appreciated.
We have reached a major daily s/r area where market historically has had steep reversals
This would be a great opportunity to catch the trend reversal
Also we have 2 major monthly downtrend and uptrend lines colliding
Market has respected the monthly downtrend line, soon as it reached we saw a rejection twice
then market fell below the monthly uptrend line, came back up to retest and saw a rejection
We have broke and closed below the 12hr uptrend line
I want to to market go up and test my major 3hr s/r area
Currently we are just waiting for the best entry our chances look good.
NZDUSD FX:NZDUSD
Sell Limit: 0.6500 (Best entry takes the most patience)
Stop loss: 0.6560 (60 pips risk)
Take profit: 0.6275 (225 pips reward)
Risk: 1% to 3% of account (recommended)
Reward/Risk: 3.75 (225/60)
Sell Stop: 0.6465 (Only when market goes above this price will you be able to execute this order or you can use a sell limit)
Stop loss: 0.6560 (95 pips risk)
Take profit: 0.6275 (190 pips reward)
Risk: 1% to 3% of account (recommended)
Reward/Risk: 2.00 (190/95)

NZDUSD SHORTThe US dollar has been making a slow recovery, especially if you look at the DXY. A lot of my USD pairs I'm in short this week. Anyways, This pair has impulsed down and making a flag formation, it could either go up or down. On the daily it looks like the formation of a morning star to the upside. If it does will be looking for a short at the triple top area on the horizontal ray. Will be taking that trade if it correctively gets there, if it impulses with high momentum, I will be sitting on my hands waiting for another set up. The more probable move is the continuous bear flag formation where ill be taking a trade at the top of the trend line either on the 2nd or 3rd tap, depending how it moves for the impulsive downside move.
