Nzdusdforecast

NZDUSD WAS FORMED HEAD AND SHOULDER PATTERN NZDUSD IS FORMING HEAD AND SHOULDER AND IT IS GOING RETEST TO RESISTANCE LEVEL THAN IT MAY DROP

NEW ZEALAND DOLLAR / U.S. DOLLAR (NZDUSD) DailyThe Djinn Predictive Indicators are simple mathematical equations. Once an equation is given to Siri the algorithm provides the future price swing date. The Djinn Indicators work on all charts, for any asset category and in all time frames.
Dates in the future with the greatest probability for a price high or price low.

NEW ZEALAND DOLLAR / U.S. DOLLAR (NZDUSD) WeeklyThe Djinn Predictive Indicators are simple mathematical equations. Once an equation is given to Siri the algorithm provides the future price swing date. The Djinn Indicators work on all charts, for any asset category and in all time frames.
Dates in the future with the greatest probability for a price high or price low.


NZDUSD: short it if...Possible Short trade on #NZDUSD
We have to wait for the Elliot wave to be confirmed in point 5.
As 0.62 touched (that's Fibo 61% and a Strong Resistance) we can go short BUT let the price breaks the trendline first.
---
Entry 0.62
SL 0.62575
TP 0.5905

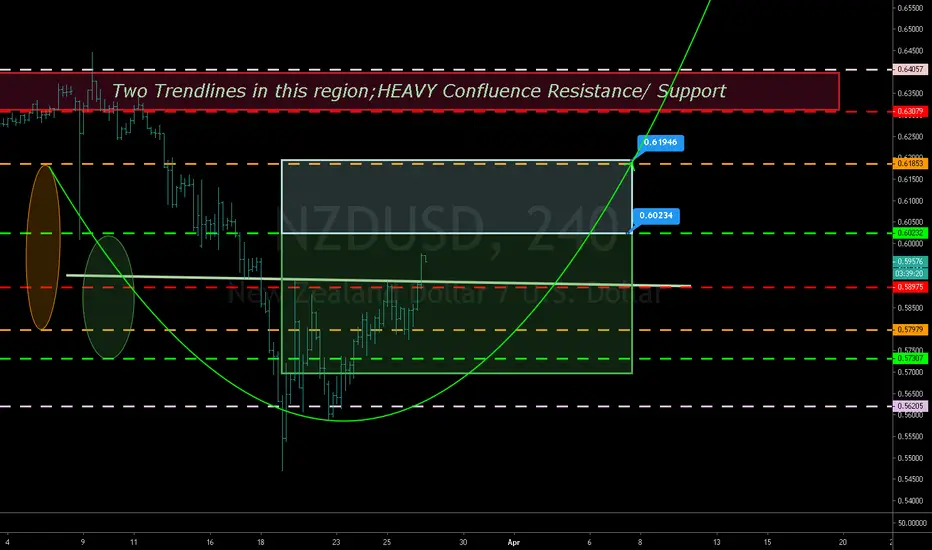
NZDUSD clear short setup#NZDUSD completed the Elliot Pattern, on point 5 touched the 61.8% of FIbo the started the bearish movement that first broke the trendline and then retested it.
-----
Entry Now
SL 0.6022
TP 0.58
-----

NZDUSD LONG! 4HR!Note: Idea is to complement your research.
Check comments section for future updates on idea.
Like this idea? Like, Share, Follow (...)
Thank you and Happy trading.
NZDUSD H1 Sell/ShortWe can see a triangle pattern forming on the H1 chart in NZDUSD
We can enter in this trade two ways in a short position
1. Entry at Reversal from the trend resistance and see if it breaks downside, if it breaks downside there is a minor support which can push the price up from there, then we will exit the trade with 3% profit and if it breaks the support also then we will exit the trade in Target 2 with 7.50% profit.
Stop Loss : 2%
Profit Target : 3% < 7.50%
2. This trade will be possible if the price breaks downside the triangle and supported by the Minor support then a retest to the trend support but couldn't break it, then we can enter a short position and exit with 6% profit, in this trade the Stop-Loss should be 0.80%
Stop Loss : 0.80%
Profit Target : 6%
👍

NZDUSD LONG! 4Hr; Confirm DXY Vs NZD For Long
Idea compliments a previously published idea.
Note: Idea is to complement your research.
Check comments section for future updates on idea.
Like this idea?
Like, Share, Follow, and Support channel for future content.
Thank you and happy trading.

NZDUSD LONG: 1HR TARGETSNote: Idea is to complement your research.
Idea follows previous published idea.
Check comments section for future updates on idea.
Like this idea?
Like, Share, Follow, and Support channel for future content.
Thank you and happy trading.

NZDUSD LONG! 1HR HEADED TO TARGET 1, WEAKENING DXYNote: Idea is to complement your research.
Idea follows earlier 0.55429 Buy-Zone Idea
Check comments section for future updates on idea.
Like this idea?
Like, Share, Follow, and Support channel for future content.
Thank you and happy trading.

NZDUSD LONG! 4HR ANGLE ONLY; UNREALIZED ANGLE Sometimes 4Hrs tells it all.
Note: Idea is to complement your research.
Check comments section for future updates on idea.
Like this idea?
Like, Share, Follow, and Support channel for future content.
Thank you and happy trading.

NZDUSD LONG! Is Down-side done, Or Is Down-Side Done!
Note: Idea is to complement your research.
Check comments section for future updates on idea.
Like this idea?
Like, Share, Follow, and Support channel for future content.
Thank you and happy trading.

NZDUSD LONG! What's left of Buy-Levels on DailyNZDUSD Index is testing very deep on Buy-Zones; three more levels to the downside due for test depending on DXYs' strength.
Note: This Idea is to complement your research.
Check comments section for future updates on idea.
Like this idea?
Like, Share, Follow, and Support channel for future content.
Thank you and happy trading

NZDUSD LONG! A Possibility! Current test at 0.61853/ 0.61802Follow through with previous Ideas for general overview.
Trend-line not included on chart cuts between 0.63397 and 0.63666
Check comments section for future updates on idea.
Like this idea?
Like, Share, Follow, and Support this channel for yet better content.


NZDUSD has potential to go up for 300 pips!currently we are seeing price inside a bearish trend channel and rejecting previous weekly support level, we need to wait for weekly candle close to see market bias more clearly and also for confirmed our double bottom formation is real, we have 300 pips room to go up if buyer manage to hold and push price to the 0.6570 resistance level. be patient!
**Disclaimer** the content on this analysis is subject to change at any time without notice, and is provided for the sole purpose of assisting traders to make independent investment decisions.
Traders!! if you like my ideas and do take the same trade like i do, please write it in comment so we can manage the trade together.
_____________________________________________________________________________________________________________________
Thank you for your support ;)
GWBFX


NZDUSD LONG! --Lag zone in Purple; See earlier IdeaCheck comments section for future updates on idea.
Like this idea?
Like, Share, Follow, and Support this channel for yet better content.
Thank you and
Happy Trading


NZD/USD, Trading plan for next week.In this video, u will learn where u can open accurate entry on next week.
Write in the comments all your questions and instruments analysis of which you want to see.
Friends push the like button if you like the idea - that would be the best THANK YOU.
Thank you for your support, I Love it.

NZDUSD has potential to go up for 230 pips!Main structure remain bearish but we can see price is on weekly support level and has potential to form a double bottom formation if demand is able to exceed supply at this level, we need to wait for the price to decelerate and must ensure that the long call signal is valid before placing any buy order. be patient!
**Disclaimer** the content on this analysis is subject to change at any time without notice, and is provided for the sole purpose of assisting traders to make independent investment decisions.
Traders!! if you like my ideas and do take the same trade like i do, please write it in comment so we can manage the trade together.
_____________________________________________________________________________________________________________________
Thank you for your support ;)
GWBFX
