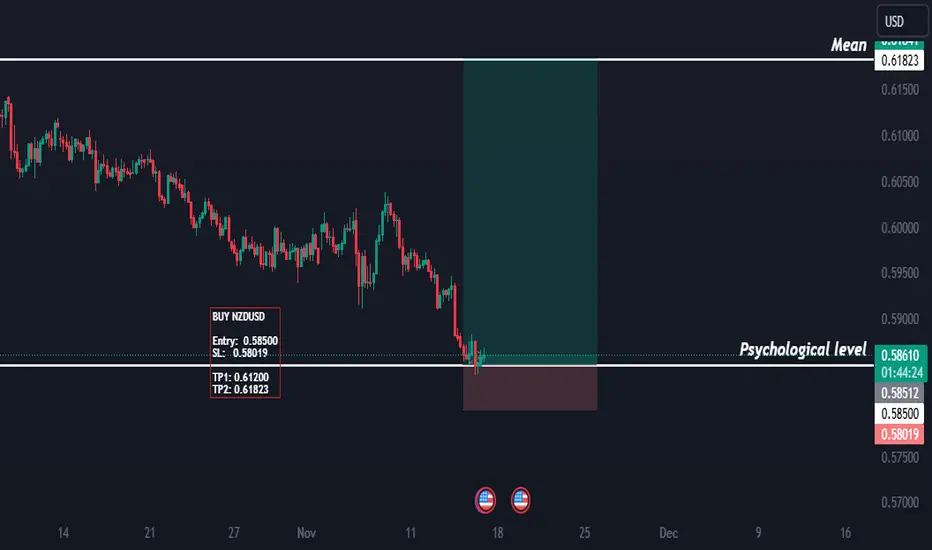
nzdusd buy signal. Don't forget about stop-loss.
Write in the comments all your questions and instruments analysis of which you want to see.
Friends, push the like button, write a comment, and share with your mates - that would be the best THANK YOU.
P.S. I personally will open entry if the price will show it according to my strategy.
Always make your analysis before a trade
Nzdusdforecast

NZDUSD TRADE IDEA : SHORT | SELL (13/01/25)Very nice and easy setup. Nothing fancy with the opportunity of doubling the RR.
Following the order flow - no forcing whatsoever - I decided that the sell made most sense. Entry makes sense with the break of structure coming at the hands of a clear heavy imbalance.
RR1: 2.48
RR2: 4.21

NZDUSD Scenario 2.1.2025This analysis is just a clarification of the previous analyses. We are creating an sfp below the low, which could indicate some potential space for a long setup, but I am keeping some space for now. If the sfp is confirmed, I will take a long first tp around the price. If we get above the weekly level, which is at 0.56550, it is around 0.57920.

NZD/USD "The Kiwi" Forex Market Heist Plan on Bearish🌟Hi! Hola! Ola! Bonjour! Hallo!🌟
Dear Money Makers & Robbers, 🤑 💰
Based on 🔥Thief Trading style technical and fundamental analysis🔥, here is our master plan to heist the NZD/USD "The Kiwi" Forex market. Please adhere to the strategy I've outlined in the chart, which emphasizes short entry. Our aim is the high-risk Green Zone. Risky level, oversold market, consolidation, trend reversal, trap at the level where traders and bullish robbers are stronger. 👀 So Be Careful, wealthy and safe trade.💪🏆🎉
Entry 📉 : You can enter a Bearish trade at any point.
however I advise placing sell limit orders within a 15 or 30 minute timeframe. Entry from the most recent or closest high level should be in retest.
Stop Loss 🛑: Using the 4H period, the recent / nearest high level.
Goal 🎯: 0.55300
Warning⚠️ : Our heist strategy is incompatible with Fundamental Analysis news 📰 🗞️. We'll wreck our plan by smashing the Stop Loss 🚫🚏. Avoid entering the market right after the news release.
Based on the fundamental analysis 📰 🗞️ I would conclude that the NZD/USD (New Zealand Dollar/US Dollar) pair is: Bearish
Reasons:
Interest rate differential: The Reserve Bank of New Zealand's (RBNZ) interest rate (2.50%) is lower than the Federal Reserve's (Fed) interest rate (4.50%), making the NZD less attractive to investors.
Economic growth: New Zealand's GDP growth (1.5%) is slower than the US GDP growth (2.1%), which could lead to a stronger USD.
Trade balance: New Zealand's trade deficit (NZD 1.1 billion) is larger than the US trade deficit (USD 50 billion), which could put downward pressure on the NZD.
Commodity prices: New Zealand's economy is heavily reliant on commodity exports, and a decline in commodity prices could negatively impact the NZD.
However, it's essential to consider the following risks:
Global economic slowdown: A slowdown in global economic growth, particularly in China and the US, could negatively impact the USD and support the NZD.
RBNZ's monetary policy: The RBNZ's dovish stance and potential interest rate cuts could support the NZD.
US-China trade tensions: Escalating trade tensions between the US and China could lead to a decline in the USD and support the NZD.
Bearish Scenario:
Stronger US economic data, such as GDP growth and inflation, supports the USD
Decline in commodity prices, particularly dairy and meat, supports the USD
Please note that this is a general analysis and not personalized investment advice. It's essential to consider your own risk tolerance and market analysis before making any investment decisions.
Take advantage of the target and get away 🎯 Swing Traders Please reserve the half amount of money and watch for the next dynamic level or order block breakout. Once it is resolved, we can go on to the next new target in our heist plan.
Keep in mind that these factors can change rapidly, and it's essential to stay up-to-date with market developments and adjust your analysis accordingly.
💖Supporting our robbery plan will enable us to effortlessly make and steal money 💰💵 Tell your friends, Colleagues and family to follow, like, and share. Boost the strength of our robbery team. Every day in this market make money with ease by using the Thief Trading Style.🏆💪🤝❤️🎉🚀
I'll see you soon with another heist plan, so stay tuned 🫂

nzdusd buy signal. Don't forget about stop-loss.
Write in the comments all your questions and instruments analysis of which you want to see.
Friends, push the like button, write a comment, and share with your mates - that would be the best THANK YOU.
P.S. I personally will open entry if the price will show it according to my strategy.
Always make your analysis before a trade

Market Analysis: NZD/USD Sink Further, Losses Mount Market Analysis: NZD/USD Sink Further, Losses Mount
NZD/USD is also moving lower and might extend losses below 0.57350.
Important Takeaways for NZD/USD Analysis Today
- NZD/USD declined steadily from the 0.5790 resistance zone.
- There is a short-term bearish trend line forming with resistance at 0.5750 on the hourly chart of NZD/USD at FXOpen.
NZD/USD Technical Analysis
On the hourly chart of NZD/USD on FXOpen, the pair also followed a similar pattern and declined from the 0.5790 zone. The New Zealand Dollar gained bearish momentum and traded below 0.5765 against the US Dollar.
The pair settled below the 0.5755 level and the 50-hour simple moving average. Finally, it tested the 0.5735 zone and is currently consolidating losses.
Immediate resistance on the upside is near the 23.6% Fib retracement level of the downward move from the 0.5792 swing high to the 0.5736 low at 0.5750. There is also a short-term bearish trend line forming with resistance at 0.5750.
The next resistance is the 0.5765 level or the 50% Fib retracement level of the downward move from the 0.5792 swing high to the 0.5736 low. If there is a move above 0.5765, the pair could rise toward 0.5790.
Any more gains might open the doors for a move toward the 0.5810 resistance zone in the coming days. On the downside, immediate support on the NZD/USD chart is near the 0.5735 level.
The next major support is near the 0.5710 zone. If there is a downside break below 0.5710, the pair could extend its decline toward the 0.5665 level. The next key support is near 0.5640.
This article represents the opinion of the Companies operating under the FXOpen brand only. It is not to be construed as an offer, solicitation, or recommendation with respect to products and services provided by the Companies operating under the FXOpen brand, nor is it to be considered financial advice.

Update levels on NZDUSD scenario 11.12.24In this market I added levels and in general I partly reworked the entire analysis so far it looks like looking for SFP if the market finds it then it is likely that it will rebound and it will depend on how the market maintains the support if the price breaks through it then there is a long set option up if he keeps it then a short set up is quite possible.

nzdusd buy signal. Don't forget about stop-loss.
Write in the comments all your questions and instruments analysis of which you want to see.
Friends, push the like button, write a comment, and share with your mates - that would be the best THANK YOU.
P.S. I personally will open entry if the price will show it according to my strategy.
Always make your analysis before a trade

NZD/USD "The Kiwi" Forex Market Heist Plan on BullishHola! Ola! My Dear Robbers / Money Makers & Losers, 🤑 💰
This is our master plan to Heist NZD/USD "The Kiwi" Forex Market based on Thief Trading style Technical Analysis.. kindly please follow the plan I have mentioned in the chart focus on Long entry. Our target is Red Zone that is High risk Dangerous level, market is overbought / Consolidation / Trend Reversal / Trap at the level Bearish Robbers / Traders gain the strength. Be safe and be careful and Be rich.
Entry 📈 : Can be taken Anywhere, What I suggest you to Place Buy Limit Orders in 15mins Timeframe Recent / Nearest Low Point take entry should be in pullback.
Stop Loss 🛑 : Recent Swing Low using 2H timeframe
Target 🎯 : 0.59600
Attention for Scalpers : Focus to scalp only on Long side, If you've got a lot of money you can get out right away otherwise you can join with a swing trade robbers and continue the heist plan, Use Trailing SL to protect our money 💰.
Warning : Fundamental Analysis news 📰 🗞️ comes against our robbery plan. our plan will be ruined smash the Stop Loss 🚫🚏. Don't Enter the market at the news update.
Loot and escape on the target 🎯 Swing Traders Plz Book the partial sum of money and wait for next breakout of dynamic level / Order block, Once it is cleared we can continue our heist plan to next new target.
💖Support our Robbery plan we can easily make money & take money 💰💵 Follow, Like & Share with your friends and Lovers. Make our Robbery Team Very Strong Join Ur hands with US. Loot Everything in this market everyday make money easily with Thief Trading Style.
Stay tuned with me and see you again with another Heist Plan..... 🫂

NZDUSD Daily Analysis: Slight Bullish Bias as Commodity Prices NZDUSD Daily Analysis: Slight Bullish Bias as Commodity Prices and Risk Sentiment Favor the Kiwi 03/12/2024
Introduction
NZDUSD is expected to show a slight bullish bias today, driven by strengthening commodity prices, positive risk sentiment, and a weaker U.S. dollar. As the global market outlook improves and key economic factors align in favor of the New Zealand dollar (NZD), the pair is poised to continue its upward trajectory. This article outlines the fundamental and technical factors supporting the NZDUSD bullish outlook for today.
---
Key Drivers Influencing NZDUSD
1. Commodity Price Strength
New Zealand is a major exporter of agricultural products, and the recent uptick in global commodity prices—especially dairy and meat—has provided substantial support for the NZD. This rise in commodity prices boosts New Zealand’s export revenues, supporting the strength of the kiwi.
2. Risk-On Market Sentiment
The broader market sentiment has shifted towards a risk-on mood, with global equities showing signs of recovery. The improved appetite for riskier assets tends to favor currencies like the NZD, which is considered a commodity-linked and higher-yielding currency.
3. U.S. Dollar Weakness
The U.S. dollar continues to face downward pressure amid expectations of a dovish Federal Reserve. Market participants have reduced their expectations for further rate hikes, making the USD less attractive relative to other currencies. As a result, the NZD is benefiting from this USD weakness, further supporting the bullish outlook for NZDUSD.
4. Positive Economic Data from New Zealand
Recent data out of New Zealand has shown resilience in key sectors like manufacturing and employment. These economic fundamentals provide additional backing for the NZD and suggest that New Zealand’s economy is on solid footing compared to its global counterparts.
---
Technical Analysis
Moving Averages and RSI
NZDUSD is currently trading above its 50-day moving average, which indicates a continuation of the bullish trend. The Relative Strength Index (RSI) is hovering in neutral territory, signaling that the pair has room to move higher without being overbought.
MACD and Key Levels
The MACD indicator shows a positive momentum shift, with the pair holding above key support levels. Immediate resistance is seen at 0.6350, and a breakout above this level could lead to further gains toward 0.6400. On the downside, support is at 0.6300, which could provide a cushion in case of any pullbacks.
---
Conclusion
NZDUSD is likely to experience a slight bullish bias today, supported by rising commodity prices, favorable risk sentiment, and ongoing USD weakness. Traders should watch for further signs of upward momentum, particularly if the pair breaks through key resistance levels. However, caution is warranted as market sentiment can shift quickly.
---
SEO Tags:
- #NZDUSDforecast
- #NZDUSDanalysis
- #NZDUSDtechnicalanalysis
- #ForexTradingNZDUSD
- #NewZealandDollarOutlook
- #USDWeakness
- #NZDUSDtoday
- #ForexMarketAnalysis
- #NZDUSDprediction

NZDUSD Daily Analysis: Slight Bullish Bias Amid Improving !!NZDUSD Daily Analysis: Slight Bullish Bias Amid Improving Risk Sentiment and Commodity Support 02/12/2024
Introduction
The NZDUSD pair is anticipated to exhibit a slight bullish bias today as improving global risk sentiment and strong support from commodity prices bolster the New Zealand dollar (NZD). Meanwhile, ongoing U.S. dollar (USD) weakness provides an additional tailwind for the pair. In this article, we explore the key drivers influencing NZDUSD and outline potential scenarios for the day ahead.
---
Key Drivers Influencing NZDUSD
1. Improved Global Risk Sentiment
Investor sentiment has turned positive following easing concerns over global economic stability. Equity markets are rallying, and this risk-on environment benefits commodity-linked currencies like the NZD.
2. Strong Commodity Prices
New Zealand’s economy, heavily reliant on agricultural exports, is seeing support from rising prices in key commodities, including dairy and meat products. This uptick enhances the kiwi’s appeal in the forex market.
3. Weak U.S. Dollar Dynamics
The USD continues to lose ground as markets digest dovish comments from Federal Reserve officials. With expectations of rate hikes dwindling, the dollar faces downward pressure, making NZDUSD more attractive for bullish traders.
4. China’s Economic Recovery
China, a major trading partner for New Zealand, is showing signs of economic recovery. Improving Chinese manufacturing and export data support demand for New Zealand exports, adding to the kiwi's bullish outlook.
---
Technical Analysis
Moving Averages and RSI
NZDUSD is trading above its 50-day moving average, reinforcing its bullish momentum. The Relative Strength Index (RSI) remains in a neutral zone but shows upward movement, suggesting room for further gains.
MACD and Key Levels
The MACD indicator reflects positive momentum, with the pair approaching key resistance at 0.6250. A break above this level could target 0.6300, while immediate support is seen at 0.6200.
---
Conclusion
NZDUSD is poised for a slight bullish bias today, driven by improved risk sentiment, strong commodity prices, and a weakening U.S. dollar. Traders should monitor key resistance levels and upcoming economic data for potential market shifts.
---
SEO Tags:
- #NZDUSDforecast
- #NZDUSDanalysis
- #NZDUSDtechnicalanalysis
- #ForexTradingNZDUSD
- #NewZealandDollarOutlook
- #USDWeakness
- #NZDUSDtoday
- #ForexMarketAnalysis
- #NZDUSDprediction

NZDUSD Daily Analysis: Slight Bullish Bias Expected Amid Strong NZDUSD Daily Analysis: Slight Bullish Bias Expected Amid Strong NZ Data and Weak U.S. Dollar 29/11/2024
Introduction
The NZDUSD pair is expected to maintain a slight bullish bias today as positive economic data from New Zealand and continued weakness in the U.S. dollar provide upward momentum for the kiwi. Factors such as improved global risk sentiment and commodity price support further enhance the outlook for NZDUSD. This article examines the fundamental and technical drivers influencing the pair’s movement.
---
Key Drivers Influencing NZDUSD
1. Strong New Zealand Economic Data
Recent economic indicators from New Zealand, such as robust business confidence and a recovery in export volumes, are boosting the New Zealand dollar (NZD). These positive fundamentals reflect the resilience of New Zealand’s economy, supporting the kiwi’s strength against the greenback.
2. U.S. Dollar Weakness
The U.S. dollar (USD) remains subdued as dovish Federal Reserve expectations weigh on investor sentiment. Recent declines in U.S. consumer sentiment and weak durable goods orders reinforce market expectations of a prolonged rate pause, reducing demand for the USD.
3. Improved Risk Sentiment
Global markets are experiencing a rebound in risk appetite, favoring higher-yielding and commodity-linked currencies like the NZD. The easing of geopolitical tensions and stable equity markets are key contributors to the improved sentiment.
4. Rising Commodity Prices
As a commodity-driven currency, the NZD is benefiting from rising dairy and agricultural product prices, which are crucial to New Zealand’s export economy. This support further bolsters the kiwi’s bullish outlook.
---
Technical Analysis
Moving Averages and RSI
NZDUSD is trading above its 50-day moving average, signaling continued bullish momentum. The Relative Strength Index (RSI) is approaching overbought levels but remains supportive of further upside.
MACD and Key Levels
The MACD indicator remains in positive territory, affirming the bullish trend. Key resistance is at 0.6400, with immediate support at 0.6320. A breakout above resistance could see the pair targeting 0.6450 in the near term.
---
Conclusion
NZDUSD is likely to exhibit a slight bullish bias today, driven by strong New Zealand economic data, a weaker U.S. dollar, and favorable global conditions. Traders should watch for potential breakouts above resistance levels, while also staying alert to any changes in risk sentiment or economic releases.
---
SEO Tags:
- #NZDUSDforecast
- #NZDUSDanalysis
- #NZDUSDtechnicalanalysis
- #ForexTradingNZDUSD
- #NewZealandDollarOutlook
- #USDWeakness
- #NZDUSDtoday
- #ForexMarketAnalysis
- #NZDUSDprediction

NZDUSD Daily Analysis: Slight Bullish Bias Expected.NZDUSD Daily Analysis: Slight Bullish Bias Expected Amid Positive New Zealand Data and Weak U.S. Dollar 28/11/2024
Introduction
The NZDUSD pair is likely to maintain a slight bullish bias today as strong fundamentals from New Zealand and continued pressure on the U.S. dollar support the New Zealand dollar (NZD). Improved risk sentiment and rising commodity prices further enhance the outlook for the kiwi. This article explores the key drivers influencing NZDUSD today and provides insights for traders.
---
Key Drivers Influencing NZDUSD
1. Resilient New Zealand Economic Performance
New Zealand’s recent economic indicators, including steady retail sales growth and robust dairy export performance, continue to support the kiwi. The nation’s economic resilience bolsters investor confidence in the NZD against the greenback.
2. U.S. Dollar Weakness
The U.S. dollar (USD) remains under pressure as the Federal Reserve’s dovish tone dominates market sentiment. Weak economic data from the U.S., such as declining consumer confidence and softer inflation, reduces demand for the greenback.
3. Rising Commodity Prices
As a commodity-linked currency, the NZD benefits from rising global commodity prices. Positive momentum in agricultural and dairy prices strengthens the kiwi, further supporting the pair’s bullish outlook.
4. Improved Global Risk Sentiment
Global financial markets are seeing reduced volatility, and risk appetite is improving. This trend favors higher-yielding and risk-sensitive currencies like the NZD, providing additional upward momentum for NZDUSD.
---
Technical Analysis
Moving Averages and RSI
NZDUSD is trading above its 50-day moving average, suggesting continued bullish momentum. The Relative Strength Index (RSI) is in neutral territory but trending upward, indicating room for further gains.
MACD and Key Levels
The MACD indicator remains positive, reinforcing the bullish outlook. Key resistance is located at 0.6390, with immediate support at 0.6300. A breakout above resistance could push the pair toward 0.6450 in the near term.
---
Conclusion
NZDUSD is positioned for a slight bullish bias today, supported by strong fundamentals in New Zealand, weakness in the U.S. dollar, and favorable global conditions. Traders should monitor key levels and remain attentive to potential changes in sentiment or economic data releases that could impact the pair’s trajectory.
---
SEO Tags:
- #NZDUSDforecast
- #NZDUSDanalysis
- #NZDUSDtechnicalanalysis
- #ForexTradingNZDUSD
- #NewZealandDollarOutlook
- #USDWeakness
- #NZDUSDtoday
- #ForexMarketAnalysis
- #NZDUSDprediction

NZDUSD Daily Analysis: Slight Bullish Bias Expected Amid.NZDUSD Daily Analysis: Slight Bullish Bias Expected Amid Positive New Zealand Economic Indicators and Weak U.S. Dollar 27/11/2024
Introduction
The NZDUSD pair is expected to exhibit a slight bullish bias today, driven by robust economic conditions in New Zealand and continued weakness in the U.S. dollar. Favorable commodity prices and improving global risk appetite further bolster the case for the New Zealand dollar’s strength against the greenback. This article explores the fundamental and technical factors contributing to today’s NZDUSD outlook.
---
Key Drivers Influencing NZDUSD
1. Strong New Zealand Economic Data
Recent economic releases from New Zealand, including steady business confidence and resilient trade figures, support the New Zealand dollar (NZD). The agricultural export sector, particularly dairy, continues to perform well, providing a solid base for the kiwi dollar.
2. Weakening U.S. Dollar
The U.S. dollar (USD) faces sustained pressure as dovish Federal Reserve expectations dominate market sentiment. Soft economic data from the U.S., including declining consumer spending and slowing inflation, reduce demand for the greenback.
3. Commodity Price Momentum
As a commodity-linked currency, the New Zealand dollar benefits from rising global commodity prices. Positive trends in dairy and agricultural products further enhance NZD’s attractiveness.
4. Improved Risk Sentiment
Global markets are showing signs of stabilization, with diminishing concerns about geopolitical tensions and economic slowdowns. This improved risk appetite boosts demand for higher-yielding and risk-sensitive currencies like the NZD.
---
Technical Analysis
Moving Averages and RSI
NZDUSD is trading above its 50-day moving average, reinforcing the bullish sentiment. The Relative Strength Index (RSI) indicates upward momentum but remains below overbought territory, suggesting further room for gains.
MACD and Key Levels
The MACD indicator remains in positive territory, showing continued bullish momentum. Key resistance is situated at 0.6370, while support lies at 0.6280. A breakout above resistance could see the pair targeting higher levels near 0.6450.
---
Conclusion
The NZDUSD pair is positioned for a slight bullish bias today, supported by strong fundamentals from New Zealand, a weaker U.S. dollar, and favorable commodity price trends. Traders should watch for any shifts in global market sentiment or unexpected data releases that may influence short-term price movements.
---
SEO Tags:
- #NZDUSDforecast
- #NZDUSDanalysis
- #NZDUSDtechnicalanalysis
- #ForexTradingNZDUSD
- #NewZealandDollarOutlook
- #USDWeakness
- #NZDUSDtoday
- #ForexMarketAnalysis
- #NZDUSDprediction

NZDUSD Daily Analysis: Slight Bullish Bias Expected Amid Robust NZDUSD Daily Analysis: Slight Bullish Bias Expected Amid Robust New Zealand Economic Data and Weakening U.S. Dollar 26/11/2024
Introduction
The NZDUSD currency pair is expected to maintain a slight bullish bias today, driven by favorable economic data from New Zealand, a weaker U.S. dollar, and improved global risk sentiment. Rising commodity prices and technical indicators further support a positive outlook for the kiwi dollar against the greenback. Below, we delve into the fundamental and technical drivers shaping NZDUSD’s movements.
---
Key Drivers Influencing NZDUSD
1. New Zealand’s Economic Resilience
New Zealand's economy continues to showcase strength, supported by upbeat business confidence and robust export performance. Recent data highlighting strong dairy exports and stable consumer sentiment have increased demand for the New Zealand dollar (NZD), providing a bullish foundation for the pair.
2. Weaker U.S. Dollar
The U.S. dollar (USD) remains under pressure amid softening Federal Reserve rate hike expectations. Recent U.S. economic data, including weaker retail sales and slowing inflation, have heightened expectations of a prolonged dovish stance from the Fed, reducing demand for the dollar.
3. Commodity Price Support
As a commodity-linked currency, the New Zealand dollar benefits from rising global commodity prices, particularly in the agricultural and dairy sectors. This trend enhances the NZD’s appeal, reinforcing the bullish sentiment for NZDUSD.
4. Improved Global Risk Sentiment
A more stable geopolitical landscape and improving global economic conditions have led to a renewed appetite for riskier assets. The high-beta NZD is particularly well-positioned to gain in such an environment, further driving the pair’s upward momentum.
---
Technical Analysis
Moving Averages and RSI
NZDUSD is trading above its 50-day moving average, a clear signal of continued bullish momentum. The Relative Strength Index (RSI) remains in positive territory but has yet to reach overbought levels, suggesting potential for further upside.
MACD and Key Levels
The MACD indicator shows a bullish crossover, confirming upward momentum. Key resistance is located at 0.6350, with support at 0.6250. A sustained break above the resistance level could open the path for additional gains.
---
Conclusion
The combination of robust New Zealand economic performance, weakening U.S. dollar, rising commodity prices, and improved risk sentiment supports a slight bullish bias for NZDUSD today. Traders should keep an eye on upcoming U.S. economic releases and global market developments for potential volatility.
---
SEO Tags:
- #NZDUSDforecast
- #NZDUSDanalysis
- #NZDUSDtechnicalanalysis
- #ForexTradingNZDUSD
- #NewZealandDollarStrength
- #USDWeakness
- #NZDUSDtoday
- #ForexMarketOutlook
- #NZDUSDprediction

NZDUSD Daily Analysis: Slight Bullish Bias Expected Amid Strong NZDUSD Daily Analysis: Slight Bullish Bias Expected Amid Strong New Zealand Data and Weakening U.S. Dollar 25/11/2024
Introduction
NZDUSD is anticipated to maintain a slight bullish bias today, driven by positive domestic data from New Zealand, rising commodity prices, and ongoing weakness in the U.S. dollar. Favorable global risk sentiment and technical indicators further bolster the upward momentum for the currency pair. In this analysis, we’ll break down the fundamental and technical factors contributing to this outlook.
---
Key Drivers Influencing NZDUSD
1. Strong New Zealand Economic Indicators
Recent reports indicate resilience in New Zealand's economic activity, with steady growth in exports and a robust labor market. Improving consumer confidence and steady business activity have also enhanced demand for the New Zealand dollar (NZD), supporting its bullish stance against the U.S. dollar (USD).
2. Weak U.S. Dollar Under Pressure
The USD continues to face downward pressure as the Federal Reserve maintains a dovish tone regarding future interest rate hikes. Recent U.S. data, including subdued retail sales and easing inflation, reinforce expectations that the Fed will keep monetary policy accommodative. This weakens the USD, giving the NZD a comparative edge.
3. Commodity Price Strength
New Zealand’s economy is heavily reliant on its commodity exports, particularly dairy. Rising global dairy prices and increased demand for agricultural products have bolstered the NZD, further supporting the bullish outlook for NZDUSD.
4. Positive Risk Sentiment
Global markets are showing signs of risk appetite, favoring high-beta currencies like the NZD. With geopolitical tensions stabilizing, investors are more willing to invest in riskier assets, providing an additional tailwind for the kiwi.
---
Technical Analysis
Moving Averages and RSI
NZDUSD remains above its 50-day moving average, reflecting sustained bullish momentum. The Relative Strength Index (RSI) is trending upwards but is still below the overbought level of 70, signaling room for further gains.
MACD and Key Levels
The MACD indicator highlights a bullish crossover, confirming upward momentum. Immediate resistance for NZDUSD is at 0.6300, while key support lies at 0.6200, providing a defined trading range for the day.
---
Conclusion
Positive domestic data, strengthening commodity prices, and a weakening U.S. dollar set the stage for NZDUSD to maintain a slight bullish bias today. Traders should closely monitor any developments in global risk sentiment and key U.S. economic releases, which could influence market dynamics.
---
SEO Tags:
- #NZDUSDforecast
- #NZDUSDanalysis
- #NZDUSDtechnicalanalysis
- #ForexTradingNZDUSD
- #NewZealandDollarStrength
- #USDWeakness
- #NZDUSDtoday
- #ForexMarketOutlook
- #NZDUSDprediction

NZDUSD Daily Analysis: Slight Bullish Bias Expected Amid Strong NZDUSD Daily Analysis: Slight Bullish Bias Expected Amid Strong New Zealand Data and Weak U.S. Dollar 22/11/2024
Introduction
NZDUSD is likely to exhibit a slight bullish bias today, underpinned by resilient New Zealand economic fundamentals, firm commodity prices, and continued softness in the U.S. dollar. Risk sentiment in global markets and technical indicators also align with the pair's upward momentum. This article examines the key drivers influencing NZDUSD and offers insights to help traders capitalize on today’s market dynamics.
---
Key Drivers Influencing NZDUSD Today
1. Robust New Zealand Economic Performance
New Zealand’s economy remains supported by solid export growth, particularly in dairy and other key commodities. Recent data reflecting improving consumer sentiment and a steady labor market have bolstered investor confidence in the New Zealand dollar (NZD). These factors provide a fundamental boost to NZDUSD.
2. Weakness in the U.S. Dollar
The U.S. dollar (USD) continues to face downward pressure as market participants anticipate a prolonged pause in Federal Reserve rate hikes. Weaker-than-expected U.S. economic data, including lower retail sales and slowing inflation, have reinforced dovish expectations, reducing the appeal of the USD against higher-yielding currencies like the NZD.
3. Positive Risk Sentiment and Commodity Prices
Improved risk sentiment globally is benefiting high-beta currencies like the NZD. Rising commodity prices, particularly dairy, a cornerstone of New Zealand’s economy, further support the kiwi’s strength.
4. Technical Momentum Favoring Bulls
NZDUSD maintains its position above key technical support levels, with momentum indicators suggesting room for further gains.
---
Technical Analysis Indicators
Moving Averages and RSI
NZDUSD is trading comfortably above its 50-day moving average, reflecting sustained bullish momentum. The Relative Strength Index (RSI) is trending upward but remains below overbought levels, indicating scope for continued gains.
MACD and Support Levels
The MACD shows a bullish crossover, signaling upward momentum. Key resistance for the pair lies at 0.6250, while support is at 0.6150, providing a defined trading range for the day.
---
Conclusion
Supported by strong New Zealand fundamentals, weak U.S. dollar performance, and favorable risk sentiment, NZDUSD is poised to maintain a slight bullish bias today. Traders should keep an eye on upcoming U.S. economic releases and global risk developments that could influence the pair’s direction.
---
SEO Tags:
- #NZDUSDforecast
- #NZDUSDanalysis
- #NZDUSDtechnicalanalysis
- #ForexTradingNZDUSD
- #NewZealandDollarStrength
- #USDWeakness
- #NZDUSDtoday
- #ForexMarketOutlook
- #NZDUSDprediction

NZDUSD Daily Analysis: Slight Bullish Bias Expected Amid Strong NZDUSD Daily Analysis: Slight Bullish Bias Expected Amid Strong New Zealand Economic Outlook and Softer USD 21/11/2024
Introduction
NZDUSD is poised for a slight bullish bias today, driven by strong economic fundamentals from New Zealand and continued softness in the U.S. dollar. Factors such as positive risk sentiment, robust commodity prices, and dovish Federal Reserve expectations are supporting the New Zealand dollar (NZD) against the greenback. In this article, we delve into the fundamental and technical drivers that could shape NZDUSD’s trajectory in today’s forex market.
---
Key Drivers Influencing NZDUSD Today
1. Resilient New Zealand Economic Data
New Zealand’s economy continues to display resilience, supported by robust agricultural exports and improving business sentiment. Dairy prices, a critical component of the nation’s export sector, have seen consistent gains, providing a strong tailwind for the NZD. Additionally, a recovery in domestic demand is bolstering the economic outlook.
2. Weaker U.S. Dollar on Dovish Fed Sentiment
The U.S. dollar remains under pressure amid growing expectations that the Federal Reserve will maintain its dovish stance. Recent soft inflation readings and mixed U.S. economic data have strengthened the belief that the Fed will hold off on further rate hikes. This environment is reducing demand for the USD, creating a favorable setup for NZDUSD bulls.
3. Risk-On Sentiment Supporting High-Beta Currencies
A risk-on mood in global financial markets is providing support for high-beta currencies like the NZD. Equity markets are stabilizing, and optimism around global economic recovery is encouraging investors to seek higher-yielding assets. This trend enhances the attractiveness of the New Zealand dollar.
4. Technical Indicators Point to Bullish Momentum
Technically, NZDUSD remains above key support levels, with upward momentum visible in the RSI and MACD. The pair’s sustained position above its 50-day moving average further confirms its bullish bias.
---
Technical Analysis Indicators
Moving Averages and RSI
NZDUSD is comfortably trading above its 50-day moving average, indicating strong bullish momentum. The Relative Strength Index (RSI) is trending higher but remains below overbought levels, suggesting room for further gains.
MACD and Volume Trends
The MACD indicator reflects a bullish crossover, confirming upward momentum. Volume trends also show increased buying activity, supporting today’s bullish outlook.
---
Conclusion
With strong New Zealand economic fundamentals, a weaker U.S. dollar, and positive risk sentiment, NZDUSD is likely to maintain a slight bullish bias today. Traders should watch for any surprises in U.S. economic data or shifts in market sentiment that could influence price action.
---
SEO Tags:
- #NZDUSDforecast
- #NZDUSDanalysis
- #NZDUSDtechnicalanalysis
- #ForexTradingNZDUSD
- #NewZealandDollarStrength
- #USDWeakness
- #NZDUSDtoday
- #ForexMarketInsights
- #NZDUSDprediction

NZDUSD Daily Analysis: Slight Bullish Bias Expected Amid Strong NZDUSD Daily Analysis: Slight Bullish Bias Expected Amid Strong NZ Economic Sentiment and USD Weakness 20/11/2024
Introduction
The NZDUSD pair is projected to maintain a slight bullish bias today, bolstered by favorable economic developments in New Zealand and a softer U.S. dollar. Positive commodity performance, improving risk sentiment, and dovish expectations surrounding the Federal Reserve’s monetary policy are key drivers shaping today’s price action. This analysis explores the fundamental and technical factors supporting NZDUSD and provides actionable insights for forex traders.
---
Key Drivers Influencing NZDUSD Today
1. Strong New Zealand Economic Performance
New Zealand’s economy continues to display resilience, underpinned by robust export growth and solid consumer confidence. Dairy exports, a cornerstone of the economy, have seen increasing global demand, further strengthening the New Zealand dollar (NZD). Additionally, a recent uptick in domestic retail sales highlights steady economic activity, supporting the NZD’s bullish trajectory.
2. Weakening U.S. Dollar Due to Fed’s Dovish Policy
The U.S. dollar remains under pressure as market participants price in expectations that the Federal Reserve will hold interest rates steady for the foreseeable future. Softer inflation data and mixed economic reports from the U.S. have dampened the dollar’s appeal, providing a favorable backdrop for NZDUSD to climb higher.
3. Risk-On Market Sentiment Favoring NZD
The current “risk-on” sentiment in global markets is benefiting risk-sensitive currencies like the NZD. Stabilizing equity markets, rising commodity prices, and reduced geopolitical tensions have increased investor confidence, leading to stronger demand for high-yielding assets.
4. Technical Indicators Suggest Upward Momentum
Technical indicators align with a bullish outlook for NZDUSD. The pair is trading above its 50-day moving average, signaling sustained upward momentum. Additionally, oscillators such as the MACD and RSI confirm the bullish trend, reinforcing the slight bullish bias for today’s trading session.
---
Technical Analysis Indicators
Moving Averages and RSI
NZDUSD continues to trade above its 50-day moving average, indicating strong upward momentum. The Relative Strength Index (RSI) is trending upwards but remains comfortably below overbought levels, suggesting further upside potential.
MACD and Volume Analysis
The MACD is firmly in bullish territory, showing a positive crossover that confirms upward momentum. Volume analysis indicates steady buying interest, which further supports the pair’s bullish outlook.
---
Conclusion
With a strong New Zealand economic outlook, dovish Federal Reserve policies, and favorable risk sentiment, NZDUSD is expected to maintain a slight bullish bias today. Traders should monitor any shifts in market sentiment or economic data re leases that could influence the pair’s movement.
---
SEO Tags:
- #NZDUSDforecast
- #NZDUSDanalysis
- #NZDUSDtechnicalanalysis
- #ForexTradingNZDUSD
- #NewZealandDollarStrength
- #USDWeakness
- #NZDUSDtoday
- #ForexMarketOutlook
- #NZDUSDprediction

NZDUSD Daily Analysis: Slight Bullish Bias Expected today!NZDUSD Daily Analysis: Slight Bullish Bias Expected Amid Positive New Zealand Economic Sentiment and USD Weakness 19/11/2024
Introduction
The NZDUSD pair is poised for a slight bullish bias today, driven by favorable economic conditions in New Zealand and continued softness in the U.S. dollar. Strong commodity prices, improved risk sentiment, and dovish signals from the Federal Reserve are supporting the upward momentum for the New Zealand dollar (NZD). This analysis highlights the fundamental and technical factors shaping NZDUSD’s movement, providing actionable insights for traders.
---
Key Drivers Influencing NZDUSD Today
1. Resilient New Zealand Economic Performance
New Zealand’s economy remains stable, with recent trade data reflecting robust export growth, particularly in agricultural commodities like dairy and meat. These exports underpin the NZD’s strength, as global demand supports the economy. Additionally, consumer confidence surveys and stable domestic consumption further enhance the bullish outlook for the NZD.
2. Dovish Federal Reserve Weakening the USD
The U.S. dollar has been under pressure as the Federal Reserve maintains a cautious stance on interest rate adjustments. Recent inflation data came in softer than expected, reinforcing market expectations that rate hikes are on hold. This dovish environment is eroding the USD’s strength, creating room for NZDUSD to rise.
3. Improved Risk Sentiment Boosting NZD
The NZD, as a risk-sensitive currency, benefits from the current “risk-on” market sentiment. Stability in global equity markets and stronger commodity prices, particularly in oil and industrial metals, have supported riskier assets. This favorable market sentiment boosts demand for the New Zealand dollar, contributing to its bullish trajectory against the USD.
4. Technical Indicators Supporting Bullish Momentum
From a technical perspective, NZDUSD remains above key support levels and is trending higher, supported by bullish indicators. The pair’s position above its 50-day moving average and a bullish MACD crossover are strong signals for continued upward movement.
---
Technical Analysis Indicators
Moving Averages and RSI
NZDUSD is trading above its 50-day moving average, reinforcing the bullish trend. The Relative Strength Index (RSI) is moving higher but remains below overbought territory, indicating additional upside potential without immediate risk of a pullback.
MACD and Volume Trends
The MACD has formed a bullish crossover, suggesting further upward momentum. Volume trends show consistent buying activity, aligning with the pair’s positive bias for today.
---
Conclusion
With a strong New Zealand economic outlook, dovish Federal Reserve signals, and improved global risk sentiment, NZDUSD is likely to maintain a slight bullish bias today. Traders should keep an eye on commodity price movements and any unexpected shifts in risk appetite that could impact the pair’s performance.
---
SEO Tags:
- #NZDUSDforecast
- #NZDUSDanalysis
- #NZDUSDtechnicalanalysis
- #ForexTradingNZDUSD
- #NewZealandDollarOutlook
- #USDWeakness
- #NZDUSDtoday
- #ForexMarketAnalysis
- #NZDUSDprediction

NZDUSD Daily Analysis: Slight Bullish Bias Expected Amid !NZDUSD Daily Analysis: Slight Bullish Bias Expected Amid Positive NZ Economic Sentiment and Weakening USD 18/11/2024
Introduction
The NZDUSD pair is anticipated to exhibit a slight bullish bias today, supported by positive economic sentiment in New Zealand and a softer U.S. dollar. As global risk appetite improves and dovish Federal Reserve expectations weigh on the USD, the New Zealand dollar (NZD) benefits from these favorable conditions. This article analyzes the key drivers influencing NZDUSD today and provides actionable insights for forex traders.
---
Key Drivers Influencing NZDUSD Today
1. Robust New Zealand Economic Outlook
New Zealand’s economy continues to show resilience, supported by strong performance in its export sectors, particularly agriculture and dairy. Recent retail sales data and business confidence surveys indicate steady economic growth, providing a favorable environment for the NZD. The Reserve Bank of New Zealand (RBNZ)’s cautious but optimistic policy stance further bolsters the currency, as traders see reduced downside risk.
2. Weaker U.S. Dollar Amid Dovish Fed Policy
The U.S. dollar has been under pressure following recent Federal Reserve commentary suggesting a pause in interest rate hikes. Softer inflation and mixed labor market data have led to a dovish outlook, diminishing the USD’s appeal globally. This environment provides room for NZD gains, as the U.S. dollar weakens relative to other currencies.
3. Improved Global Risk Sentiment
As a risk-sensitive currency, the NZD benefits when global risk appetite improves. Stability in equity markets and an uptick in commodity prices have increased demand for higher-yielding assets like the NZD. This “risk-on” sentiment supports a bullish outlook for NZDUSD, as traders move away from safe-haven assets.
4. Technical Indicators Supporting Bullish Momentum
From a technical perspective, NZDUSD is trading above its 50-day moving average, signaling continued upward momentum. Additionally, indicators such as the Relative Strength Index (RSI) and Moving Average Convergence Divergence (MACD) are aligned with a bullish trend, suggesting potential for further gains in today’s session.
---
Technical Analysis Indicators
Moving Averages and RSI
NZDUSD is well-positioned above its 50-day moving average, indicating sustained bullish momentum. The RSI is trending upwards but remains below overbought levels, signaling room for additional upside.
MACD and Volume Trends
The MACD shows a bullish crossover, confirming upward momentum in the pair. Volume analysis indicates consistent buying interest, further supporting today’s slight bullish bias.
---
Conclusion
Given New Zealand’s strong economic fundamentals, a dovish U.S. Federal Reserve, and improving global risk sentiment, NZDUSD is expected to maintain a slight bullish bias today. Traders should monitor any shifts in risk sentiment or unexpected economic data releases that could influence the pair’s movement.
---
SEO Tags:
- #NZDUSDforecast
- #NZDUSDanalysis
- #NZDUSDtechnicalanalysis
- #ForexTradingNZDUSD
- #NewZealandDollarOutlook
- #USDWeakness
- #NZDUSDtoday
- #ForexMarketAnalysis
- #NZDUSDprediction

NZDUSD Daily Analysis: Slight Bullish Bias Expected Amid Robust NZDUSD Daily Analysis: Slight Bullish Bias Expected Amid Robust NZ Economy and Softer USD 15/11/2024
Introduction
Today’s outlook for NZDUSD leans towards a slight bullish bias, driven by factors favoring the New Zealand dollar (NZD) over the U.S. dollar (USD). Key influences include New Zealand’s solid economic data, a dovish Federal Reserve outlook, and positive risk sentiment. In this analysis, we’ll explore the major drivers impacting NZDUSD’s potential for an upward trend, providing essential insights for traders.
---
Key Drivers Influencing NZDUSD Today
1. Resilient New Zealand Economic Data
New Zealand’s economic indicators have shown strength, supported by strong export activity and steady domestic demand. This stability has increased confidence in the New Zealand dollar, as recent data aligns with the Reserve Bank of New Zealand’s (RBNZ) cautious approach to monetary policy. With inflation appearing manageable and economic growth remaining consistent, the NZD finds support, contributing to NZDUSD’s bullish outlook.
2. Dovish U.S. Federal Reserve Weakening the USD
Recent U.S. economic data, including lower-than-expected inflation and moderate employment numbers, has led to a dovish outlook from the Federal Reserve. Investors now anticipate a possible pause on rate hikes, which has weakened the dollar’s appeal globally. As a result, the softer USD environment supports a bullish bias for NZDUSD, given the relative strength of the NZD in current conditions.
3. Positive Global Risk Sentiment Boosting NZD Demand
The New Zealand dollar often performs well in “risk-on” environments due to its status as a commodity-backed currency. Today’s positive global sentiment has bolstered NZD’s position, as risk-friendly assets see increased demand. Stability in global equity markets and commodity prices reinforces support for the NZD, favoring an upward trend for NZDUSD in today’s market.
4. Technical Indicators Signaling Upward Momentum
From a technical perspective, NZDUSD is trading above its 50-day moving average, a bullish indicator that signals upward momentum. Additionally, indicators like the RSI (Relative Strength Index) and MACD (Moving Average Convergence Divergence) show bullish patterns, suggesting potential for further gains in the pair.
---
Technical Analysis Indicators Supporting a Bullish Outlook
Moving Averages and RSI
NZDUSD remains above its 50-day moving average, indicating that the trend is in an upward direction. The RSI is trending higher, signaling buying pressure without nearing overbought territory, which supports further bullish potential.
MACD and Volume Analysis
The MACD has formed a bullish crossover, reinforcing the positive outlook. Volume analysis reflects steady buying interest, further confirming today’s slight bullish bias for NZDUSD.
---
Conclusion
With solid New Zealand economic indicators, a dovish Fed outlook weakening the USD, and favorable risk sentiment, NZDUSD is expected to maintain a slight bullish bias today. Traders should monitor global developments and any significant changes in sentiment or economic releases that could influence the pair’s movement.
---
SEO Tags:
- #NZDUSDforecast
- #NZDUSDanalysis
- #NZDUSDtechnicalanalysis
- #ForexTradingNZDUSD
- #NewZealandDollarOutlook
- #USDWeakness
- #NZDUSDtoday
- #ForexMarketAnalysis
- #NZDUSDprediction
Will NZDUSD continue its bearishness?From my analysis, NZDUSD may become bullish for a few days till it gets to the marked point of interest. Then, it'll continue its bearish trend again.
This trade idea has a risk-to-reward ratio of 1:10.
Patience will play a huge role in the execution of this trade.
