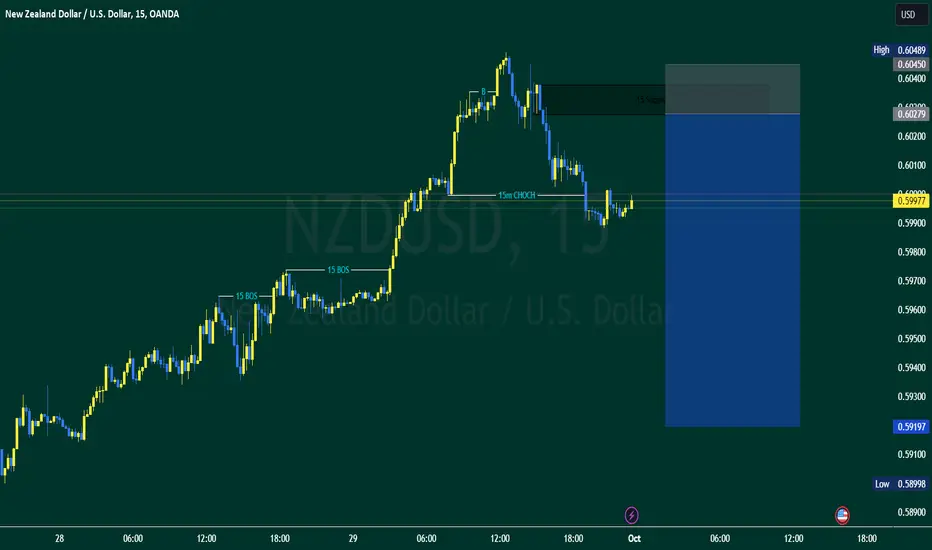
From 4h to 15mPrice triggered the 4h fair value gap and here on 15m we have a broken structure followed by a market structure shift. Looking for price to push to the upside and mitigate the supply zone, should this happen then we go short from 0.60279…
Nzdusdforecast
NZDUSDNZDUSD is getting ready for a new leg upward. Once the current retracement is finished, NZDUSD is going to make a new high.

NZDUSD possilbe long for 0.59607th September daily inside bar, range confined within the previous bar range. 8th September daily insurance bar broker previous day inside bar high. signs for accumulation and strength in coming days. demand zone 0.5855-0.5860, stop loss: 0.5845, initial target 0.5940-60.

NZDUSD SWING SIGNAL LONGHello trader friends
New Zealand dollar to US currency pair
Considering the breaking of the dollar index, we can think about long transactions
Due to the inclusion of the pivot in the 4-hour period, there is a possibility of a phase change from bearish to bullish in this currency pair.
Therefore, according to the appropriate risk and reward, we can enter into long positions
Thank you for following me
You can send a message to subscribe to Signal's private channel
I will also be happy to tell you your opinion

NZDUSD possible long for 0.605528th August daily inside bar, range confined within the previous bar range. 29th August daily insurance bar dictation for strength ahead. if price breaks & hold above then would be considered fake downside breakout. need to break & hold above 0.8986 for trend reversal. initial target 0.6005, next 0.6055. stop loss: 0.5875.

NZDUSD Analysis H4Here is my analysis for NZDUSD on H4 using Order Block. The price could go bearish, you can put a pending order on the Order block or find an entry on LTF within OB Zone. Trade Safe!

NZDUSD 08-08 MovePair : NZDUSD ( New Zealand Dollar / U.S Dollar )
Description :
Head and Shoulder
Strong Support
Falling Wedge in STF
Completed " 1234 " Impulsive Waves
Divergence

NZDUSD Analysis H1Here is my analysis for NZDUSD on H1 using Order Block. The price could go bearish, you can put a pending order on the Order block or find an entry on LTF within OB Zone. Trade Safe!

NZDUSD Top-down analysisHello traders, this is a complete multiple timeframe analysis of this pair. We see could find significant trading opportunities as per analysis upon price action confirmation we may take this trade. Smash the like button if you find value in this analysis and drop a comment if you have any questions or let me know which pair to cover in my next analysis.

NZDUSD Update Hello Traders,
today i will trade again the FX:NZDUSD for three reasons:
-The first reason is that the FOMC will most likely not raise interest rates from September, considering that interest rates at 5.25%-5.5% on the dollar are at 22 year highs and inflation seems to be slowing down (at least in the markets).
-The second reason is that with a drop of 133 pips in 2 days, it should be retraced, having left several levels of liquidity as you can see on the chart by Volume Profile.
-The third reason is the good volatility of the pair.
It is an intraday operation and I will most likely not take anything overnight.
Levels to watch:
Resistance at 0.6152 - 0.6175 targeting 0.619 or the 0.5 Fibo's
Support at 0.6133- 0.611 Stop below 0.611
Point of Control 0.6210

NZDUSD Analysis H1Here is my analysis for NZDUSD on H1 using Order Block. The price could go bullish, you can put a pending order on the Order block or find an entry on LTF within OB Zone. Trade Safe!

NZDUSD BUYHi fellow traders, NZDUSD has completed this larger correction in an ABC formation. It's quite common to see a shorter 'C' wave. Since the other dollar quote pairs look ready for a move higher we are expecting to see NZDUSD do this as well. The trade will be invalidated if we break the red line. Target the resistance levels. Good luck and trade safe!

NZDUSD ShortHello Traders ! As We can see in Daily time frame , selling Pressure is too high
When Price come 0.63200 it will be Sell atleast 200 to 400 pips
if this post is usefull to you , plz like and comment for support

NZDUSD Resistance Cluster! NZD-USD is trading in a
Downtrend and the pair
Is now about to retest
A resistance cluster of
The falling and horizontal
Level at around 0.62576
From where a move
Down is likely!

NFP trade on NZDUSDLet’s see how this one plays out. I am expecting the market to push price up to my point of interest, triggering the trade. This is a trade I expect to play out for NFP. You guest it, I’m expecting stronger than projected NFP data. This trading idea is a mix of fundamentals and technical analysis. Please comment and add to your watchlist.

NZUSD - Bearish momentumNZDUSD has a bearish momentum for a while, adding to the running position with multiple confluences increasing the probability to the downside. Trend line touch, Fib level 78.6 retracement, support turned resistance and an order block will make this a perfect scenario for a valid setup.

NZDUSD Will Go Down!NZD-USD was trading along
The rising support line
But then broke the support
Cluster which is now a resistance
And he will go up to re-test it
Recently so this week
I will Be expecting a move down !

NZDUSD Analysis H1Here is my analysis for NZDUSD on H1 using Order Block. The price could go bearish, you can put a pending order on the Order block or find an entry on LTF within OB Zone. Trade Safe!

NZDUSD Top-down analysis Hello traders, this is a complete multiple timeframe analysis of this pair. We see could find significant trading opportunities as per analysis upon price action confirmation we may take this trade. Smash the like button if you find value in this analysis and drop a comment if you have any questions or let me know which pair to cover in my next analysis.

NZDUSD Analysis H1Here is my analysis for NZDUSD on H1. The price could go bullish, you can put a pending order on the Order block or find an entry on LTF within OB Zone. Trade Safe!

THE TWINSBy now everybody knows that AUD/USD & NZD/USD are family meaning that there are blood related and blood is thicker then water so that means if AUD is falling so is New Zealand

NZDUSD Channel Pattern BreakoutWe can see price continues to be bearish on multiple time frames. This is followed by a trendline breakout
on the daily time frame as well as a channel pattern breakout.

NZDUSD Signal H1Here is my view for NZDUSD on H1. The price could go bullish, you can put a pending order on the Order block or find an entry on LTF within OB Zone. Trade Safe!
