NZDUSD to continue in the upward move?NZDUSD - 24h expiry
Indecisive price action has resulted in sideways congestion on the intraday chart.
Momentum is flat, highlighting the lack of clear direction.
Risk/Reward would be poor to call a buy from current levels.
A move through 0.6000 will confirm the bullish momentum.
The measured move target is 0.6075.
We look to Buy at 0.5950 (stop at 0.5900)
Our profit targets will be 0.6050 and 0.6075
Resistance: 0.6000 / 0.6025 / 0.6050
Support: 0.5950 / 0.5925 / 0.5900
Risk Disclaimer
The trade ideas beyond this page are for informational purposes only and do not constitute investment advice or a solicitation to trade. This information is provided by Signal Centre, a third-party unaffiliated with OANDA, and is intended for general circulation only. OANDA does not guarantee the accuracy of this information and assumes no responsibilities for the information provided by the third party. The information does not take into account the specific investment objectives, financial situation, or particular needs of any particular person. You should take into account your specific investment objectives, financial situation, and particular needs before making a commitment to trade, including seeking advice from an independent financial adviser regarding the suitability of the investment, under a separate engagement, as you deem fit.
You accept that you assume all risks in independently viewing the contents and selecting a chosen strategy.
Where the research is distributed in Singapore to a person who is not an Accredited Investor, Expert Investor or an Institutional Investor, Oanda Asia Pacific Pte Ltd (“OAP“) accepts legal responsibility for the contents of the report to such persons only to the extent required by law. Singapore customers should contact OAP at 6579 8289 for matters arising from, or in connection with, the information/research distributed.
Nzdusdlong

NZDUSD LONG SIGNALUnder current market conditions, the area near 0.5947 has been identified as a critical support zone, where the AI model detects a high-probability trade setup.
From a technical perspective, a clear directional bias based on recent price action patterns. Suppose the market demonstrates increased volume and price stability above key moving averages in the 0.5947 area. In that case, traders are advised to monitor for trend-continuation entry opportunities in alignment with the prevailing momentum.
Profit targets are defined at 0.5981 and 0.6030, corresponding to logical technical resistance zones. These levels are designed for staged profit-taking across different trade management styles. Stop-loss should be strictly enforced at the designated level; once breached, the strategy is considered invalidated in order to limit potential downside.

NZDUSD LONG SIGNAL IDEAUnder current market conditions, the area near 0.5928 has been identified as a critical support zone, where the AI model detects a high-probability trade setup.
From a technical perspective, a clear directional bias based on recent price action patterns. If the market demonstrates increased volume and price stability above key moving averages in the 0.5928 area, traders are advised to monitor for trend-continuation entry opportunities in alignment with the prevailing momentum.
Profit targets are defined at 0.5971 and 0.6013, corresponding to logical technical resistance zones. These levels are designed for staged profit-taking across different trade management styles. Stop-loss should be strictly enforced at the designated level; once breached, the strategy is considered invalidated in order to limit potential downside.

Long on NZD/USDI am long on NZDUSD. We have a bottoming structure with an additional trendline break.
You can long from a retest of trendline or as close to 0.56500.
Target 1 - Golden Zone area between 0.59500 - 0.60500
Target 2 - 0.63

NZDUSD to continue in the upward move?NZDUSD - 24h expiry
There is no clear indication that the upward move is coming to an end.
Although we remain bullish overall, a correction is possible with plenty of room to move lower without impacting the trend higher.
Risk/Reward would be poor to call a buy from current levels.
A move through 0.6000 will confirm the bullish momentum.
The measured move target is 0.6075.
We look to Buy at 0.5950 (stop at 0.5900)
Our profit targets will be 0.6050 and 0.6075
Resistance: 0.6000 / 0.6050 / 0.6075
Support: 0.5950 / 0.5925 / 0.5900
Risk Disclaimer
The trade ideas beyond this page are for informational purposes only and do not constitute investment advice or a solicitation to trade. This information is provided by Signal Centre, a third-party unaffiliated with OANDA, and is intended for general circulation only. OANDA does not guarantee the accuracy of this information and assumes no responsibilities for the information provided by the third party. The information does not take into account the specific investment objectives, financial situation, or particular needs of any particular person. You should take into account your specific investment objectives, financial situation, and particular needs before making a commitment to trade, including seeking advice from an independent financial adviser regarding the suitability of the investment, under a separate engagement, as you deem fit.
You accept that you assume all risks in independently viewing the contents and selecting a chosen strategy.
Where the research is distributed in Singapore to a person who is not an Accredited Investor, Expert Investor or an Institutional Investor, Oanda Asia Pacific Pte Ltd (“OAP“) accepts legal responsibility for the contents of the report to such persons only to the extent required by law. Singapore customers should contact OAP at 6579 8289 for matters arising from, or in connection with, the information/research distributed.

nzdusd sell signal. Don't forget about stop-loss.
Write in the comments all your questions and instruments analysis of which you want to see.
Friends, push the like button, write a comment, and share with your mates - that would be the best THANK YOU.
P.S. I personally will open entry if the price will show it according to my strategy.
Always make your analysis before a trade

NZD/USD Broke The Res , Good Chance To Buy To Get 200 Pips !Here is my NZD/USD Long Setup , we have a daily closure above the res and also it`s a very good support and we can trust it , we can enter a buy trade if the price go back to retest the broken res , and if we have a good bullish price action then we can enter a buy trade and targeting 200 pips .
This Is An Educational + Analytic Content That Will Teach Why And How To Enter A Trade
Make Sure You Watch The Price Action Closely In Each Analysis As This Is A Very Important Part Of Our Method
Disclaimer : This Analysis Can Change At Anytime Without Notice And It Is Only For The Purpose Of Assisting Traders To Make Independent Investments Decisions.

Plan: NZDUSD BuyAfter valid breakouts on both 15m and 1hr from the range, it might retrace back to the POI at discount zone and continue upwards. The pullback looks significant which is supported by an imbalance candle after that.
Entry: 0.58722
TP: 0.59022
SL: 0.58572
Ratio 1:2

LONG ON NZD/USDNZD/USD has been oversold since last week.
It has finally given a change of character (choc) on the lower timeframe witching to bullish.
it is currently in the pullback/retracement phase of the new change.
With the dollar in a overall downtrend and getting ready to fall, this correlation should cause the NZD/USD pair to rise.
I have brought NZD/USD looking to make 200-300 pips this week.

NZD/USD "The Kiwi" Forex Bank Heist Plan (Swing/Day)🌟Hi! Hola! Ola! Bonjour! Hallo! Marhaba!🌟
Dear Money Makers & Robbers, 🤑 💰💸✈️
Based on 🔥Thief Trading style technical and fundamental analysis🔥, here is our master plan to heist the NZD/USD "The Kiwi" Forex Bank. Please adhere to the strategy I've outlined in the chart, which emphasizes long entry. Our aim is the high-risk Yellow MA Zone. It's Risky level, overbought market, consolidation, trend reversal, trap at the level where traders and bearish robbers are stronger. 🏆💸"Take profit and treat yourself, traders. You deserve it!💪🏆🎉
Entry 📈 : "The heist is on! Wait for the MA breakout then make your move at (0.57500) - Bullish profits await!"
however I advise to Place Buy stop orders above the Moving average (or) after the MA breakout Place buy limit orders within a 15 or 30 minute timeframe most NEAREST (or) SWING low or high level.
📌I strongly advise you to set an "alert (Alarm)" on your chart so you can see when the breakout entry occurs.
Stop Loss 🛑: "🔊 Yo, listen up! 🗣️ If you're lookin' to get in on a buy stop order, don't even think about settin' that stop loss till after the breakout 🚀. You feel me? Now, if you're smart, you'll place that stop loss where I told you to 📍, but if you're a rebel, you can put it wherever you like 🤪 - just don't say I didn't warn you ⚠️. You're playin' with fire 🔥, and it's your risk, not mine 👊."
📌Thief SL placed at the nearest/swing low or high level Using the 6H timeframe (0.56500) Day/Swing trade basis.
📌SL is based on your risk of the trade, lot size and how many multiple orders you have to take.
🏴☠️Target 🎯: 0.59400 (or) Escape Before the Target
🧲Scalpers, take note 👀 : only scalp on the Long side. If you have a lot of money, you can go straight away; if not, you can join swing traders and carry out the robbery plan. Use trailing SL to safeguard your money 💰.
💵💰NZD/USD "The Kiwi" Forex Bank Heist Plan (Swing / Day Trade) is currently experiencing a bullishness,., driven by several key factors.
📰🗞️Get & Read the Fundamental, Macro, COT Report, Quantitative Analysis, Sentimental Outlook, Intermarket Analysis, Future trend targets.... go ahead to check 👉👉👉🔗
⚠️Trading Alert : News Releases and Position Management 📰 🗞️ 🚫🚏
As a reminder, news releases can have a significant impact on market prices and volatility. To minimize potential losses and protect your running positions,
we recommend the following:
Avoid taking new trades during news releases
Use trailing stop-loss orders to protect your running positions and lock in profits
💖Supporting our robbery plan 💥Hit the Boost Button💥 will enable us to effortlessly make and steal money 💰💵. Boost the strength of our robbery team. Every day in this market make money with ease by using the Thief Trading Style.🏆💪🤝❤️🎉🚀
I'll see you soon with another heist plan, so stay tuned 🤑🐱👤🤗🤩

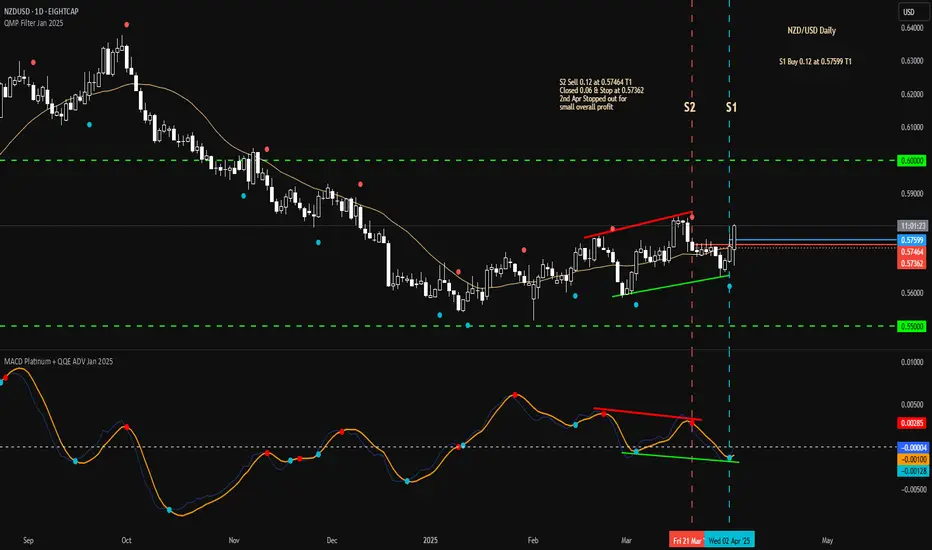
Thu 3rd Apr 2025 NZD/USD Daily Forex Chart Buy SetupGood morning fellow traders. On my Daily Forex charts using the High Probability & Divergence trading methods from my books, I have identified a new trade setup this morning. As usual, you can read my notes on the chart for my thoughts on this setup. The trade being a NZD/USD Buy. Enjoy the day all. Cheers. Jim
A bullish movement on NZDUSDNZDUSD has been bearish for a while, and it seems to be starting a new bullish movement.
currently on a support and valid uptrend on a 4h timeframe

NZDUSD - H4, H1 Forecast - Technical Analysis & Trading IdeasTechnical analysis is on the chart!
No description needed!
OANDA:NZDUSD
__________________________________________________________________
❤️ If you find this helpful and want more FREE forecasts in TradingView,
. . . . . . . . Hit the 'BOOST' button 👍
. . . . . . . . . . . Drop some feedback in the comments below! (e.g., What did you find most useful? How can we improve?)
🙏 Your support is appreciated!
Now, it's your turn!
Be sure to leave a comment; let us know how you see this opportunity and forecast.
Have a successful week,
ForecastCity Support Team
NZDUSD to find buyers at market price?NZDUSD - 24h expiry
Price action has stalled at good support levels and currently trades just above here (0.5725).
We expect a reversal in this move.
Risk/Reward would be poor to call a buy from current levels.
A move through 0.5775 will confirm the bullish momentum.
The measured move target is 0.5800.
We look to Buy at 0.5725 (stop at 0.5690)
Our profit targets will be 0.5795 and 0.5800
Resistance: 0.5775 / 0.5795 / 0.5800
Support: 0.5725 / 0.5700 / 0.5690
Risk Disclaimer
The trade ideas beyond this page are for informational purposes only and do not constitute investment advice or a solicitation to trade. This information is provided by Signal Centre, a third-party unaffiliated with OANDA, and is intended for general circulation only. OANDA does not guarantee the accuracy of this information and assumes no responsibilities for the information provided by the third party. The information does not take into account the specific investment objectives, financial situation, or particular needs of any particular person. You should take into account your specific investment objectives, financial situation, and particular needs before making a commitment to trade, including seeking advice from an independent financial adviser regarding the suitability of the investment, under a separate engagement, as you deem fit.
You accept that you assume all risks in independently viewing the contents and selecting a chosen strategy.
Where the research is distributed in Singapore to a person who is not an Accredited Investor, Expert Investor or an Institutional Investor, Oanda Asia Pacific Pte Ltd (“OAP“) accepts legal responsibility for the contents of the report to such persons only to the extent required by law. Singapore customers should contact OAP at 6579 8289 for matters arising from, or in connection with, the information/research distributed.

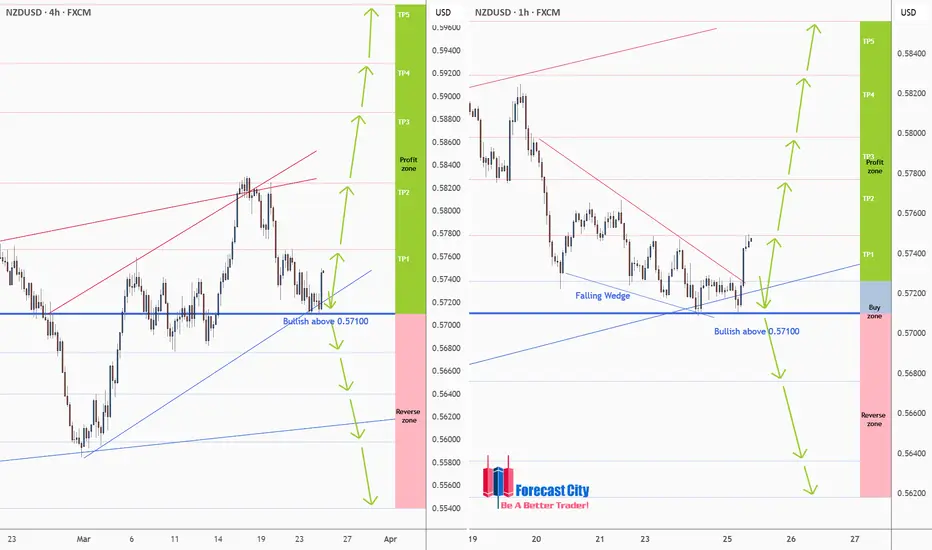
NZD/USD Bullish Reversal – Key Levels & Trade PlanThe 4H chart shows NZD/USD forming a bullish structure with an ascending trendline support.
A breakout from the descending wedge pattern signals potential upside momentum.
The price is currently testing a key support zone near 0.5740, aligning with the 23.6% Fibonacci retracement level.
Trade Setup & Levels:
Entry Zone: Above 0.5740 (support holding)
Target 1 (TP1): 0.5817 – previous resistance
Target 2 (TP2): 0.6050 – Fibonacci 61.8% level
Stop Loss (SL): Below 0.5620 (previous support structure)
Bullish Confirmation Factors:
✅ Trendline support remains intact, preventing further downside.
✅ Breakout from wedge pattern, indicating buying pressure.
✅ Higher lows formation, showing gradual accumulation of demand.
Conclusion:
A confirmed breakout above 0.5817 will validate the bullish move toward 0.6050. If price sustains above the resistance, we expect further upside momentum in the coming sessions. 📈

NZD/USD "The Kiwi" Forex Market Money Heist Plan🌟Hi! Hola! Ola! Bonjour! Hallo! Marhaba!🌟
Dear Money Makers & Thieves, 🤑 💰🐱👤✈️
Based on 🔥Thief Trading style technical and fundamental analysis🔥, here is our master plan to heist the NZD/USD "The Kiwi" Forex market. Please adhere to the strategy I've outlined in the chart, which emphasizes long entry. Our aim is the high-risk Red Zone. Risky level, overbought market, consolidation, trend reversal, trap at the level where traders and bearish robbers are stronger. 🏆💸Book Profits wealthy and safe trade.💪🏆🎉
Entry 📈 : "The heist is on! Wait for the MA breakout (0.57500) then make your move - Bullish profits await!"
however I advise to Place Buy stop orders above the Moving average (or) Place buy limit orders within a 15 or 30 minute timeframe most recent or swing, low or high level.
📌I strongly advise you to set an alert on your chart so you can see when the breakout entry occurs.
Stop Loss 🛑:
Thief SL placed at the recent/swing low or high level Using the 4H timeframe (0.56800) swing trade basis.
SL is based on your risk of the trade, lot size and how many multiple orders you have to take.
Target 🎯:
✂Primary Target - 0.58350 (or) Escape Before the Target
✂Secondary Target - 0.59600 (or) Escape Before the Target
🧲Scalpers, take note 👀 : only scalp on the Long side. If you have a lot of money, you can go straight away; if not, you can join swing traders and carry out the robbery plan. Use trailing SL to safeguard your money 💰.
📰🗞️Read the Fundamental, Macro, COT Report, Quantitative Analysis, Intermarket Analysis, Sentimental Outlook before start the plan.
NZD/USD "The Kiwi" Forex market is currently experiencing a Bullish 🐃 trend,., driven by several key factors.
🟡Fundamental Analysis
- Economic Indicators: New Zealand's GDP growth rate is 2.5%, inflation rate is 2.3%, and unemployment rate is 3.7%.
- Monetary Policy: The Reserve Bank of New Zealand's official cash rate is 3.25%.
- Fiscal Policy: The New Zealand government's budget deficit is 1.2% of GDP.
⚫Macroeconomic Factors
- Inflation Rate: The inflation rate in New Zealand is 2.3%, which is within the Reserve Bank's target range of 1-3%.
- Interest Rates: The Reserve Bank of New Zealand's official cash rate is 3.25%, which is relatively high compared to other developed economies.
- GDP Growth Rate: New Zealand's GDP growth rate is 2.5%, which is moderate compared to other developed economies.
- Trade Balance: New Zealand's trade balance is improving, with exports increasing.
🟠Global Market Analysis
- US Economic Indicators: The US GDP growth rate is 2.2%, inflation rate is 2.2%, and unemployment rate is 3.5%.
- Commodity Prices: The price of gold is $1,700 per ounce, and the price of oil is $65 per barrel.
- Global Economic Growth: The global economic growth rate is 3.5%, which is moderate.
🔴COT Data
- Non-Commercial Traders: Non-commercial traders, such as hedge funds and speculators, have been net long on the NZD, with 30,000 contracts.
- Commercial Traders: Commercial traders, such as banks and institutions, have been net short on the NZD, with 20,000 contracts.
- Open Interest: The total number of outstanding contracts in the futures market is 120,000.
🟣Intermarket Analysis
- Correlation with AUD/USD: The NZD/USD exchange rate has a strong positive correlation with the AUD/USD exchange rate, with a correlation coefficient of 0.8.
- Correlation with Gold: The NZD/USD exchange rate has a moderate positive correlation with gold prices, with a correlation coefficient of 0.5.
🟤Quantitative Analysis
- Moving Averages: The 50-day moving average is 0.5820, and the 200-day moving average is 0.5750.
- Relative Strength Index (RSI): The RSI is currently at 60, indicating bullish conditions.
- Bollinger Bands: The NZD/USD exchange rate is currently trading above its Bollinger Bands, indicating a strong uptrend.
🔵Market Sentimental Analysis
- Bullish Sentiment: 60% of market participants are bullish on the NZD/USD exchange rate.
- Bearish Sentiment: 40% of market participants are bearish on the NZD/USD exchange rate.
- Fear and Greed Index: The fear and greed index is currently at 70, indicating greed.
🟢Positioning
- Short-Term: Long NZD/USD, targeting 0.59000.
- Long-Term: Long NZD/USD, targeting 0.62000.
⚪Next Trend Move
- Upward: The NZD/USD exchange rate is expected to move upward in the short term.
🟡Overall Summary Outlook
- Bullish: The NZD/USD exchange rate is expected to move upward in the short term, driven by macroeconomic factors, global market analysis, and quantitative analysis.
📌Keep in mind that these factors can change rapidly, and it's essential to stay up-to-date with market developments and adjust your analysis accordingly.
⚠️Trading Alert : News Releases and Position Management 📰 🗞️ 🚫🚏
As a reminder, news releases can have a significant impact on market prices and volatility. To minimize potential losses and protect your running positions,
we recommend the following:
Avoid taking new trades during news releases
Use trailing stop-loss orders to protect your running positions and lock in profits
💖Supporting our robbery plan 💥Hit the Boost Button💥 will enable us to effortlessly make and steal money 💰💵. Boost the strength of our robbery team. Every day in this market make money with ease by using the Thief Trading Style.🏆💪🤝❤️🎉🚀
I'll see you soon with another heist plan, so stay tuned 🤑🐱👤🤗🤩

NZDUSD is in the Selling DirectionHello Traders
In This Chart NZDUSD HOURLY Forex Forecast By FOREX PLANET
today GBPUSD analysis 👆
🟢This Chart includes_ (NZDUSD market update)
🟢What is The Next Opportunity on NZDUSD Market
🟢how to Enter to the Valid Entry With Assurance Profit
This CHART is For Trader's that Want to Improve Their Technical Analysis Skills and Their Trading By Understanding How To Analyze The Market Using Multiple Timeframes and Understanding The Bigger Picture on the Charts

#NZDUSD 1DAYNZDUSD (1D Timeframe) Analysis
Market Structure:
The price is approaching a significant support level, which has previously acted as a key area for price reversals. This level is important for identifying potential buying opportunities.
Forecast:
It is recommended to wait for the price to reach the support level. If bullish confirmation is observed, such as bullish candlestick patterns or increased buying momentum, a buy position can be considered.
Key Levels to Watch:
- Entry Zone: Monitor the price behavior near the support level and consider buying if a clear bounce or bullish signal is confirmed.
- Risk Management:
- Stop Loss: Placed below the support zone to protect against a potential breakdown.
- Take Profit: Target the next resistance levels for potential gains.
Market Sentiment:
Confirmation of bullish sentiment will depend on how the price reacts at the support level. A strong bounce would indicate potential for upward movement, while a breakdown may signal further downside. Waiting for confirmation will provide better trade accuracy.

NZDUSDThe price has touched this base once and is now unable to fall, so I expect the price to rise above the upper base.

NZDUSD BUY4 hour Change of character with possibility of moving further up to make 4 hour right shoulder
NZD/USD Analysis & Probability AssessmentTimeframes Analyzed:
15-Minute (M15)
30-Minute (M30)
1-Hour (H1)
4-Hour (H4)
Daily (D1)
📊 Market Structure Update
✅ Bearish Trend Dominance: The overall structure remains bearish, with multiple Breaks of Structure (BOS) confirming the downtrend.
✅ Current Price Zone (~0.5600 - 0.5620): Price is testing the discount zone, which is a key demand area.
✅ Liquidity Grab Potential: A previous weak low has been taken, indicating possible price reaction.
✅ Premium Zone (~0.5730 - 0.5780): The strongest resistance, where sellers will likely dominate.
🔹 Probability for Trade Setups
1️⃣ Bullish Setup (Higher Probability - 70%)
Entry Zone: 0.5550 - 0.5580 (Discount Zone)
Stop Loss (SL): Below 0.5530
Take Profit (TP): 0.5650 - 0.5670
Probability: 70%
Reasoning:
The discount zone is holding, meaning buyers are stepping in.
RSI recovering from oversold levels.
MACD crossover approaching bullish momentum.
Liquidity sweep of weak lows, increasing reversal chances.
📌 Confirmation Needed:
Bullish candlestick pattern (Engulfing, Hammer, Morning Star)
Volume increase on bullish breakout
RSI moving above 40
2️⃣ Bearish Setup (Lower Probability - 50%)
Entry Zone: 0.5650 - 0.5670 (Resistance Zone)
Stop Loss (SL): Above 0.5700
Take Profit (TP): 0.5580
Probability: 50%
Reasoning:
The overall trend is bearish, but price is at discount demand zone, meaning a reversal is possible.
RSI is still low, signaling price exhaustion.
If price rejects 0.5650 - 0.5670, it could resume downward.
📌 Confirmation Needed:
Bearish candlestick pattern (Engulfing, Shooting Star, Evening Star)
RSI staying below 60
Volume declining near resistance zone
🎯 Final Probability Breakdown
Bullish Trade (Buying at 0.5550 - 0.5580) ➝ 70% Probability
Bearish Trade (Selling at 0.5650 - 0.5670) ➝ 50% Probability
📌 Best Trade for Now: BUY from 0.5550 - 0.5580, as price is reacting to the discount zone and showing bullish signs.

LONG ON NZD/USDNZD/USD is giving nice uptrend structure from the higher TF.
Currently it has pulled back to a key support area and is looking good for a rise.
Dollar (DXY) is overall bearish and currently falling. (This has a inverse correlation with XXX/USD pairs)
I will be buying NZD/USD to the next resistance level / previous high for about 150-200 pips.

NZDUSD - Long from bullish OB !!Hello traders!
‼️ This is my perspective on NZDUSD.
Technical analysis: Here we are in a bullish market structure from 4H timeframe perspective, so I look for a long. I expect price to continue the retracement to fill that small imbalance lower and then to reject from bullish OB.
Like, comment and subscribe to be in touch with my content!
