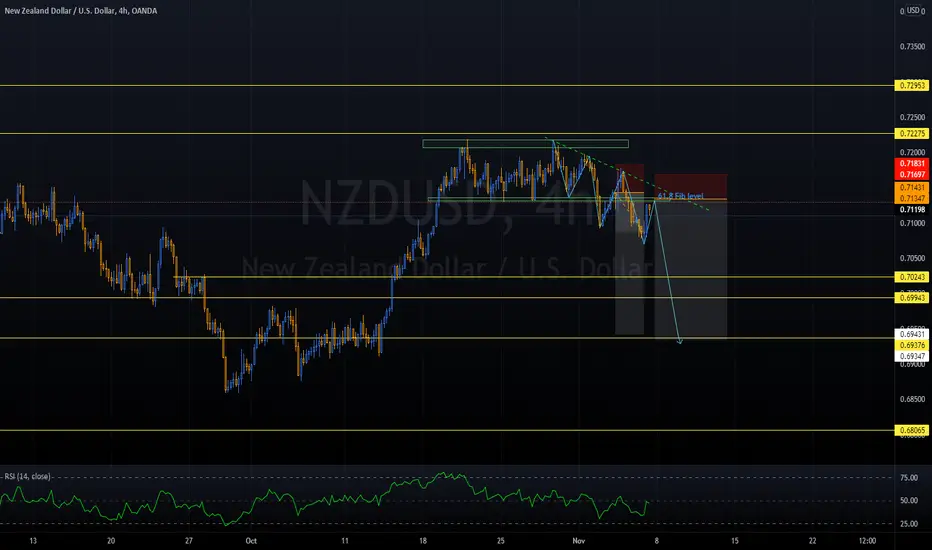
NZDUSD Short!NU, continued to make lower lows and lower highs last week. This week I'm expecting a pull back to the 61.8 fib level that matches with broken support that will be retested as resistance. then a rejection and continued sell off
Nzdusdtrade
NZDUSDIn the weekly chart, it managed to break its 35-week trend line and is pullback to the trend line
If it can stabilize above the trend line, it can move the important weekly resistance once again (range 0.73943 to 0.76249)
If it can not stay above the trend line, the first support is in the range of 0.68 to 0.69720
I will wait for the type of trades next week to get the position
4H
15M
1H

NzdUsd- Back in the range- Bullish conotationsOn Friday, NzdUsd has dropped under the rectangle's support.
However, the pair quickly reversed losses, proving that it was a false break and now is trading at 0.7155 and back into the range.
The long-term trend for the pair is bullish and the pair could resume its way up very soon.
0.73 can be the target for bulls and this scenario is negated by a drop under recent low

Bearish bias on this pair after a break of rectangle patternCurrently retesting the rectangle pattern on this pair. Waiting for a break of the ascending trendline to confirm any bearish momentum.

NZDUSDThe New Zealand dollar initially tried to rally during the week, but it sees plenty of resistance just above at the 0.7233 region. At this point in time, if we can break above there, then it is likely that the New Zealand dollar could go looking towards the 0.73 handle. A breakdown below the bottom of the weekly candlestick has this market looking for support at lower levels, and I would be especially interested in the New Zealand dollar near the 0.70 level.

NZD/USD:HARMONIC PATTERN FORMATION | SHORT SETUP Welcome back Traders, Investors, and Community!
Check the Links on BIO and If you LIKE this analysis, Please support our Idea by hitting the LIKE 👍 button
Traders, if you like this idea or have your own opinion about it, please write your own in the comment box . We will be glad for this.
Feel free to request any pair/instrument analysis or ask any questions in the comment section below.
Have a Good Day Trading !

NZDUSD | A TEST OF SWING HIGHNZDUSD after making a swing high of 0.72188 correct itself to fib level 0.236.
It is coming again to test swing high.
Question is will it break or fall after making double top?
Plan 1: IF IT BREAKS & CLOSE ABOVE 0.72188
Buy: 0.72200
SL: 0.71329
TP: 0.73030
Plan 2: IF IT MAKES BREAISH CANDLE ON TOP 0.72188
Sell: 0.72000
SL: 0.72500
TP: 0.71330
Let us know what do you think in comment

NZDUSD - H4 - Bearish Reversal short tradeNzdusd - H4 - I see a reversal coming on nzdusd now as the uptrend becomes exhausted on daiyl and H4 chart im looking for a decent drop back to the lows for a 200-300 pips target.

NzdUsd- Sell on confirmationLast week, NzdUsd has broken above 0.7160 resistance, but the pair lacks continuation and is just consolidating in a range.
This very well can be a false break and the pair could roll back to the liquidity zone from under 0.7
I'm waiting for a clear sell signal

NZD/USD : GARTELY PATTERN FORMATION | SHORT SETUP...Welcome back Traders, Investors, and Community!
Check the Links on BIO and If you LIKE this analysis, Please support our Idea by hitting the LIKE 👍 button
Traders, if you like this idea or have your own opinion about it, please write your own in the comment box . We will be glad for this.
Feel free to request any pair/instrument analysis or ask any questions in the comment section below.
Have a Good Day Trading !

NZDUSDNzdusd has a falling wedge pattern and it's broke resistance line I'll put where stop lose and then target price if u interested u buy

A Bearish Push On NZDUSD Step By StepNZDUSD made a new low this past Friday. Did this automatically set off something in your head? If not, it should have.
Price making a new low shows you there are sellers who are ready to see further bearish movement. Now if price can pull back and stay below 0.71892, a sell could very well be in good order back down to the previous new low.

NzdUsd can go higherSince the beginning of October, NzdUsd is trading upwards, with the pair reaching a high of 0.7220
Now the pair is correcting some of the gains and is forming a flag
A break above the resistance should accelerate gains towards 0.73
Buy dips is my strategy


NZD/USD: DOWNTREND | BEARISH PATTERN | SHORT READY Welcome back Traders, Investors, and Community!
Check the Links on BIO and If you LIKE this analysis, Please support our Idea by hitting the LIKE 👍 button
Traders, if you like this idea or have your own opinion about it, please write your own in the comment box . We will be glad for this.
Feel free to request any pair/instrument analysis or ask any questions in the comment section below.
Have a Good Day Trading !

NZDUSD BUY BIAS WAITING FOR INEFFICIENCY TO GET FILLED NZDUSD just took out a recent high and created some inefficiency areas in the market
i will be waiting for nzdusd to move to the downside to fill in all the inefficiency it created and hits our order block entry level where i will enter the trade

NZD/USD | New Zealand Dollar to US Dollar Trading AnalysisWelcome back Traders, Investors, and Community!
Check the Links on BIO and If you LIKE this analysis, Please support our Idea by hitting the LIKE 👍 button
Traders, if you like this idea or have your own opinion about it, please write your own in the comment box . We will be glad for this.
Feel free to request any pair/instrument analysis or ask any questions in the comment section below.
Have a Good Day Trading !

NZDUSD rising wedge pattern when close market broke the supply and demand and entre the trade its good already good buyers on the market if take risk and got more reward want u have entre the trade hold be patience 4hr handle good

NZDUSDThe New Zealand dollar rallied significantly last week to break above the 0.70 level. The market is forming some type of bullish pennant, or perhaps even a falling wedge. Either way, the market is suggesting that it could break out to the upside. If we can break above the previous week high, then I think that the New Zealand dollar has a high likelihood of looking towards the 0.74 handle. To the downside, the 0.69 level continues offer support.

NZDUSD / 2 ScenariosThis pair could go either way, I dont see this being at a level of resistance to short just yet but it could drop based on the way the current daily candle is forming..
I will wait for price to indicate its direction before entry on this pair

NZDUSD POTENTIAL SELL I like the pattern that is forming. Its also corrective so its possible to see one more leg to the downside if it holds the structure and based on higher timeframe macd (6h) and (4h) emas. Lets see...
Look price action on dxy for long.

NZDUSD SHORTExpecting NU to follow suit with AU and EU. I want to see it fall at market open after a small pull back.

Sell Nzdusdas we can see nzdusd break channel in h1 we have good entry to sell when market retrce and sell we will put trade
