Ocean
OCEAN/USD local topLocal top on OCEAN/USD
Reasons:
1) bearish divergence at RSI 70
2) CMF crossing zero line
Ocean Protocol Mapped | 138%+ Profits PotentialHere is the chart for Ocean Protocol (OCEANBTC) on Bittrex.
We can see a clear uptrend, the next step is likely to be a new higher high, after OCEANBTC manages to break and remain above EMA10/50, afterward it can make a huge jump, this is marked with a green arrow.
Additional details can be found on the chart.
Thanks for reading.
Namaste.
Ocean WavesHey,
I did not expect the rally from 240 sats to 400s, but we're here, just shy of 400 for now.
Playing off of Moving Averages for now, however, resistance looks to be around 280 sats if that's your game.
Stoch RSI was overbought and now back within range, Neither RSI or MFI we're overbought this last rally.
We are below the 9 ma, so this rally this over and the 21 ma will decide the rest. At least that's how I see things.
Dead Turtle Pattern. Short SPX now!this tutle tried to breathe. maybe it can do it. But the power of ocean is going to get it back for at least once.
(Look at how strong the ocean resistant zone is.)
The first target is turtle head. second target is turtle arm.
And if it goes to the mouth of that shark. It's shark pattern for bearish totally
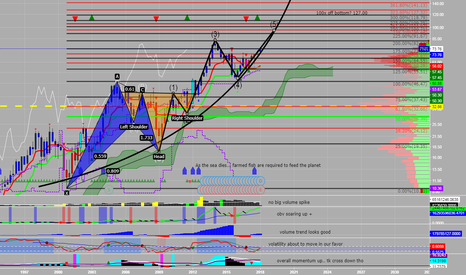
PNR Quarterly ChartPentair makes all kinds of equiment for fish farms which will be required in the not too distant future to maintain population growth as the seas continue to decline.
I see 30% pretty easily in the next few quarters. 100x off the bottom is 127 dollars another key level to watch if we dont correct very much after my (potential) wave 5 completes
Be sure to manage your risk
gl hf
xoxo
sn00p


