OGNUSDT Breakout Alert Descending Trendline Reversal
📊 Pattern and Market Structure
Descending Trendline Breakout:
OGN has successfully broken out of a long-standing descending trendline, signaling a potential shift from a bearish to a bullish trend.
Strong Accumulation Zone / Key Support:
The price has consistently respected the $0.04268 - $0.05402 support area, forming a solid demand zone with multiple rejections and prolonged consolidation.
Potential Reversal Formation:
A double bottom / base consolidation pattern seems to be forming within the support zone, reinforcing the likelihood of a bullish reversal.
📈 Bullish Scenario
If the breakout is confirmed (price holds above and successfully retests the trendline), the bullish targets will be:
1. $0.06229 – minor resistance, likely first retest area.
2. $0.07000 - $0.07432 – previous horizontal resistance zone.
3. $0.08118 – prior distribution zone.
4. $0.09500 - $0.10302 – mid-range supply zone.
5. $0.11000 - $0.12733 – medium-term potential target.
6. $0.14601 - $0.16232 – longer-term target on strong momentum.
📌 A daily candle close above $0.06229 with significant volume could confirm further bullish continuation.
📉 Bearish Scenario
If the breakout turns out to be a false breakout, and price falls back below the support zone ($0.05402):
Expect a drop toward:
$0.04268 – the next major support level.
A breakdown below this may lead to $0.03800 or the formation of a new lower low.
Possible bearish triggers:
Rejection at $0.06229 or above.
Weak breakout volume.
Overall bearish sentiment in the crypto market.
📌 Conclusion:
The descending trendline breakout indicates a potential bullish reversal.
Strong support at the base adds confluence to the setup.
Bullish scenario currently has higher probability, but confirmation and volume are crucial for sustained upside.
#OGNUSDT #CryptoAnalysis #TechnicalAnalysis #AltcoinBreakout #CryptoSignals #BullishReversal #DescendingTrendline #BreakoutAlert #OGN #OriginProtocol
OGN

OGNUSDT Forming Descending ChannelOGNUSDT is displaying a promising reversal opportunity as it forms a clear descending channel on the daily chart. This technical setup signals that Origin Protocol could be gearing up for a breakout move, especially with the recent price action testing the upper boundary of the channel. A successful breakout above this resistance zone could unlock significant upside potential, setting the stage for a healthy bullish wave that traders will want to monitor closely.
Volume analysis for OGNUSDT is equally supportive, showing consistent buying interest that hints at accumulation by investors positioning early for a trend reversal. With good volume backing the price action, the probability of a confirmed breakout above the descending channel increases, which can accelerate momentum buying and attract fresh capital inflows. This kind of setup often draws the attention of swing traders and trend-followers looking for high-probability moves.
The expected gain for OGNUSDT in this scenario sits around 60% to 70%+, which is a reasonable target given the recent lows and the potential to reclaim previous levels of support turned resistance. The broader market sentiment towards altcoins is also improving, with many investors rotating funds into projects with strong recovery patterns. Origin Protocol’s fundamentals, coupled with this technical outlook, make it an appealing candidate for medium-term gains.
Traders should keep an eye on daily closes above the channel resistance and watch for confirmation signals like retests and continuation candles. Managing risk is key, but with investors taking renewed interest in this project, OGNUSDT is a crypto pair worth keeping on the watchlist for the next breakout phase.
✅ Show your support by hitting the like button and
✅ Leaving a comment below! (What is You opinion about this Coin)
Your feedback and engagement keep me inspired to share more insightful market analysis with you!

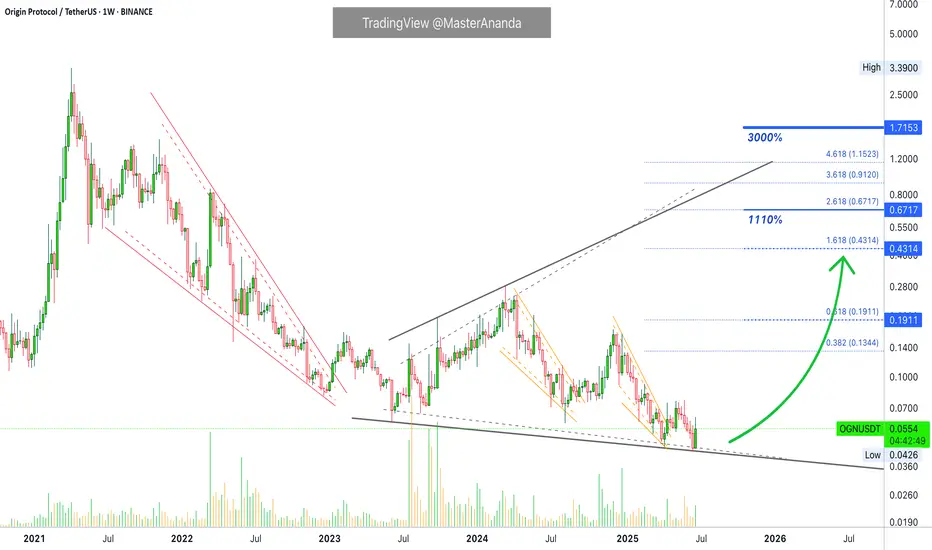
Origin Protocol 1110% Target Explained & 3000% Prev-Bull MarketOrigin Protocol has been moving within a massive broadening channel since December 2022. Now trading within its lower boundary. The upper boundary works as resistance while the lower boundary works as support. Whenever the action starts to happen close to the lower boundary this becomes a buy-opportunity, this entry can be used either for the short- or long-term. With the current market situation, the best focus is long-term. A 6 months time window.
Origin Protocol (OGNUSDT) produced a 3,000%+ bullish wave back in the 2021 bull market. We know for a fact now that this pair can produce wild gains. The price that launched this wave was 0.1068, the peak was 3.39. In comparison, the bottom in 2025 stands at 0.0426. The next peak can be anything but we have plenty of room available for growth. On the chart I have a 1,110% target and this is an easy one. This project is likely to grow 2,000% or more. Can be 3,000%. 1,110% is the safe, strong, easy target.
Thank you for reading.
Namaste.
OGNUSDT 1D AnalysisOGN ~ 1D Analysis
#OGN Buy in increments from here with a short term target of at least 15%+ and a long term target of $0.172

OGNUSDT | One of Today’s Highest Volume Gainers – +32.44% OGNUSDT just saw an impressive surge in trading activity, surging over thirty percent in volume today. When you spot a coin with that kind of interest, you know smart money is involved and you pay attention.
🟦 Blue Box = Key Support Zone
• This area has shown reliable buyer reactions before. As price approaches, you’ll naturally look for a rebound.
• If OGN dips into the blue box and holds, a measured long can be considered—just wait for lower‑timeframe confirmations on price action and CDV confluences.
📈 How to Trade This Move
Entry with Confidence
Watch for price to touch the blue box and then form a clean higher‑low on a 5‑ or 15‑minute chart. That’s your green light.
Manage Your Risk
Place a stop just below the blue box. If your trigger doesn’t hold, you exit quickly.
Adaptive Mindset
If instead OGN breaks decisively below the blue box with volume, shift out of longs and look for a retest of that level as resistance—this ability to adapt is why followers trust my analysis.
🤝 Why Follow These Levels?
Every zone I share comes from watching real orderflow and proven patterns in the market. These setups have built my high success rate—just check my profile. Most traders guess entries; you’ll be acting on clear, data‑backed signals.
Stay patient, let the market prove itself, and then step in with conviction. That’s how you trade smarter and avoid emotional mistakes.
📌I keep my charts clean and simple because I believe clarity leads to better decisions.
📌My approach is built on years of experience and a solid track record. I don’t claim to know it all but I’m confident in my ability to spot high-probability setups.
📌If you would like to learn how to use the heatmap, cumulative volume delta and volume footprint techniques that I use below to determine very accurate demand regions, you can send me a private message. I help anyone who wants it completely free of charge.
🔑I have a long list of my proven technique below:
🎯 ZENUSDT.P: Patience & Profitability | %230 Reaction from the Sniper Entry
🐶 DOGEUSDT.P: Next Move
🎨 RENDERUSDT.P: Opportunity of the Month
💎 ETHUSDT.P: Where to Retrace
🟢 BNBUSDT.P: Potential Surge
📊 BTC Dominance: Reaction Zone
🌊 WAVESUSDT.P: Demand Zone Potential
🟣 UNIUSDT.P: Long-Term Trade
🔵 XRPUSDT.P: Entry Zones
🔗 LINKUSDT.P: Follow The River
📈 BTCUSDT.P: Two Key Demand Zones
🟩 POLUSDT: Bullish Momentum
🌟 PENDLEUSDT.P: Where Opportunity Meets Precision
🔥 BTCUSDT.P: Liquidation of Highly Leveraged Longs
🌊 SOLUSDT.P: SOL's Dip - Your Opportunity
🐸 1000PEPEUSDT.P: Prime Bounce Zone Unlocked
🚀 ETHUSDT.P: Set to Explode - Don't Miss This Game Changer
🤖 IQUSDT: Smart Plan
⚡️ PONDUSDT: A Trade Not Taken Is Better Than a Losing One
💼 STMXUSDT: 2 Buying Areas
🐢 TURBOUSDT: Buy Zones and Buyer Presence
🌍 ICPUSDT.P: Massive Upside Potential | Check the Trade Update For Seeing Results
🟠 IDEXUSDT: Spot Buy Area | %26 Profit if You Trade with MSB
📌 USUALUSDT: Buyers Are Active + %70 Profit in Total
🌟 FORTHUSDT: Sniper Entry +%26 Reaction
🐳 QKCUSDT: Sniper Entry +%57 Reaction
📊 BTC.D: Retest of Key Area Highly Likely
📊 XNOUSDT %80 Reaction with a Simple Blue Box!
📊 BELUSDT Amazing %120 Reaction!
I stopped adding to the list because it's kinda tiring to add 5-10 charts in every move but you can check my profile and see that it goes on..

OGNUSDT 1D AnalysisOGN ~ 1D Analysis
#OGN Buy gradually from here if you still have a Conviction on this coin with a short -term target of at least 10%+.

OGNUSDT 1WOGN ~ 1W Analysis
#OGN This trade is very high risk. Buy from here with a short -term target of at least 20%+. This is the lowest support for now.

#OGN (SPOT) entry (0.0900- 0.1200)T.(0.5500) SL(0.0876)BINANCE:OGNUSDT
#OGN/ USDT
Entry ( 0.0900- 0.1200)
SL 1D close below 0.0876
T1 0.2000
T2 0.3000
T3 0.4400
T4 0.5500
1 Extra Targets(optional) in chart, if you like to continue in the trade with making stoploss very high.
______________________________________________________________
Golden Advices.
********************
* collect the coin slowly in the entry range.
* Please calculate your losses before the entry.
* Do not enter any trade you find it not suitable for you.
* No FOMO - No Rush , it is a long journey.
Useful Tags.
****************
My total posts
www.tradingview.com
1Million Journey
www.tradingview.com
www.tradingview.com
**********************************************************************************************
#Manta #OMNI #DYM #AI #IO #XAI #ACE #NFP #RAD #WLD #ORDI #BLUR #SUI #VOXEL #AEVO #VITE #APE #RDNT #FLUX #NMR #VANRY #TRB #HBAR #DGB #XEC #ERN #ALT #IO #ACA #HIVE #ASTR #ARDR #PIXEL #LTO #AERGO #SCRT #ATA #HOOK #FLOW #KSM #HFT #MINA #DATA #SC #JOE #RDNT #IQ #CFX #BICO #CTSI #KMD #FXS #DEGO #FORTH #AST #PORTAL #CYBER #RIF #ENJ #ZIL #APT #GALA #STEEM #ONE #LINK #NTRN #COTI #RENDER #ICX #IMX #ALICE #PYR #PORTAL #GRT #GMT #IDEX #NEAR #ICP #ETH #QTUM #VET #QNT #API3 #BURGER #MOVR #SKL #BAND #ETHFI #SAND #IOTX #T #GTC #PDA #GMX #REZ #DUSK #BNX #SPELL #POWR #JOE #TIA #TFUEL #HOT #AVAX #WAXP #OGN

Origin Protocol (OGN)Origin Protocol is one of Ethereum’s longest-standing DeFi projects, featuring a multichain feature set that unlocks vast opportunities for yield generation for Origin’s liquid staking across the various blockchains.
Anyway, OGN chart seems promising. OGN broke the major downtrend line, made a double bottom, then broke the minor downtrend line too. Have to wait and see how high OGN can go. Let's see what happens.

Is #OGN Ready for a Bullish Reversal or More Downward Move?Yello, Paradisers! Is #OGNUSDT finally going for the breakout or another fake-out? Let's dive into the latest analysis of #OriginProtocol!
💎After 4-5 months of a slow and steady downtrend, #OGN is approaching a critical turning point. The price is currently testing the upper boundary of a Descending Channel, fueled by a strong bounce from the major support zone between $0.072 and $0.078.
💎To truly spark this rally, #OGN needs to clear a key obstacle—the minor resistance between $0.114 and $0.155, which previously acted as a strong support level. A breakout above this area, confirmed by increasing volume and the 20 EMA, could mean the bulls are ready to take over. If this happens, brace yourselves for a move toward the next major resistance.
💎If momentum stalls, we could see a pullback toward that crucial support zone between $0.072 and $0.078, retesting the breakout level. Failing to hold here could spell trouble, with #OGN potentially sliding back down to the $0.059 demand zone.
💎And here’s the real risk—if it breaks below that support, the bears will likely regain control, triggering a deeper correction and crushing any hopes of a short-term bullish recovery.
Stay focused, patient, and disciplined, Paradisers🥂
MyCryptoParadise
iFeel the success🌴

OGNUSDT(OriginProtocol) Updated till 14-09-24OGNUSDT(OriginProtocol) Daily timeframe range. PA staying above 0.0917 will be more optimal here. below that is a trouble zone. a valid confirm close above 0.0917 can push it toward 0.1145. some volume can help it on that if it comes.

OGN ANALYSIS (4H)We have a bullish CH on the chart and a strong move on the chart. The structure of OGN has recently become bullish.
We have a good support range on the chart.
If the price reaches the green range, we will look for buy/long positions.
The targets are clear on the chart.
Closing a daily candle below the invalidation level will violate the analysis
For risk management, please don't forget stop loss and capital management
When we reach the first target, save some profit and then change the stop to entry
Comment if you have any questions
Thank You

OGNUSDT(Origin Protocol) Daily tf Range Updated till 25-05-24OGNUSDT(Origin Protocol) Daily timeframe range. steadily tracing back. clean brokeout of 0.1679 and if it stays above this, it will visit 0.2259 again. a easy setup played out from swing low which is from 0.1243. smooth decent profit there.
OGNI believe that OGN can touch red levels at least ... trade it only if u know what is DCA 🧐 ... it can pump directly(Blue scenario) or do the white scenario first.

OGNUSDT.4HIn the OGN/USDT 4-hour chart, we're seeing a clear ascending trendline indicating upward momentum over time. The chart includes the RSI and MACD indicators, which provide insight into the momentum and potential trend reversals.
The RSI is just below 60 at 59.20, which is typically considered bullish, but not excessively so — it's not in the overbought territory (above 70) that might suggest an impending correction. The MACD is almost imperceptibly above the signal line and close to the zero line, suggesting only a slight bullish momentum.
The price is currently between the support level (S1) at $0.1967 and the resistance level (R1) at $0.2866. The proximity of the price to R1 suggests that if the price can break and hold above this level, it could move toward the next resistance (R2) at $0.3238.
Given the ascending support line and the price's current level, the chart has a bullish look. The support levels below, S2 at $0.1575 and further down S3 at $0.1079, are significant in that a break below the ascending trendline and S1 could signal a potential reversal of the current trend and a test of lower supports.
As for a trading strategy, I would look for a confirmation of the breakout above R1 with an increase in volume to enter a long position. Conversely, if the price were to break below the ascending trendline and S1, it would be prudent to consider exiting long positions or potentially taking a short position, with appropriate risk management strategies like stop losses placed just below S1 or the trendline to limit potential losses. The use of further confirmation, such as candlestick patterns or additional indicators, could enhance the robustness of these entry and exit points.

$OGN about to make a 17x move before 1 March 2024? Target: 2.6$Today we are analyzing Origin Protocol. Currently very bullish looking at the chart and have a target of 2.6$ for the upcoming 3 months.
That is a 1700%+ move, crazy right? But there is a reason for this crazy thought. There has been some historical developments that are happening right NOW, just before it made a 3000% move in 2021.
We are seeing the same things:
Since 14 february 2021:
Not shown on this chart. The 20 and 50 SMA has crosse the 100 day SMA on the 2D chart. Last time this happened was just before the major spike up.
Since 30 july 2022:
Not shown on chart. MACD cross on the 10D and still holding positive cross. Last time this happened was 21 january 2021. Another positive indicator that shows a green sign.
Since 15 april 2021:
The price of OGN has been in an continues downtrend. The triangle as shown on the chart (white lines) shows where the resistances are. Currently it is flirting with a 2.5+ year resistance. We are bound to break out!
Since 1 June 2023:
The RSI has been in an continues uptrend now nearing RSI above 90+.
Look at the pink circles. The last time this happened it move 2900% in 48 days.
Since 10 july 2023:
Not shown on chart. We see a massive increase of volume, pay attention, volume not price! Even double the volume of what we asaw in the bullrun of 2021 where the price went parabolic. This is a clear sign of accumilation of the smart hands and whales. Slowly, but surely filling their bags before they it gets send.
Since 25 nov 2023:
Gaussian Channel turned Green on the 4D (!).

OGN/USDT Keep an eye on the demand area, Potential bounce back!💎 OGN has recently encountered significant developments in the market. There is potential for OGN to retest the demand area around $0.198 before resuming its upward movement and possibly reaching our target area.
💎 The demand area holds significant importance, as a strong bounce from this level could signal continued upward momentum for OGN.
💎 However, if OGN breaks down below the demand area, it would indicate a shift to bearish sentiment. Additionally, if the breakdown extends to the support trendline, it could lead to further downward movement.

Exploring the Potential of OGV (Origin Governance) As the digital currency landscape continues to evolve, one token that's been drawing attention from the trading community is OGV (Origin Governance). This token represents a significant step forward in decentralized finance (DeFi), offering users a unique opportunity to participate in the governance of the Origin platform.
What Makes OGV Stand Out?
OGV is not just another token in the vast sea of cryptocurrencies. It's the backbone of the Origin platform's governance model, allowing token holders to influence decisions and the future direction of the ecosystem. This level of engagement is what many investors and enthusiasts find appealing, as it provides a sense of ownership and contribution to the project's success.
The Future of OGV
While the cryptocurrency market is known for its volatility, the underlying technology and community support of OGV suggest a promising future. The team behind Origin has continuously worked on enhancing the platform's features and usability, aiming to make decentralized finance more accessible and efficient.
OGV (Origin Governance) presents an intriguing opportunity for those interested in the governance and development of a leading DeFi platform. Its unique position in the market and the ongoing efforts of the Origin team could make it a noteworthy token in the days ahead. However, remember to approach trading with caution and make informed decisions.

OGN LOOKS BULLISHOGN appears to be completing a very large triangle.
It seems that wave D of this triangle is now in its full state.
It is expected that it will move towards the targets along with the fluctuation in the coming weeks and months.
Closing a daily candle below the invalidation level will violate the analysis.
For risk management, please don't forget stop loss and capital management
When we reach the first target, save some profit and then change the stop to entry
Comment if you have any questions
Thank You

[OGNUSDT] - catch it before bullish🔥Breakout the rising wedge on 3d chart has confirmed.
Expecting get 0.7$ for midterm
Patience get rewarded 🎯
Don't forget to support us with your like, comment and follow for more updates 🎯

OGN/USDT - Origin Protocol: Trend Reversal◳◱ On the $OGN/ CRYPTOCAP:USDT chart, the Trend Reversal pattern suggests a pause in volatility, potentially gearing up for a breakout. Traders might observe resistance around 0.1813 | 0.1941 | 0.2189 and support near 0.1565 | 0.1445 | 0.1197. Entering trades at 0.1739 could be strategic, aiming for the next resistance level.
◰◲ General info :
▣ Name: Origin Protocol
▣ Rank: 439
▣ Exchanges: Binance, Kucoin, Bybit, Huobipro, Gateio, Mexc
▣ Category/Sector: N/A
▣ Overview: Origin Protocol aims to create the sharing economy marketplaces.
◰◲ Technical Metrics :
▣ Mrkt Price: 0.1739 ₮
▣ 24HVol: 3,734,776.197 ₮
▣ 24H Chng: 1.163%
▣ 7-Days Chng: 2.70%
▣ 1-Month Chng: 15.01%
▣ 3-Months Chng: 30.15%
◲◰ Pivot Points - Levels :
◥ Resistance: 0.1813 | 0.1941 | 0.2189
◢ Support: 0.1565 | 0.1445 | 0.1197
◱◳ Indicators recommendation :
▣ Oscillators: NEUTRAL
▣ Moving Averages: STRONG_BUY
◰◲ Technical Indicators Summary : BUY
◲◰ Sharpe Ratios :
▣ Last 30D: 2.63
▣ Last 90D: 2.05
▣ Last 1-Y: 0.56
▣ Last 3-Y: 0.52
◲◰ Volatility :
▣ Last 30D: 0.53
▣ Last 90D: 0.77
▣ Last 1-Y: 1.13
▣ Last 3-Y: 1.52
◳◰ Market Sentiment Index :
▣ News sentiment score is N/A
▣ Twitter sentiment score is 0.75 - Bullish
▣ Reddit sentiment score is 0.63 - Bullish
▣ In-depth OGNUSDT technical analysis on Tradingview TA page
▣ What do you think of this analysis? Share your insights and let's discuss in the comments below. Your like, follow and support would be greatly appreciated!
◲ Disclaimer
Please note that the information and publications provided are for informational purposes only and should not be construed as financial, investment, trading, or any other type of advice or recommendation. We encourage you to conduct your own research and consult with a qualified professional before making any financial decisions. The use of the information provided is solely at your own risk.
▣ Welcome to the home of charting big: TradingView
Benefit from a ton of financial analysis features, instruments and data. Have a look around, and if you do choose to go with an upgraded plan, you'll get up to $30.
Discover it here - affiliate link -

OGNUSDT 114% Surge ForecastGet ready to witness some fireworks because OGNUSDT is on the brink of a major breakthrough according to our analysis. This coin isn't just a blip on the radar—it's riding a long-term uptrend, paying its respects to that trendline like a loyal follower.
But hold onto your excitement! We're forecasting an ascent of about 114% from the present price, aiming to test the waters at the formidable double Fibonacci resistance sitting snugly at $0.34. That's not just any resistance level; it's like the final boss in a video game—challenging, but oh-so-rewarding if conquered.
This journey promises excitement, anticipation, and the potential for a jaw-dropping ascent.

OGNUSDT.1DBased on the provided market data, the OGN/USDT pair is currently priced at 0.17 USDT. The Relative Strength Index (RSI) on the 4-hour, 1-day, and 7-day charts are 47.61, 64.69, and 69.66 respectively. This indicates a neutral to slightly overbought market condition. The Moving Average Convergence Divergence (MACD) on the 4-hour, 1-day, and 7-day charts are 0.0020, 0.0041, and 0.0158 respectively, which also suggests a neutral market trend.
Looking at the Bollinger Bands (Bb), which are 0.1847 for both 4-hour and 1-day charts and 0.1850 for the 7-day chart, the price is currently near the lower band, indicating a potentially undervalued condition.
The support levels on the 4-hour chart are 0.1627, 0.1526, and 0.1450 while the resistance levels are 0.1973, 0.2070, and 0.2230. On the 1-day chart, the support levels are at 0.1620, 0.1520, and 0.1407, and resistance levels at 0.1707, 0.2260, and 0.2370. For the 7-day chart, supports are at 0.1430, 0.1047, and 0.084, and resistances are at 0.25, 0.28, and 0.37.
Overall, the market condition for OGN/USDT seems to be neutral to slightly overbought. However, the price is near the lower Bollinger band which could indicate it is undervalued. It might be a good opportunity to buy if the price bounces back from the support levels. However, if the price breaks the support level, it may continue to fall. As always, it's important to consider other market factors and your own risk tolerance when making investment decisions.
