OGN/USDT - Potential Short ScenarioHello Traders!
OGN price is currently consolidating in a narrow range of $0.1900 - $0.2750.
Using the analysis of higher timeframes, it is possible to assume another wave of decrease. In this case, it is possible to consider medium-term purchases in the range of $0.1100 - $0.1525.
The targets for such purchases will be the levels of $0.2750 and $0.4500.
Good luck and watch out for the market
P.S. This is an educational analysis that shall not be considered financial advice
OGN

OGNUSDT 1d ANALYSISThere is a fork in the road between the two.
<1>It is a perspective that goes up with support for a low point that has never been broken.
<2>The view is that it breaks the low point and goes down more after the retest when 1d is completed.

OGN clear break out and trend lines#OGN/USDT
there is a clear break out so price can continue its rally toward ascending trend line that is the same with resistance zine around $0.26

OGN BUY THE BREAKOUTBlue * 2 in high timeframe
Red -> Green in upper ribbon
BUY the breakout
ORIGIN PROTOCAL, OGN, OGNUSD , OGNUSDT , CRYPTO,CRYPTOCURRENCY
DISCLAIMER
This is only a personal opinion and does NOT serve as investing NOR trading advice.
Please make your own decisions and be responsible for your own investing and trading Activities.

OGN, reliable level to go in. Hi, it's very logical in my opinion. First of all, bitcoin is $20k and every other asset has big discount. If you believe in this project and you check history you see $0,27 isn't very much for OGN. If you look at the left side, history shows that on this level we are NOW on, traders are most confident in buying/selling. So I expect heavy price action. Also, you see a tripple bottom (recently made) The green area is a level that is tested, failed, tested, failed and now I hope that it is going to find support.
Don't mind my English, I'm a foreigner.

OGN/USDT #OGN/USDT 10-20X LONG
OGN/USDT looks good on 4HR time frame moving along rectangular support price has taken reversal several times from this region. Currently in Fib Golden Pocket. POC is also aligning with in the demand zone
◼️Entry: $0.2752 - $0.2681
🟢 Target 1 : 0.2770
🟢 Target 2 : 0.2880
🟢 Target 3 : 0.2988
🟢 Target 4 : 0.3059
🟢 Target 5 : 0.3270
🛑SL : 0.2437

ORIGIN PROTOCOLOGN/USDT Strong Resistance zone forming Bearish Fllag waiting to drop Down in SHORT on this Coin


OGN LONG TRADE 20220616Blue -> Green * N
ORIGIN PROTOCAL, OGN, OGNUSD , OGNUSDT , CRYPTO,CRYPTOCURRENCY
DISCLAIMER
This is only a personal opinion and does NOT serve as investing NOR trading advice.
Please make your own decisions and be responsible for your own investing and trading Activities.

OGN - OGNBTC Bullflag (LONG)Observe the 2D chart above.
Breakout from the bullflag, with extension marked on the chart.
Also a Bollinger Band squeeze can be observed on the 2D USDT pair.
TImeframe: No idea
Return: 1x-1.3x
Leverage: 2-3x

OGN is Good on Daily chartHello , Guys Look at chart and decide
OGN is targeting the white targets on the chart specially the Yellow one next days .
It is not a financial advice and plz DYOR.
Good luck

OGN/USDT BULL FLAG BREAKOUT! LONG TRADE SETUP!!Hello everyone, if you like the idea, do not forget to support with a like and follow.
Welcome to this OGN/USDT TRADE setup. OGN looks good here.
OGN is breaking out from the bull flag in 1hr time frame. Buy some now and add more in the dip.
Entry range:- $0.62-$0.64
Target:- 20%
SL:- $0.60
Lev:- 10x
If you like this idea then do support it with like and follow.
Also, share your views in the comment section.
Thank You!

Will OGN continue its uptrend? - Here's the entry levelHere's a quick look at the OGN 2 hr chart. As we can see, the price broke out previously from the bull flag and is now trying push further to the upside. If you didnt catch the immediate breakout form the bull flag, Then the best entry would be when the price breaks above 0.66$ with good amount of volume. Definitely one to keep an eye on!
-------------------------------------------
The idea is: Buy when the price breaks above 14.4$ and take profits at the levels shown in the chart.
Targets:
1. 0.68$
2. 0.72$
3. 0.76$
-------------------------------------------
What Is a Wedge in the context of trading?:
"A wedge is a price pattern marked by converging trend lines on a price chart. The two trend lines are drawn to connect the respective highs and lows of a price series over the course of 10 to 50 periods. The lines show that the highs and the lows are either rising or falling and differing rates, giving the appearance of a wedge as the lines approach a convergence. Wedge-shaped trend lines are considered useful indicators of a potential reversal in price action by technical analysts.
Key Takeaways for Falling wedges:
1. Wedge patterns are usually characterized by converging trend lines over 10 to 50 trading periods.
2. The patterns may be considered rising or falling wedges depending on their direction.
3. These patterns have an unusually good track record for forecasting price reversals."
-------------------------------------------
If you like the content, then make sure to comment and like the post :D
Follow me for daily profitable trading setups
BTC dictates the market. If BTC falls, then Alts will fall as well. Trade safe!

OGNUSDT AT SUPPORTPotential Reversal - AT SUPPORT
It's hit a big support at 0.6173 - none financial advice but it has a good chance of going up to capture 0.70

OGN Bullish Flag PatternHello Traders
OGN is very bullish.
Good fundamentals and huge buy volumes in last few weeks made a good rally.
Also it had a good correction and right now price seems created a bullish flag pattern that could push the price to 1.09 - 1.19 $ per token.
Like, Follow and Share Please.
Stay Safe.
Thanks For Reading.
-RC

OGNUSDTIf OGNUST had a retracement we will buy @0.546 by 12% of our trading balance,
and our Stop-loss @ 0.501
and another buy limit order @ 0.52 by 25% from the trading balance. SL: 0.501
Target: 0.625

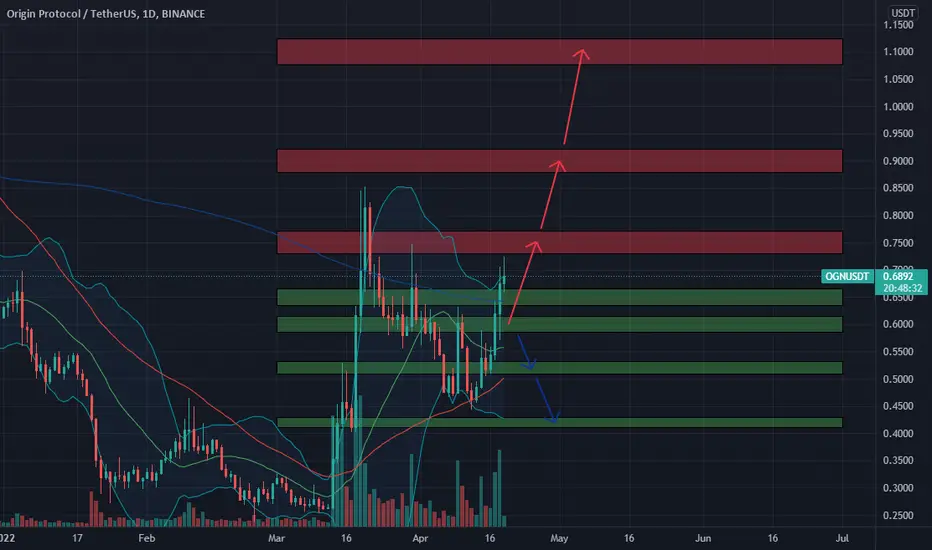
🆓Origin Protocol (OGN) Apr-19 #OGN $OGN
OGN may continue to increase strongly in the near future with the buying force being continuously pushed in. The $0.6 zone is the important support zone of this uptrend.
📈RED PLAN
♻️Condition : If 1-Day closes ABOVE 0.6$ zone
🔴Buy : 0.65 - 0.6
🔴Sell : 0.75 - 0.9 - 1.1
📉BLUE PLAN
♻️Condition : If 1-Day closes BELOW 0.6$ zone
🔵Sell : 0.6
🔵Buy : 0.52 - 0.42
❓Details
📈Red Arrow : Main Direction as RED PLAN
📉Blue Arrow : Back-Up Direction as BLUE PLAN
🟩Green zone : Support zone as BUY section
🟥Red zone : Resistance zone as SELL section
OGNUSDT SETUPOGNUSDT price retested the buying zone and bounce after printing a strong breakout. As we know markets are already in a pullback scenario, So One can accumulate OGN at these levels for a good upside move.

OGN : To 3.40 ? (Final Updated) Global view
Entry : Wait for pull back from support (0.5429/0.5283/0.5060)
or if 0.5700 holds
.
It looks so,
I'm grateful for every bounce it made
even though i only keep getting in& out
.
Apart from SHIB, This is another yummy one <3

the lowest level of the 2nd wavecrab harmonic pattern:
X=$5.49
AB=0.38 XA
BC=0.88 AB
0.78 BC=$0.339
0.88 BC=$0.390
1.6 BC=$1.1
2 BC=$1.88
0.78 XA=$2.32
2.24 BC=$2.64
0.88 XA=$3.47
2.6 BC=$4.5
1.13 XA=$9.26
1.27 XA=$16.39
3.6 BC=$18.46
1.41 XA=$28.56
4.23 BC=$44.16
1.6 XA=$65.95

Origin Protocol making a base for the 2nd wavecrab harmonic pattern:
X=$17
A=$0.085
AB=0.38 XA
BC=0.88 AB
0.78 BC=$0.438
0.88 BC=$0.524
1.6 BC=$1.95
2 BC=$3.87
0.78 XA=$5.48
2.24 BC=$5.96
0.88 XA=$9.32
2.6 BC=$11.74
1.13 XA=$34
3.6 BC=$70
1.41 XA=$150
4.23 BC=$214
1.6 XA=$453X=$17
A=$0.085
AB=0.38 XA
BC=0.88 AB
0.78 BC=$0.438
0.88 BC=$0.524
1.6 BC=$1.95
2 BC=$3.87
0.78 XA=$5.48
2.24 BC=$5.96
0.88 XA=$9.32
2.6 BC=$11.74
1.13 XA=$34
3.6 BC=$70
1.41 XA=$150
4.23 BC=$214
1.6 XA=$453

is OGN ready to pump?crab harmonic pattern:
X=$11.58
A=$0.0059
AB=0.61 XA
BC=0.38 AB
0.78 BC=$0.44
0.88 BC=$0.526
1.6 BC=$1.95
0.78 XA=2.29
2 BC=$3.88
0.88 XA=4.86
2.24 BC=$5.97
2.6 BC=$11.77
1.13 XA=$30.68
3.6 BC=$70.86
1.27 XA=$90.66
4.23 BC=$214.8
1.41 XA=$257
1.6 XA=$1242

Digital currency analysis ogn
I think this digital currency is ready to jump up again, I have good targets for it, let's look at its analysis together.
If you like to analyze every day, be sure to follow fractal_analysis98
