Origin Protocol 150% Move to $4Update 05/05/21: Origin Protocol 150% Move to $4 from DCA Zone. Since the 27th March Origin Protocol has increased in price by over 300% in this parabolic move from $0.78 to $3.36 and has since retraced down 50% to $1.62. Use Buy Zone to map out your buys. Happy Trading :)
Updated: 27/04/21
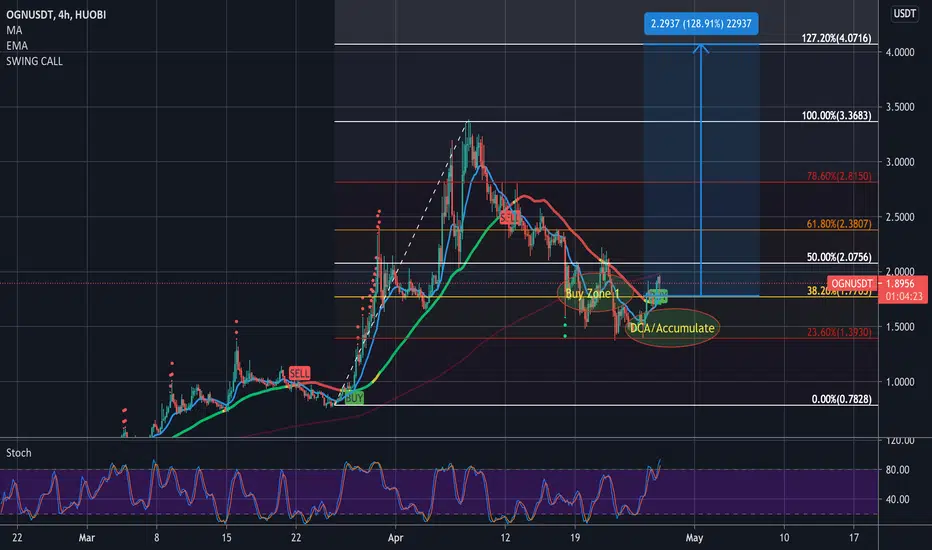
Origin Protocol 128% Move to $4 @ 127.20% Fibonacci level from Buy Zone 1. Since our Buy Script triggered a Buy Signal on the 27th March, Origin Protocol continued to rise for 13 days to an ATH of $3.36, which is just over 280% Gain. OGN has had a healthy retracement bouncing from the 38.20% Fibs from this impulsive move which saw OGN grow from $0.78 to $3.36 in just under 2 weeks. Use Buy Zone to map out your buys. Happy Trading :)
OGNUSDT

FLAAAAAAAAAAAG🔝Hey, folks🔥
Get ready to trade
There is a flag formation on OGN/USDT crypto pair.
Price had strong bullish sentiment before this consolidation.
Then it bounced from support and resistance zones multiple times.
Then there was a bullish breakout.
Possible retest of zone is expected.
However price may increase without any retests.
So follow the chart and look for the breakout carefully.
_____________________________________________________
If you enjoy my FREE Analysis , support the idea with a big LIKE👍 and don't forget to SUBSCRIBE my channel, you won't miss anything!
Feel free to leave comments✉️
And always remember: "we don't predict, we react".

Origin Protocol 128% Move to $4Updated: 27/04/21
Origin Protocol 128% Move to $4 @ 127.20% Fibonacci level from Buy Zone 1. Since our Buy Script triggered a Buy Signal on the 27th March, Origin Protocol continued to rise for 13 days to an ATH of $3.36, which is just over 280% Gain. OGN has had a healthy retracement bouncing from the 38.20% Fibs from this impulsive move which saw OGN grow from $0.78 to $3.36 in just under 2 weeks. Use Buy Zone to map out your buys. Happy Trading :)


Origin Protocol 128% Move to $4 from Buy Zone 1Origin Protocol 128% Move to $4 @ 127.20% Fibonacci level from Buy Zone 1. Since our Buy Script triggered a Buy Signal on the 27th March, Origin Protocol continued to rise for 13 days to an ATH of $3.36, which is just over 280% Gain. OGN has had a healthy retracement bouncing from the 38.20% Fibs from this impulsive move which saw OGN grow from $0.78 to $3.36 in just under 2 weeks. Use Buy Zone to map out your buys. Happy Trading :)


OGNUSDT 🌱 on the Daily for 360 Comp*NOT FINANCIAL ADVICE: DYOR - This idea IMO for personal use only*
==========================
We can anticipate further brief consolidation as we approach the apex of pennant formation from last week's breakout (and ATH / testing the resistance line from channel).
Waiting now for decent volume for the breakout of this pennant.
The support and resistance lines are from the channel on monthly view.
This is Trade only opp for me, not a HOLD strategy for now.
As always:
Do your own research. Always be watching BTC .
You do you, I'll do me & my own strategy.
Just an idea. Good chat.🤖

OGNUSDT 4H I think the price is ready for rise movement but it seems there are a HD- and price need to one more down movement
EMA is an important resistance for traders and when price breaks it , we can make a better decision

origin protocol 1-H analysis (OGNUSDT)in 1 hour time frame OGNUSDT seems that it is going to finish wave 5 of the bigger correction.
wait for confirmation and buy on the box zone if supported.
Good luck
Don't forget money management
drop like to give us energy!

OGNUSDT critical pointIn the next few hours we may see a large movement depending if it's breaks the support line or not, as explained in the chart.


OGNUSDT: Go for Long Term $2.9 and $3.2 are the two key pointslooking at the OGNUSDT price we can clearly see the uptrend.
The price has declined from the pitchfork and it moves near the below boarder.
$2.9 and $3.2 are the two key prices that will show us where we will head up in the future.
at a $3.2 it seems that pitchfork is going to continue while at $2.9 a new analysis might be needed.
__________________
Origin team has announced great news regarding the NFT space, so there is a huge hype that the price is going to be pushed by newcomers.
FOLLOW US FOR MORE!
HAPPY GAINS AND HAPPY TRADING EVERYONE!

The Bullish Cup Chart PatternAn attractive and spectacular example of a cup chart pattern (ascending type) in #OGNUSDT.
In this model, we expect the price to increase as much as the depth of the cup after the formation of the cup handle and the broken ceiling out due to the edge of the cup.
This benefit will go to those who are patient in their transactions.
Not a buy signal.
********************************
Dear followers and users of TradingView. I am glad to share my ideas and analysis with you.
Please support me with your LIKES and COMMENTS below this idea.
Sincerely, Piroozman.
Good luck.

Buy the OGN breakout for a 30% run. OGN has been on a consistent uptrend and is yet to lose steam. Breakout above this 3.40 level is confirmation for another 30% run.

OGNUSDTOGN did a great pump but I still think it still got some more energy to go up.
It's the second hot coin on Binance right now.
Just follow these tips: Open your long positions after it confirms a 4H candle above it. (above the orange line as shown on chart)
Then hold it for desired profits but don't get greedy because it's got a strong resistance.
⚠️ NOTE: This usually happens when a coin gets hot on crypto platforms: it might go down by a little and then get back up to a new high.
Good Luck 🎲
Tell me your ideas. Like and Share 🗣✅

OGN when to buy!OGN had a good pump and now it is cooling down, so right now should not fomo when it kind of looks like breaking out as most can be just small pumps.
OGN will drop more over the coming days and have drawn a buy zone, you could put your buy limit either at the top to be sure it get bought or at the bottom for more, but of course the lower the bigger the chance it might not get triggered. Once it hit the buy zone you would have more coins anyways and when it goes up again you get more gains.


OGN going to $3 with high probabilityIt's a 250M market cap coin at current $1 and is easily worth 1B, or 5x from here alone (at the minimum).
Severely under the radar project. Going to announce K-POP NFT partnerships shortly.
I have bags from 50 cents.
Some pros:
- amazing marketing team and transparent, probably the best of all cryptos
- staking APY of 25%, keeps supply out of hot wallets
- partnering with Amazon to take out Shopify
- Mark Cuban's public wallet address shows 50,000 coins held

Origin protocol looks bullish AF again!Second time we're making a falling wedge
I drew the comparison with the last smaller falling wedge.
Lets see whats happends next;)

OGNUSDT Adam and EveHello Traders. Adam and Eve. See the chart for entry and possible exit. Good luck!
