OGNBTCogn is located in a support area and the growth rate is high up to 750 Satoshi area. Professors' comments are respectable. Please comment.
OGNUSDT

ogn upQuestion like «Why is ogn dumping this much if it's a great project?» Or «what good news come out today that the price have been pumping?» remind me every time that you must know how the market works before buying something, let me tell you what i think about ogn chart then.
•Doble bottom
•Acumulation pattern
•Broken resistance/divergence
•beautiful testing at support

OGNUSDT AnalysisEngineeringRobo and I are bullish about OGN at the moment.
If you are holding OGN, continue to hold and aim to sell at the 0.1960 resistance level or the downtrend line.
If you are interested in buying, you could buy now as the Buy 4 signal fired very recently. Alternativly, you could buy at the 0.1454 support level.
Whatever level you choose to buy, you should pay closely for EngineeringRobo sell signals!
If you're interested in using EngineeringRobo, DM me!


Middle Term Analysis for OGN-USDTHi everyone,
I calculated my targets according to the availability of indicators and fibonacci ranks.
My targets:
$0.3190
$0.2340
$0.2057
$0.1849
$0.1673
$0.1548
This analysis is not investment advice. You should do your own research. These are my personal targets.

OGN prediction looking good !Origin protocol is showing multiple bullish signs mid-term . Explained on chart. :)
Also I made a Ghost feed prediction based on current trend and momentum and I've set my price target. See Chart
however if you're looking for swing trades or short-term holding i would recommend you to stay in USDT to avoid any losses.
But you only lose when you sell so... it's your decision guys ! :D
My recommendation for now regarding the Crypto Market overall is to keep at least 25% of your holdings in USDT
to buy lower-lows :D
Be safe everyone ! You can also suggest me Cryptocurrencies for future TA in the comments below !


OGN/USDT the time has come1.divergence in RSI
2.Return from fibo 78%
3.if stay above MA200 for a few hours it can grow well.
4.The volume of buyers has increased.
5.Return frome 4h zone

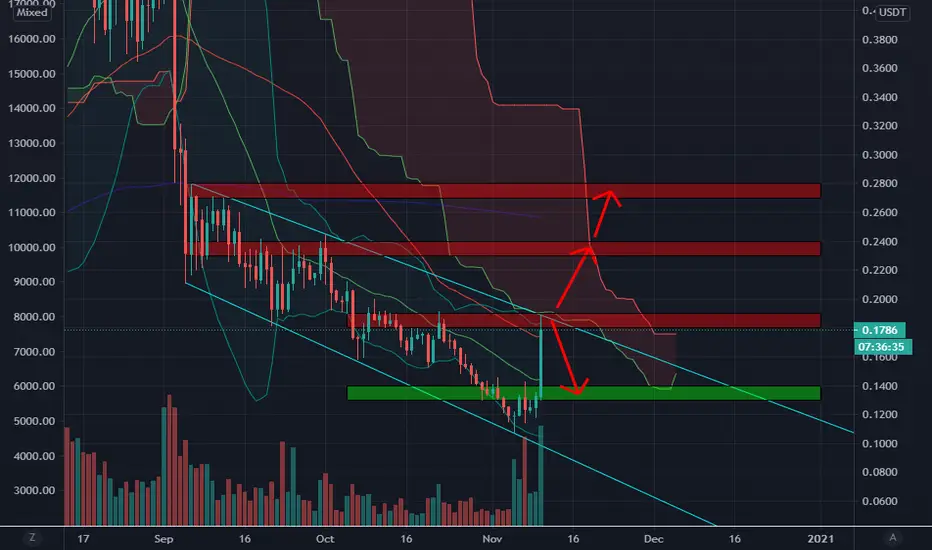
✳️Origin Protocol/USDT (10/11) View + Trading Plan #OGN $OGN
OGN is rising very strongly and is at the 0.18-0.19$ resistance of the Broadening Falling Wedge pattern so this is the zone we need to watch out.
If OGN closes a 1D candle above this zone, then OGN can completely pump hard to the 0.24$ and 0.28$ zones in the next few days.
But if that doesn't happen, OGN will correct to the 0.14$ zone
📈BUY- LONG
-Buy: 0.13-0.14$, stoploss if B
📉SELL-SHORT
-Sell: 0.18-0.19$, stoploss if A
♻️BACK-UP
-Buy close to 0.18-0.19$ if A, stoploss if B
-Sell: 0.23-0.24$, stoploss if A
-Sell: 0.27-0.28$, stoploss if A
❓Details:
Condition A : "If 1D candle closes ABOVE this zone"
Condition B : "If 1D candle closes BELOW this zone"

✳️Origin Protocol/USDT (16/11) View + Trading Plan #OGN $OGNOGN has successfully consolidated the 0.15-0.16$ zone and is ready to move up in the near days. It is heading to the 0.25$ and 0.4$ zones
📈BUY- LONG
-Buy close to 0.15-0.16$, stoploss if B
📉SELL-SHORT
-Sell: 0.24-0.25$, stoploss if A
-Sell: 0.39-0.04$, stoploss if A
♻️BACK-UP
-Sell close to 0.15-0.16$ if B, stoploss if A
-Buy: 0.1-0.11$, stoploss if B
❓Details:
Condition A : "If 1D candle closes ABOVE this zone"
Condition B : "If 1D candle closes BELOW this zone"

OGNUSDT AnalysisEngineeringRobo and I are both bullish about OGN at the moment.
There are currently 3 buy signals present and price is just sitting above the 0.1661 support level, so if you are interested in buying OGN, now would be a good time to buy.
Pay close attention for EngineeringRobo sell signals or you can aim to sell at the 0.3155 resistance level.
If you're looking to use EngineeringRobo, DM me!

OGN/USDT : next candles will change movement ! BINANCE:OGNUSDT
Hello everyone😃
OGN Broke Cloud and some how take hold above it, But its not a sign of Bullish.
On daily timeframe, OGN rejected from cloud and Stochastic is touching 100 limit.
Also MACD is weak to break resistance !!
So its more possible to retest bottom...
By the way If OGN breaks cloud and resistance and take hold above them, Then its safe to take long until 0.27$
🔴Indicators are being bearish also on daily timeframe, there is no sign of bullish movement, So wait for confirmation above resistance to take long
Attention : this is not a financial advise we just try to help people on their own vision.
HAVE A GOOD DAY
- Helical_Trades

OGN Fractal ConsolidationHi Everyone! As you can see my chart is playing out as planned. It has broken out of the falling wedge and is consolidating with a previous move from a few months ago, as illustrated by my fractal. If it continues to consolidate you should see this coin hit target 1 and target 2 during this new alt cycle. Looking at some amd gains if you long this coin! Get involved and let me know what you think! :D

OGN/USDT Bottoming/Fractal ConsolidationCan not wait for alt season to begin! I feel any bitcoin investment will not be profitable for myself as a small investment promises a small return. However in the mean time I have been keeping my eye on a few alts ready for the season to begin. OGN is a coin I believe is bottoming. A falling wedge shape pattern into a previous support and resistance zone, the rsi indicators are oversold and the mac d seems to be pretty quiet. The fractal consolidation pattern from march - august may just be coincidental. I am hoping it bounces of the bottom support line and begins it's accumulation phase, I hope to be buying in at the point, who knows?
Any thoughts and opinions welcome :) Thanks!

Ogn/usdt possible senario( Origin protocol )
Ogn/usdt dropped around 75% from its top in 13 August ..but looks like the bleeding will continue at least short term
Possible senario :
Ogn/usdt trading now at 0.17$
And it faces falling wedge trendline resistance
If it break 0.1550$ below (weak support) and closed below then i think about sell/short position to first key support around 0.1400$
If it breaks also then it will move to second key support around 0.1100-0.1200$
I wont think about buy unless it visit one of key supports then break the falling wedge trendline resistance
Or forming base of support around the second key support and with tight stoploss
Hope this analysis help
Support us by like and comment
Good luck

OGN BTC - Expect some profits One of the good project which is already seems to be in bottom. This trade is for short term anyhow if it breaks the channel we might see some good profits. Here's the trade setup
Buy - 0.1637
Sell - 0.1855
SL - 0.1521

OGNUSDT AnalysisAt this moment, there are 3 SELL signal present and I'm BEARISH .
So, I don't think this is a good time to buy yet.
If you want to buy again, we have 3 different options.
1- You can wait for EngineeringRobo's BUY signals to be present,
2- You can wait for candles to open-close above resistance level (0.23) for 1D to buy,
3- You can buy when candles touching the support line (0.10)
After you buy, please watch out for EngineeringRobo's sell signals and consider selling it.

OGN/USDT 4H analysis BINANCE:OGNUSDT
Hello everyone.
As we can see :
- Convergence recently
- BBs basis supports movement
- EMA 20 is support
- EMA 50 is resistance
- Pullback from support line
- Stochastic RSI is in overbought zone
- MACD is narrow but bullish
- Support line on RSI
It seems OGN have potential for more pumps but we wont open position on USDT pair !!
This analysis is only uses for more vision on BTC pair..
Now we know it could be safe to open position on OGN/ BTC .
Here is the OGN/ BTC analysis :
Attention : this is not a financial advise we just try to help people on their own vision.
HAVE A GOOD DAY
- Helical_Trades


OGN D1: Best level to buy 15%/120% gains (SL/TP)BINANCE: OGN/USDT
Buy limit around: 0.15 -0.1590
Stop loss: 0.13
Target 1: 0.286
Target 2: 0.34
---------------------------------
Trading Involves High Risk
Information for reference only
Not Financial Advice
Please Exercise Risk Management.

OGN/USDT|Trend Analysis|Bearish Price Action|Key Levels Todays analysis – OGN/USDT – Bouncing after an impulse sell into long-term uptrend support.
Points to consider:
- Strong downtrend
- Bearish short-term PA
- Respecting long-term trend support
- Oscillators below 50
OGN/USDT is still trading within its immediate downtrend as it bounces after an impulse sell into trend support, a retest of daily resistance is likely.
Oscillators are below 50, this indicates weakness in the market as we continue to tread into oversold conditions.
PA needs to hold trend support with further consolidation within this region before reclaiming daily S/R and the 50 EMA to restore strength in the market.
Failing to hold trend support, price is likely to breakdown to structural support.
Overall, in my opinion, a long trade is validated as price reclaims key S/R levels and EMAs.
If you’ve read this far - thank you for following my work!
And as always,
Focus on you, and the money will too!
