OGN and 155 accumulation daysBINANCE:OGNUSDT
✅Before we start to discuss, I would be glad if you share your opinion on this post's comment section and hit the like button if you enjoyed it.
Thank you.
Last time after capitulation in 2020 OGN spent around 155 days in accumulation zone before move up!
If history rhymes we can see like almost all alts move up around October / November 2022
Possible Targets
➡️Red block - local resistance sellers zone
➡️Green box yearly support zone
➡️Capitulation can be realise if BTC drop again to 17K so alts can loose -70% from this current price! and its will be one more retest downtrend line
Hope you enjoyed the content I created, You can support with your likes and comments this idea so more people can watch!
✅Disclaimer: Please be aware of the risks involved in trading. This idea was made for educational purposes only not for financial Investment Purposes.
OGNUSDT

VTHOUSDT UPDATEVTHOUSDT is a cryptocurrency trading at $0.002696. Its target price is $0.003800, indicating a potential 45%+ gain. The pattern is a Bullish Falling Wedge, a reversal pattern signaling a trend change. This pattern suggests the downward trend may be ending. A breakout from the wedge could lead to a strong upward move. The Bullish Falling Wedge is a positive signal, indicating a potential price surge. Investors are optimistic about VTHOUSDT's future performance. The current price may be a buying opportunity. Reaching the target price would result in significant returns. VTHOUSDT is poised for a potential breakout and substantial gains.

BONKUSDT UPDATEBONKUSDT is a cryptocurrency trading at $0.003342. Its target price is $0.005000, indicating a potential 60%+ gain. The pattern is a Falling Wedge, a reversal pattern signaling a trend change. This pattern suggests the downward trend may be ending. A breakout from the wedge could lead to a strong upward move. The Falling Wedge is a positive signal, indicating a potential price surge. Investors are optimistic about BONKUSDT's future performance. The current price may be a buying opportunity. Reaching the target price would result in significant returns. BONKUSDT is poised for a potential breakout and substantial gains.

SNXUSDT UPDATESNXUSDT is a cryptocurrency trading at $1.865. Its target price is $3.000, indicating a potential 60%+ gain. The pattern is a Bullish Falling Wedge, a reversal pattern signaling a trend change. This pattern suggests the downward trend may be ending. A breakout from the wedge could lead to a strong upward move. The Bullish Falling Wedge is a positive signal, indicating a potential price surge. Investors are optimistic about SNXUSDT's future performance. The current price may be a buying opportunity. Reaching the target price would result in significant returns. SNXUSDT is poised for a potential breakout and substantial gains.

HOTUSDT UPDATEHOTUSDT is a cryptocurrency trading at $0.002318. Its target price is $0.003400, indicating a potential 50%+ gain. The pattern is a Bullish Falling Wedge, a reversal pattern signaling a trend change. This pattern suggests the downward trend may be ending. A breakout from the wedge could lead to a strong upward move. The Bullish Falling Wedge is a positive signal, indicating a potential price surge. Investors are optimistic about HOTUSDT's future performance. The current price may be a buying opportunity. Reaching the target price would result in significant returns. HOTUSDT is poised for a potential breakout.

HBARUSDT UPDATEHBARUSDT is a cryptocurrency trading at $0.30268. Its target price is $0.42000, indicating a potential 40%+ gain. The pattern is a Bullish Pennant, a continuation pattern signaling a potential breakout. This pattern suggests a brief consolidation before a strong upward move. The Bullish Pennant is a positive signal, indicating a potential price surge. Investors are optimistic about HBARUSDT's future performance. The current price may be a buying opportunity. Reaching the target price would result in significant returns. The Bullish Pennant pattern typically leads to a strong upward move. A breakout from this pattern could propel HBARUSDT to its target price.

XRPUSDT UPDATEXRPUSDT is a cryptocurrency trading at $2.4840. Its target price is $3.1000, indicating a potential 25%+ gain. The pattern is a Bullish Pennant, a continuation pattern signaling a potential breakout. This pattern suggests a brief consolidation before a strong upward move. The Bullish Pennant is a positive signal, indicating a potential price surge. Investors are optimistic about XRPUSDT's future performance. The current price may be a buying opportunity. Reaching the target price would result in significant returns. The Bullish Pennant pattern typically leads to a strong upward move. XRPUSDT is poised for a potential breakout.

PHAUSDT UPDATEPHAUSDT is a cryptocurrency trading at $0.3209. Its target price is $0.5000, indicating a potential 50%+ gain. The pattern is a Bullish Falling Wedge, a reversal pattern signaling a potential trend change. This pattern suggests that the downward trend may be ending. A breakout from the wedge could lead to a strong upward move. The Bullish Falling Wedge is a positive signal, indicating a potential price surge. Investors are optimistic about PHAUSDT's future performance. The current price may be a buying opportunity. Reaching the target price would result in significant returns. This pattern typically leads to a strong upward move.

OGNUSDT 1WOGN ~ 1W
#OGN Buy gradually inside this pattern,. when Bullish returns it will be pumped hard. Minimum target 20%++

#OGN (SPOT) entry (0.0900- 0.1200)T.(0.5500) SL(0.0876)BINANCE:OGNUSDT
#OGN/ USDT
Entry ( 0.0900- 0.1200)
SL 1D close below 0.0876
T1 0.2000
T2 0.3000
T3 0.4400
T4 0.5500
1 Extra Targets(optional) in chart, if you like to continue in the trade with making stoploss very high.
______________________________________________________________
Golden Advices.
********************
* collect the coin slowly in the entry range.
* Please calculate your losses before the entry.
* Do not enter any trade you find it not suitable for you.
* No FOMO - No Rush , it is a long journey.
Useful Tags.
****************
My total posts
www.tradingview.com
1Million Journey
www.tradingview.com
www.tradingview.com
**********************************************************************************************
#Manta #OMNI #DYM #AI #IO #XAI #ACE #NFP #RAD #WLD #ORDI #BLUR #SUI #VOXEL #AEVO #VITE #APE #RDNT #FLUX #NMR #VANRY #TRB #HBAR #DGB #XEC #ERN #ALT #IO #ACA #HIVE #ASTR #ARDR #PIXEL #LTO #AERGO #SCRT #ATA #HOOK #FLOW #KSM #HFT #MINA #DATA #SC #JOE #RDNT #IQ #CFX #BICO #CTSI #KMD #FXS #DEGO #FORTH #AST #PORTAL #CYBER #RIF #ENJ #ZIL #APT #GALA #STEEM #ONE #LINK #NTRN #COTI #RENDER #ICX #IMX #ALICE #PYR #PORTAL #GRT #GMT #IDEX #NEAR #ICP #ETH #QTUM #VET #QNT #API3 #BURGER #MOVR #SKL #BAND #ETHFI #SAND #IOTX #T #GTC #PDA #GMX #REZ #DUSK #BNX #SPELL #POWR #JOE #TIA #TFUEL #HOT #AVAX #WAXP #OGN

Is #OGN Ready for a Bullish Reversal or More Downward Move?Yello, Paradisers! Is #OGNUSDT finally going for the breakout or another fake-out? Let's dive into the latest analysis of #OriginProtocol!
💎After 4-5 months of a slow and steady downtrend, #OGN is approaching a critical turning point. The price is currently testing the upper boundary of a Descending Channel, fueled by a strong bounce from the major support zone between $0.072 and $0.078.
💎To truly spark this rally, #OGN needs to clear a key obstacle—the minor resistance between $0.114 and $0.155, which previously acted as a strong support level. A breakout above this area, confirmed by increasing volume and the 20 EMA, could mean the bulls are ready to take over. If this happens, brace yourselves for a move toward the next major resistance.
💎If momentum stalls, we could see a pullback toward that crucial support zone between $0.072 and $0.078, retesting the breakout level. Failing to hold here could spell trouble, with #OGN potentially sliding back down to the $0.059 demand zone.
💎And here’s the real risk—if it breaks below that support, the bears will likely regain control, triggering a deeper correction and crushing any hopes of a short-term bullish recovery.
Stay focused, patient, and disciplined, Paradisers🥂
MyCryptoParadise
iFeel the success🌴

OGNUSDT ACCUMULATIONOGNUSDT ACCUMULATION, looking at forming ISHS or else it should breakout from the current resistance of FIB channel

OGNUSDT 1WOGN ~ 1W
#OGN This support block is a very good buy spot for now. Buy gradually on this support block with a minimum target of 20%+

OGN ANALYSIS🔮 #OGN Analysis 💰💰
🌟🚀 As we can see that #OGN is trading in a symmetrical triangle and given a perfect breakout with a huge volume. But there is an instant resistance. If #OGN breaks the resistance 1 then we will see a good bullish move in few days . 🚀🚀
🔖 Current Price: $0.0940
⏳ Target Price: $0.1260
#OGN #Cryptocurrency #DYOR

OGNUSDT(OriginProtocol) Updated till 14-09-24OGNUSDT(OriginProtocol) Daily timeframe range. PA staying above 0.0917 will be more optimal here. below that is a trouble zone. a valid confirm close above 0.0917 can push it toward 0.1145. some volume can help it on that if it comes.

OGN ANALYSIS (4H)We have a bullish CH on the chart and a strong move on the chart. The structure of OGN has recently become bullish.
We have a good support range on the chart.
If the price reaches the green range, we will look for buy/long positions.
The targets are clear on the chart.
Closing a daily candle below the invalidation level will violate the analysis
For risk management, please don't forget stop loss and capital management
When we reach the first target, save some profit and then change the stop to entry
Comment if you have any questions
Thank You

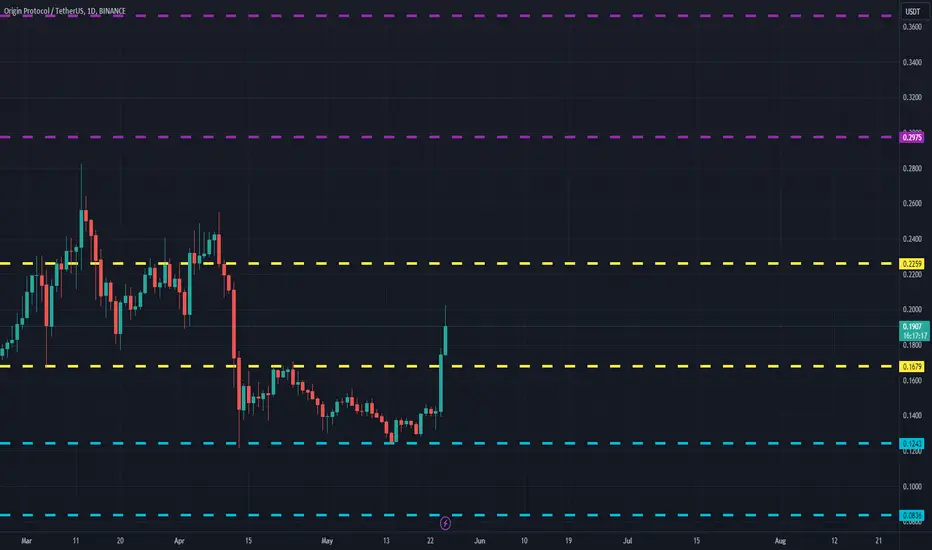
OGNUSDT(Origin Protocol) Daily tf Range Updated till 25-05-24OGNUSDT(Origin Protocol) Daily timeframe range. steadily tracing back. clean brokeout of 0.1679 and if it stays above this, it will visit 0.2259 again. a easy setup played out from swing low which is from 0.1243. smooth decent profit there.
OGN USDT Caught a perfect LONGIve been watching OGN from a few days, and on May 21, it broke out of the falling wedge. However due to BTC correction, OGN corrected a bit as well.
However, it maintained HL and I caught it so perfectly.

OGNI believe that OGN can touch red levels at least ... trade it only if u know what is DCA 🧐 ... it can pump directly(Blue scenario) or do the white scenario first.

OGNUSDT.4HIn the OGN/USDT 4-hour chart, we're seeing a clear ascending trendline indicating upward momentum over time. The chart includes the RSI and MACD indicators, which provide insight into the momentum and potential trend reversals.
The RSI is just below 60 at 59.20, which is typically considered bullish, but not excessively so — it's not in the overbought territory (above 70) that might suggest an impending correction. The MACD is almost imperceptibly above the signal line and close to the zero line, suggesting only a slight bullish momentum.
The price is currently between the support level (S1) at $0.1967 and the resistance level (R1) at $0.2866. The proximity of the price to R1 suggests that if the price can break and hold above this level, it could move toward the next resistance (R2) at $0.3238.
Given the ascending support line and the price's current level, the chart has a bullish look. The support levels below, S2 at $0.1575 and further down S3 at $0.1079, are significant in that a break below the ascending trendline and S1 could signal a potential reversal of the current trend and a test of lower supports.
As for a trading strategy, I would look for a confirmation of the breakout above R1 with an increase in volume to enter a long position. Conversely, if the price were to break below the ascending trendline and S1, it would be prudent to consider exiting long positions or potentially taking a short position, with appropriate risk management strategies like stop losses placed just below S1 or the trendline to limit potential losses. The use of further confirmation, such as candlestick patterns or additional indicators, could enhance the robustness of these entry and exit points.

Ogn/Usdt Looks Promising For Breakout The OGN/USDT trading pair is showing signs of a potential breakout opportunity. Currently trading beneath a triangle pattern, there is anticipation for an imminent breakout from this formation. In the event of a successful breakout, analysts project a substantial bullish movement ranging between 25-50%. However, it is crucial to exercise caution as this analysis should not be considered as definitive financial advice. Be sure to conduct your own research (DYOR) before making any trading decisions and always wait for confirmation before taking any action.

$OGN about to make a 17x move before 1 March 2024? Target: 2.6$Today we are analyzing Origin Protocol. Currently very bullish looking at the chart and have a target of 2.6$ for the upcoming 3 months.
That is a 1700%+ move, crazy right? But there is a reason for this crazy thought. There has been some historical developments that are happening right NOW, just before it made a 3000% move in 2021.
We are seeing the same things:
Since 14 february 2021:
Not shown on this chart. The 20 and 50 SMA has crosse the 100 day SMA on the 2D chart. Last time this happened was just before the major spike up.
Since 30 july 2022:
Not shown on chart. MACD cross on the 10D and still holding positive cross. Last time this happened was 21 january 2021. Another positive indicator that shows a green sign.
Since 15 april 2021:
The price of OGN has been in an continues downtrend. The triangle as shown on the chart (white lines) shows where the resistances are. Currently it is flirting with a 2.5+ year resistance. We are bound to break out!
Since 1 June 2023:
The RSI has been in an continues uptrend now nearing RSI above 90+.
Look at the pink circles. The last time this happened it move 2900% in 48 days.
Since 10 july 2023:
Not shown on chart. We see a massive increase of volume, pay attention, volume not price! Even double the volume of what we asaw in the bullrun of 2021 where the price went parabolic. This is a clear sign of accumilation of the smart hands and whales. Slowly, but surely filling their bags before they it gets send.
Since 25 nov 2023:
Gaussian Channel turned Green on the 4D (!).

OGN/USDT Keep an eye on the demand area, Potential bounce back!💎 OGN has recently encountered significant developments in the market. There is potential for OGN to retest the demand area around $0.198 before resuming its upward movement and possibly reaching our target area.
💎 The demand area holds significant importance, as a strong bounce from this level could signal continued upward momentum for OGN.
💎 However, if OGN breaks down below the demand area, it would indicate a shift to bearish sentiment. Additionally, if the breakdown extends to the support trendline, it could lead to further downward movement.
